Stocks Are Following The 1968 Analog
When seeking somewhat comparable historical analogues to the current unprecedented period in capital markets, Bank of America’s Michael Hartnett writes in his latest Flow Show that bulls can point to 2017/18, strong growth, range-bound yields, dithering Fed, and await the final melt-up… while bears point to 2007/8, as a sinister series of deleveraging “events” ended with a “Minsky Moment.”
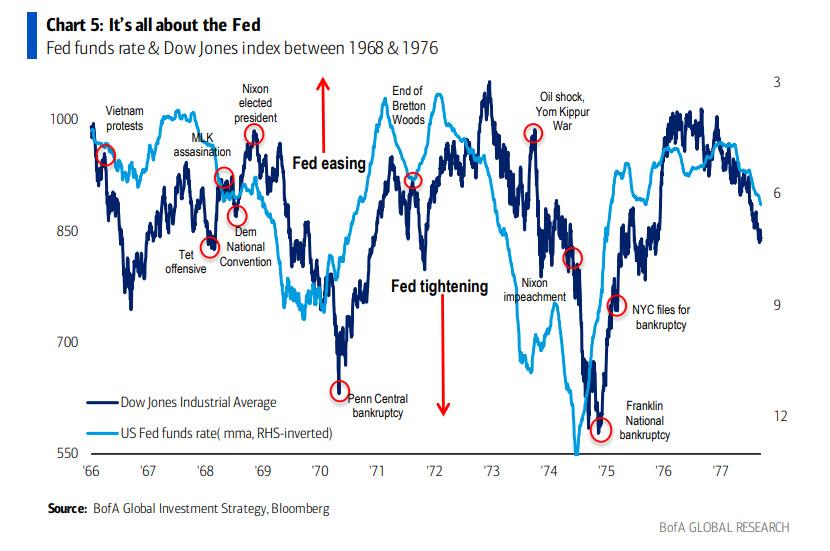
For his part, the BofA Chief Investment Strategist prefers the 1967-69 analog of interest rates unanchored by large budget deficits attempting to pacify populist and polarized electorates, an excessively easy and complicit Fed, and inflation rising to multi-year highs, as summarized in the chart below which confirms that “it’s all about the Fed”, both in 1968… and now.
For those who were not around then, here is a reminder of what happened:
-
1967: yields +1001bps, stocks +24%, vol -37%…winners small cap, tech & growth…losers volatility, government bonds, defensives
-
1968: yields +32bps, stocks +11%, vol +5%…winners banks, value, small cap, energy…losers government bonds, tech, credit.
-
1969: yields +89bps, stocks -8%, vol +99%…winners volatility, copper, pharma, tech; losers energy, small cap, value & banks.
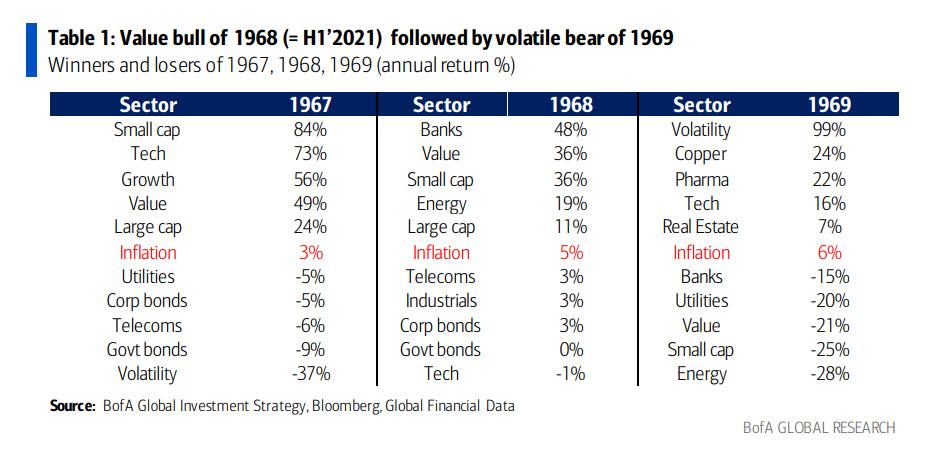
How did it end? Unhappily, as the value bull of 1968 (comparable to the first half of 2021) was followed by the volatile bear of 1969… which then was followed by the 1970s – the decade when the US almost succumbed to hyperinflation and only 20% interest rates courtesy of Paul Volcker prevented the premature collapse of the American empire.
Tyler Durden
Fri, 05/21/2021 – 16:20
via ZeroHedge News https://ift.tt/3hL6QZC Tyler Durden