La Niña Ended In May, So When Is The Break From This Heat In The US?
Authored by Mike Shedlock via MishTalk.com,
La Niña weather patterns generally associated with dry condition in the Southwest ended in May. So when is the relief?
El Niño and La Niña
SciJinks discusses the Difference Between El Niño and La Niña.
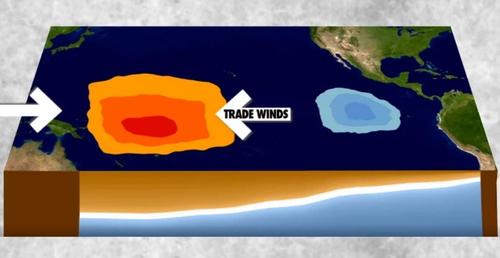
In Spanish, El Niño means “the little boy” and La Niña means “the little girl.” They are sort of like a brother and sister. Like many siblings, the two weather patterns are opposites in almost every way. La Niña causes water in the eastern Pacific to be colder than usual. In the same region, El Niño can cause the water to be warmer than usual. Areas that are hit with drought during La Niña years are pummeled with rain in El Niño years.
El Niño and La Niña: Frequently Asked Questions
Climate.Gov discusses Frequently Asked Questions.
El Niño and La Niña are opposite phases of a natural climate pattern across the tropical Pacific Ocean that swings back and forth every 3-7 years on average. Together, they are called ENSO (pronounced “en-so”), which is short for El Niño-Southern Oscillation.
The ENSO pattern in the tropical Pacific can be in one of three states: El Niño, Neutral, or La Niña. El Niño (the warm phase) and La Niña (the cool phase) lead to significant differences from the average ocean temperatures, winds, surface pressure, and rainfall across parts of the tropical Pacific. Neutral indicates that conditions are near their long-term average.
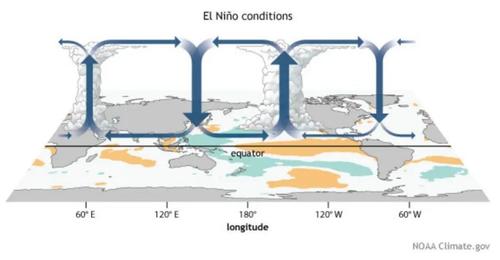
El Niño Conditions
During El Niño, the surface winds across the entire tropical Pacific are weaker than usual. Ocean temperatures in the central and eastern tropical Pacific Ocean are warmer than average, and rainfall is below average over Indonesia and above average over the central or eastern Pacific.
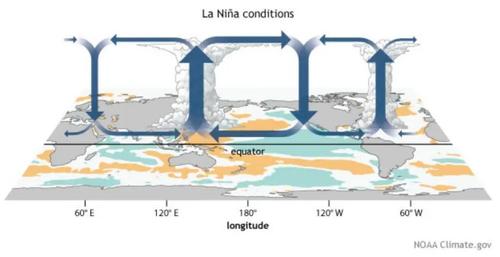
La Niña Conditions
During La Niña, it’s the opposite. The surface winds across the entire tropical Pacific are stronger than usual, and most of the tropical Pacific Ocean is cooler than average. Rainfall increases over Indonesia (where waters remain warm) and decreases over the central tropical Pacific (which is cool). Over Indonesia, there is more rising air motion and lower surface pressure. There is more sinking air motion over the cooler waters of the central and eastern Pacific.
How long do El Niño and La Niña typically last?
El Niño and La Niña episodes typically last 9-12 months. They both tend to develop during the spring (March-June), reach peak intensity during the late autumn or winter (November-February), and then weaken during the spring or early summer (March-June).
Both El Niño and La Niña can last more than a year, but it is rare for El Niño events to last longer than a year or so, while it is common for La Niña to last for two years or more. The longest El Nino in the modern record lasted 18 months, while the longest la Niña lasted 33 months. Scientists aren’t sure why the duration of the two types of events can be so different.
Does global warming affect El Niño and La Niña?
There are many ways in which global warming could affect the frequency and intensity of El Niño / La Niña (see this ENSO blog post, for example), but scientists currently have low confidence in their ability to predict exactly how a warmer world affect the ENSO. Scientists have high confidence, however, that ENSO itself has been occurring for thousands of years, and will continue into the future. Global warming is likely to affect the impacts related to El Niño and La Niña, including extreme weather events.
Bye for Now, La Niña!
On May 13, Climate.Gov said Bye for Now, La Niña!
La Niña conditions have ended and NOAA forecasters estimate about a 67% chance that neutral conditions will continue through the summer. The ENSO forecast for the fall is less confident, with odds of a second-year La Niña currently hovering around 50–55%.
That’s the problem. La Niña has ended but there is no El Niño in sight. Worse yet, the odds of another La Niña are about 50%.
Blistering, Record-Breaking Heat
We searched through decades of weather data to look for a precedent to this heatwave: there isn’t any. https://t.co/gDOKueOkwt My first NYT byline!
— Aatish Bhatia (@aatishb) June 29, 2021
Potentially dangerous heat wave on the way this weekend. Some areas could reach 40 degrees C. The heat will begin Friday and could last through Tuesday. @GlobalBC #BCStorm pic.twitter.com/fDoGGBkeD7
— Kristi Gordon (@KGordonGlobalBC) June 23, 2021
Canada has a NEW national record for highest all-time temperature: As of 2:30pm local time, #Lytton, B.C. has unofficially hit 45.5°C — surpassing the hottest temperature on record, set in Midale & Yellow Grass, SK in July 1937. #BCHeat #BCHeatwave #WxTwitter pic.twitter.com/kFYqvx1rKD
— The Weather Network (@weathernetwork) June 27, 2021
Lytton, B.C. hit 113.9 degrees F, 45.5 degrees C. Amazing. Then it smashed that record.
The temperature in Lytton hit 47.9 C on Monday, breaking the record for highest recorded in Canadian history — set just one day earlier — by more than a degree. For context, that’s hotter than the hottest temperature ever recorded in Las Vegas. https://t.co/rd2zedlT0d
— CBC British Columbia (@cbcnewsbc) June 29, 2021
47.9 Degrees C is 118.2 degrees F. Wow!
When Does It End?
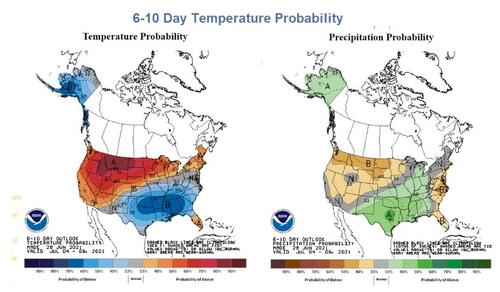
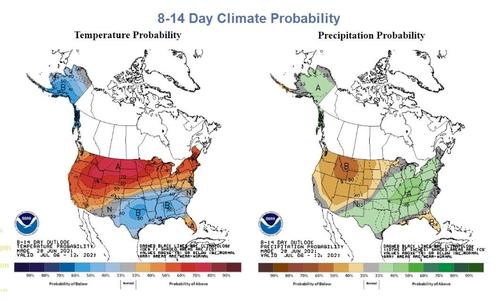
Climate Predictions 6-10 Days
8-14 Day Climate Probability
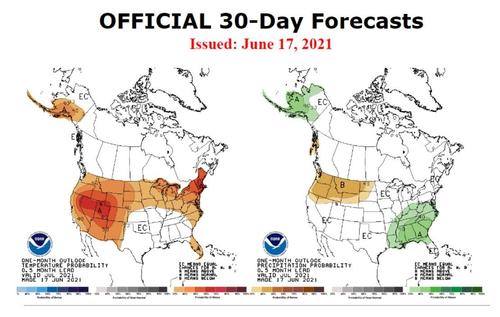
Official 30-Day Forecast
The above maps are from the National Weather Service Climate Prediction Center.
Unfortunately, the models see no end to the heat wave. And the odds of rain are generally below average where rain is needed the most.
World Record Update
🇨🇦Canadian national record ride is over: 49.6C/121.3F. Previous WORLD record above 50N of latitude was 44.4C/112F. To have an idea of the exceptionality of this value,this map by climatologist @Climatologist49 shows the few US stations with a higher temperature record than Lytton https://t.co/kCiwAvRKlT
— Extreme Temperatures Around The World (@extremetemps) June 30, 2021
* * *
Like these reports? I hope so, and if you do, please Subscribe to MishTalk Email Alerts.
Tyler Durden
Wed, 06/30/2021 – 10:59
via ZeroHedge News https://ift.tt/3h8fNvD Tyler Durden
