Just How Big Is China’s Property Sector, And Two Key Questions On Policy And Tail Risks
While the broader US stock market was giddily melting up in the past week, things in China were going from bad to worse with Evergrande set to officially be in default on Oct 23 when the grace period on its first nonpayment ends, and with contagion rocking the local property market – which as we explained last week just saw the most “catastrophic” property sales numbers since the global financial crisis – sending dollar-denominated Chinese junk bonds to all time high yields.
So even though it is now conventional wisdom that China’s property crisis is contained (just as its concurrent energy crisis is also somehow contained), we beg to differ, and suggest that the crisis hitting the world’s largest asset class is only just starting and is about to drag China into a “hard landing”, with the world set to follow.
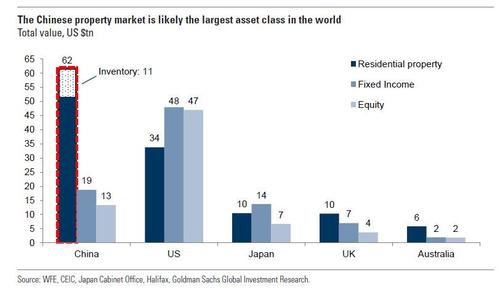
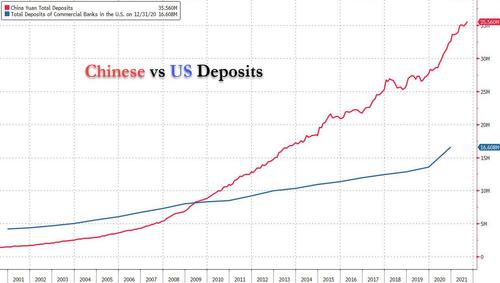
And yes, with a total asset value of $62 trillion representing 62% of household wealth, the Chinese real estate sector is not only 30 times bigger than the market cap of all cryptos and also bigger than both the US bond and stock market, but is the key “asset” that backstops China’s entire financial system whose deposits at last check were more than double those of the US. In other words, if China’s property sector wobbles, the world is facing a guaranteed depression.
So given the escalating weakness in China’s property sector, which has been in focus given intense regulatory pressure on developers’ leverage and banks’ mortgage exposure, and consequent contraction in sales and construction activity, it is natural to ask how significant a hit this could pose to both China’s and the global economy. To help people get a sense of scale, below we excerpts some of the key findings from a recent note from Goldman showing just how big China’s property sector is.
- A wide range of estimates for the scale of China’s property sector — up to about 30% of GDP — have been reported in the media and by other analysts. Different definitions of the scope of the sector largely account for the disparity.
- The most important distinctions are what types of building are included (residential, nonresidential, or all construction including infrastructure), what economic activity is included (only the construction itself, or all the value-added embedded in the finished residence e.g. domestically produced materials), and whether related real estate services are also included.
- A narrow definition of “residential construction activity as a share of GDP” could be as low as 3.6% of GDP. Expanding this to include all related domestic activities – e.g. materials like metals, wood, and stone produced domestically and used in housing construction, as well as services like financial activities and business services used directly or indirectly by the housing sector – would account for 12.4% of GDP. Adding nonresidential building construction and its associated activity would take it to 17.7%. Finally, including real estate services—which show a high correlation with broader property trends—would take the number to 23.3%. (All these numbers are based on detailed 2018 data, and exclude infrastructure spending not directly related to residential and nonresidential buildings.)
- The property sector’s share of the Chinese economy has grown fairly steadily over the past decade, after surging in the stimulus-fueled recovery just after the 2008 financial crisis.
Digging into the definition of the “property sector”, there are three main questions that need to be kept in mind:
1. What types of construction? One important difference is in what types of construction activities are included. Construction broadly consists of three categories: residential housing, nonresidential buildings, and infrastructure-related construction. In China, residential construction appears to be about half of total construction—the rest is either non-residential building construction or civil engineering works, plus a small amount of installation/decoration activity. Specifically, residential and nonresidential buildings represent around 70% of total construction, and residential floor space under construction is typically about 70% of total floor space under construction.
Note that this ~50% share for residential share of total construction is not unusual in international perspective. For example, the residential share is similar in the United States—though it reached into the 60-70% range during the peak years of the housing bubble—and has been about 40-50% in South Korea for some time.
2. What types of economic activity (only construction, or everything necessary to complete the finished building)? An even more important distinction is what types of activities one counts. Strictly speaking, the construction industry itself represents about 7% of China’s GDP. This represents wages, profits, and taxes from the construction sector (regardless of what type of construction or what end users). This is the value added of the construction sector itself, or the narrowly defined activity of building things.
However, the construction industry uses a lot of output from other sectors – both materials (cement, wood, steel, etc.) and services (transportation of materials, financial services) to create finished buildings. Put another way, there are a lot of “backward linkages” from the construction sector: a home purchase requires not just the value added from construction industry, but also the value added from the “upstream” industries that provided the materials and were otherwise involved in the completion of the finished product.
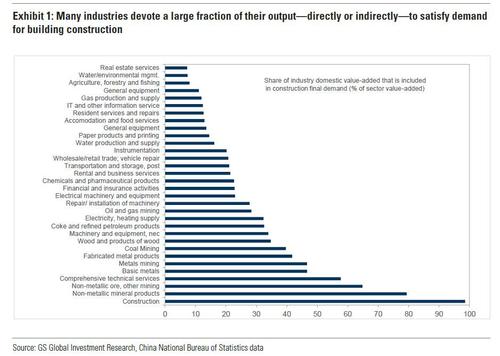
To gain some intuition for this, in the chart below, Goldman shows how much of each industry’s domestic value added ultimately goes into “final demand” of the construction industry (purchases of property by consumers or investment in property by businesses). For example, about one-third of value added in “wood products” goes into construction, about one-half of basic metals value added goes into construction, and essentially all of construction’s value added goes into construction final demand. (Note that this includes direct and indirect requirements—for example, basic metal output that is sold to firms in the metal fabrication industry that then sell to the construction sector would be counted as part of final demand for construction.)
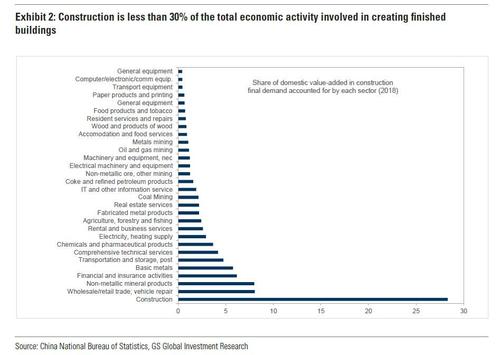
The next chart shows what fraction of the final demand for construction is provided by each sector. Roughly speaking, if we think about this as “the total domestic value added embedded in an apartment”, almost 30% of this is provided by construction activity, 8% from nonmetallic mineral products, etc.
From the perspective of total domestic value added from all industries embedded in the final demand of the construction industry, the overall construction industry’s final demand accounts for roughly one-quarter of China’s GDP. This estimate is based on China’s most recent (2018) “input-output” table—which indicates the final output of each industry, as well as how much input is used from every other.
3. Should real estate services be included. Some analysts focus on property construction only, while others add the “real estate services” sector e.g. the leasing and maintenance of buildings when estimating the impact of the housing sector of the economy. These activities contribute roughly 6-7% of GDP in China. In many countries, real estate services are somewhat less volatile than housing construction. The likely reason is that real estate services relate in part to the stock of existing buildings than the flow of new building construction. Even if there were a housing crash and building construction stopped, most real estate services could theoretically continue. As evidence of this, in the US housing crash, construction sector GDP fell by ~30% peak to trough but real estate services never declined. That said, in China the “real estate services” sector has been significantly more volatile, almost as volatile as the construction sector itself.
Contributions by type of demand and activity
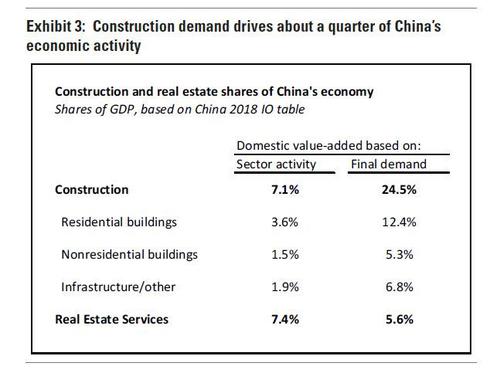
Taking these three factors into consideration, Goldman next shows estimated shares of China’s activity in the next chart, and breaks down construction into its main components while showing the share attributable to real estate services. The “sector activity” column shows the share of GDP accounted for directly by activities of that sector. In other words, companies and workers engaged in all types of construction activity accounted for 7.1% of China’s GDP in 2018. The “final demand” column shows the share of GDP accounted for by all the domestic economic activities embodied in final demand for that sector. In other words, the demand for buildings and other construction also generates demand for materials and other types of services — and adding the value added in construction and all of these “upstream” sectors together gives the numbers in the right column
Putting the above together, the size of China’s property sector therefore depends on the question we want to answer:
- What share of Chinese economic activity do workers/companies involved in residential construction represent? Here, one should look at domestic value-added (the left column). This is 7.1% for overall construction and just 3.6% for residential construction only.
- How much economic activity is driven by demand for residential property construction? Residential property demand drives 12.4% of GDP (right column, second row in table), because in addition to the construction activity it creates demand for all the materials and other services involved in building construction.
- What about the impact of total demand for property construction? Including non-residental buildings as well as residential, and the total upstream requirements of both, we want to look at the “domestic value added in final demand” of construction of residential + nonresidential buildings. This is 17.7% of GDP (12.4%+5.3%).
- How much of the economy is at risk from a property downturn? Here, we could potentially add end demand for real estate services to the above calculation. This would be another 5.6% of GDP, suggesting 23.3% of the economy—nearly a quarter—would be affected.
Finally, if one adds all construction and all real estate and all their associated activities, we get just over 30% of the economy (24.5%+5.6%), although it is worth caveating that this may be an overly broad definition for the property sector, as it includes infrastructure-related activity, which if anything is likely to be ramped up by policymakers in the event of severe property sector weakness.
* * *
Yet even a nice big, round 30% estimate for how much China’s property sector contributes to GDP, does not encompass all the potential spillovers from a construction sector downturn. There are at least three others:
- Second-round effects. A shock to construction (or any other sector) implies a drop in wages and company profits in that sector. This in turn implies lower income for the household and business sectors — and incrementally lower consumption and investment respectively. Such “second-round” or “multiplier” effects aren’t included in the estimates above.
- Fiscal spillovers. Land sales represent an important part of local government revenues in China (roughly 1/3 in gross revenue terms). Governments acquire land usage rights from rural occupants and sell them at a premium via auctions to developers. If land sales revenues fall because of a housing downturn (through some combination of fewer successful auctions and/or lower land prices), budgets will be squeezed, which could limit local governments’ spending and investment.
- Spillovers abroad via imports. As the world’s largest trading nation, China does not get all of its construction materials and other intermediate inputs domestically. In addition to the estimates above, which focus on domestic value-added, about 11% of the total value added embedded in China’s construction final demand is from foreign sources. (This is about 3% of China’s GDP, although it makes more sense to look at each trading partner’s exposure relative to the size of its own economy.) So, if we wanted to look at the total size of China’s construction sector in terms of driving economic activity, regardless of where that economic activity occurs (perhaps to compare China’s construction sector to other countries with different levels of import intensity) the figure in the top right cell in Exhibit 3 would be 3% larger.
Putting it all together, and China’s property sector emerges as the mother of all ticking financial time bombs.
* * *
Which brings us to what is Beijing’s latest policy action (if any) to prevent this potential financial nuke from going off, and what are any additional tail risks to be considered.
Well, as noted above, China’s property sector began the week with sharp price falls across the board, with China’s junk bonds cratering to near all time lows and with signs that the concerns are spilling over to the broader China credit market with spreads widening across the board. Some key updates:
- Recent news suggest China property stresses are building up. A number of China property HY developers have made announcements over recent weeks regarding their upcoming bond maturities.
- On 11 Oct, Modern Land launched a consent solicitation to extend the maturity on its USD 250mn bond due on 25 Oct by 3 months
- Xinyuan Real Estate announced on 14 Oct that the majority of holders of its USD 229mn bond due on 15 Oct have agreed to an exchange offer. Note that Fitch considers both transactions to be distressed exchanges.
- Furthermore, Sinic announced on 11 Oct that they are not expecting to make the principal and interest payments on its USD 250mn bond due on 18 Oct. These indicate that stresses amongst developers are building.
Meanwhile, the grace period on Evergrande’s missed coupon payments is ending soon. Evergrande missed coupon payments of USD 148MM on 11 Oct. This came after missing an earlier coupon payment on 23 Sep. The earlier missed coupon has a 30-day grace period, which ends on 23 Oct, and should that not be remedied in the coming week, the company will be in default on this bond. With Evergrande USD bonds priced at around 20, a potential default is unlikely to have large market impact, though if the company is able to remedy the earlier default, this could provide a positive surprise for the market.
Despite these mounting risks, the market staged a sharp rebound at the end of the week, with news emerging that policymakers are seeking to speed up mortgage approvals (if not followed by much more aggressive easing, this step will do nothing but delay the inevitable by a few days).
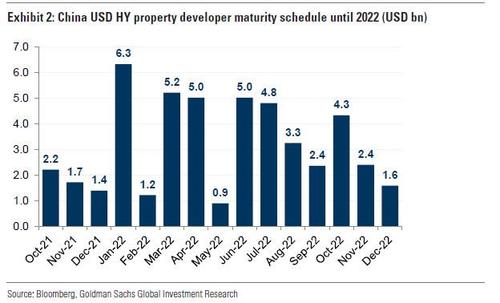
And while Goldman’s China credit strateigst Kenneth Ho writes overnight that valuation is cheap across the lower rated segments within China property HY, market direction hinges on whether they will be able to refinance and avoid defaults. In particular, he notes that with $6.2bn of China property HY bonds maturing in Jan 2022, policy direction in the coming two months will be key. And since Goldman remains in the dark as to what Beijing will do next, as it remains “difficult to foresee how policy developments will play out in the coming weeks”, Goldman prefers to wait for clearer signs of policy turn before shifting lower down the credit spectrum.
* * *
This brings us to what Goldman calls two key questions on China property – policy and tail risks, which will dictate the direction of the China property HY market.
As discussed in depth in recent days, Beijing’s tight regulatory stance is increasingly affecting a broader set of developers, as slowing activity levels are adding to worries across China property HY. For the period from early August to the first week of October, the volume of land transactions cratered by 42.5% compared with the same period last year, and for property transaction volume, this fell by 27.0%.
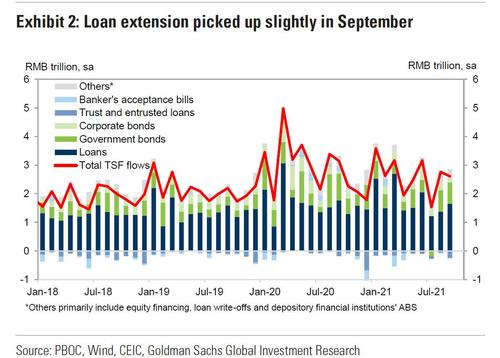
Difficult credit conditions and weak presales add pressure to developers’ cash flows, and these factors are what led to the pick up in defaults and stresses in China property HY. Therefore, unless there are clear signs of an easing in policy direction, Goldman warns that tail risks concerns are unlikely to subside, and these will dictate the direction of China property HY market. As noted by Goldman’s China economics team, credit supply holds the key to China’s housing outlook in the near term, emphasizing the need for policy adjustments in order to stabilize the housing market. Incidentally, the latest monthly Chinese credit creation numbers showed a modest miss to expectations, as total TSF flows came in at 2.928TN, just below the 3.050TN consensus, and up 10.1% Y/Y, lower than the 10.3% in August (the silver lining is that M2 rose 8.3%, up from 8.2% in August and above the 8.2% consensus).
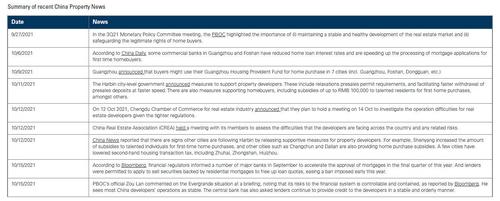
That said, given the sharp slowdown in residential property activity levels over the past two months, policy stance appears to have relaxed over the past two weeks if somewhat more slowly than most had expected. The table below summarizes a number of policy announcements and news reports that suggest some easing of policies are taking place.
That said, the announcements and policymakers’ statements do not signal a large shift in overall policy direction yet. For example, the more concrete measures such as home buyer subsidies and the reduction in home loan interest rates are conducted at a city, and not national, level. And whilst Bloomberg reported that the financial regulators have informed a number of major banks to accelerate mortgage approvals, the precise details are lacking. The recent actions are therefore mostly in line with the overall policy stance. On one hand, policymakers remain focused on the medium term goal of deleveraging, and will want to avoid over-stimulating and reflating the property sector; on the other hand, policymakers have stated that they want a stable property market and to avoid systemic risks from emerging, suggesting that they would seek to avoid over-tightening. The problem is that they can’t have both, and one will eventually have to crack.
Goldman is somewhat more optimistic and writes that finding a balance will take time, adding that “given the need to balance the competing policy objectives, further measures could continue to emerge piecemeal, and visibility on the timing and the type of policy actions are limited.” Furthermore, there may need to be further downside risk towards the property sector before we see a more decisive change in direction in the policy stance. This means that tail risks concerns are unlikely to subside, despite signs that policy direction is gradually shifting.
* * *
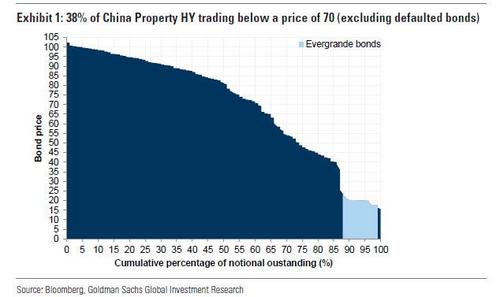
Assuming help does not come on time, the next key question is how fat is the tail as large amounts of bonds trading at stressed levels. Currently, the China property market is pricing in elevated levels of stress. Their price distribution is shown below indicating that 38% of bonds (by notional outstanding and excluding defaulted bonds) are trading at a price below 70, and 49% of bonds are below a price of 80.
Are market prices overly bearish on tail risk, or are they accurately reflecting the stresses amongst property developers? With policymakers likely to maintain their medium term goal to delever the property sector, it is unlikely that tail risk concerns for higher levered developers will not subside. However, how “fat” the tail is will depend on the policy stance over the next two months.
A big challenge going forward is that there are sizeable bond maturities in the next year, which will heavily influence tail risk. As noted above, a number of developers have conducted or are seeking to complete distressed buybacks, and defaults rates amongst China property HY companies are soaring. As such, the policy stance in the next two months will be critical.
As shown in Exhibit 2, China property HY bond maturities are relatively light for the remainder of 2021, but pick up substantially in 2022, with USD 6.3bn of bonds maturing in January alone!
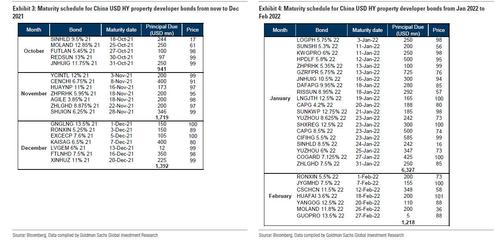
A full list of bond maturities from now to February 2022, is shown below.
It goes without saying, that should policy easing over the next two months be insufficient to ease the financial conditions amongst developers, there could potentially be a meaningful pick up in credit stresses at the start of 2022 just as the Fed launches its taper and just as a cold winter sends energy costs to unprecedented levels.
Finally, for any investors seeking some exposure to China’s HY market assuming that the worst is now over, Goldman agrees that while valuation is cheap across the lower rated segments within China property HY, the key determinant on market direction won’t be valuation, but rather hinges on whether developers will be able to refinance and avoid defaults – i.e., can the Ponzi scheme continue.
Tyler Durden
Sat, 10/16/2021 – 18:00
via ZeroHedge News https://ift.tt/2XkyUeP Tyler Durden

