Most Popular Hedge Fund Stocks Suffer Record Stretch Of Underperformance: Here’s Why
Three months ago, we reported that according to Goldman calculations, the first half of 2021 was the worst 6 months since the financial crisis, with the bank noting that “one factor weighing on hedge fund returns has been the extraordinarily weak performance of the most popular hedge fund long positions” coupled with continued strong gains by the most popular shorts, which served as a double whammy to hedge fund alpha.
Among the various reasons cited for the poor performance of long books was the collapse in Chinese stocks, very popular among hedge funds at the start of the year, which had been clobbered in 2021 as a result of Xi Jinping’s new “shared prosperity” drive and escalating crackdowns against whole sectors of the market which sent some of the most popular Chinese names into a tailspin.
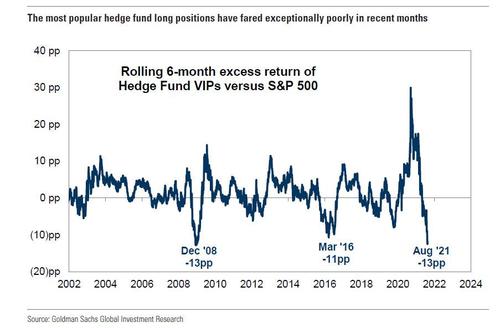
Fast forward to this weekend, when Goldman’s Ben Snider writes in the bank’s latest Hedge Fund Trend Monitor report (which analyzes 799 hedge funds with $2.9 trillion of gross equity positions ($2 trillion long and $918 billion short) based on 13F filings as of Nov 15), that the pain extended for one more quarter, and as of Sept 30, “the most popular hedge fund long positions have suffered a record stretch of underperformance this year.” This comes at a time when according to HFR, the typical US equity hedge fund has returned just 13% YTD (Goldman Sachs Prime Services data show an average return of 11% YTD through October), roughly half the return of the broader S&P500, with nearly 10 percentage points of that return generated in the first four months of the year.
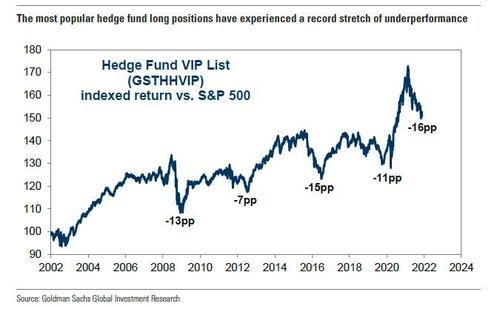
Specifically, since February, Goldman’s Hedge Fund VIP list of the most popular hedge fund long positions (GSTHHVIP) “has lagged the S&P 500 by 16 percentage points (+6% vs. +22%), exceeding the period in 2015-2016 as the basket’s worst on record.” As shown in the chart below, the Hedge Fund VIP list (GSTHHVIP) of the most popular hedge fund long positions has lagged the S&P 500 by 16 percentage points since February (+6% vs. +22%), exceeding the period in late 2015 and early 2016 as the worst stretch for the basket relative to the market in its history of nearly 20 years.
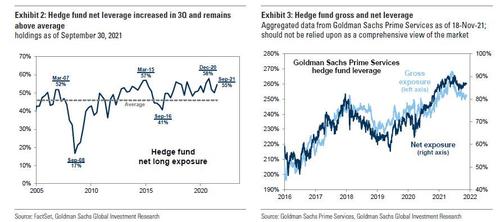
As discussed here in recent weeks, while hedge fund leverage remains elevated relative to history, it is below recent highs, suggesting funds were not fully prepared for the market rally at the start of 4Q. Aggregate hedge fund net leverage calculated based on publicly-available data registered 55% at the start of 4Q, above the historical average but below the 58% exposure at the start of 2021. Higher-frequency exposures calculated by Goldman Sachs Prime Services show hedge fund net leverage that peaked in June and now ranks close to the average level of the past 12 months, though still in the 80th percentile of the past three years.
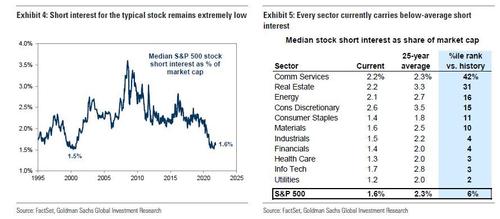
Consistent with elevated hedge fund net leverage, and perhaps following the catastrophic – for shorts – Q1, short interest for the typical stock remains close to the lowest level on record. Short interest for the median S&P 500 stock declined from 2.2% of cap at the start of 2020 to 1.5% at the start of 2021 and has remained roughly stable since. This matches the degree of short interest during the Tech Bubble in 2000 as the lowest in at least 25 years. Short interest in every sector ranks below the 25-year average.
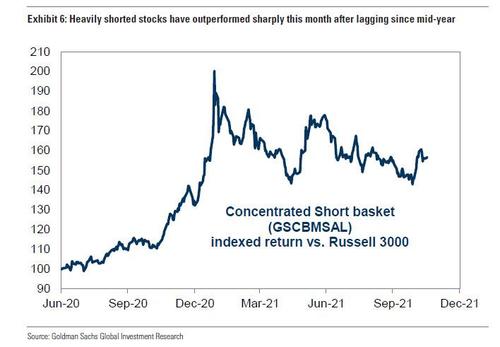
In retrospect, it’s a good thing hedge funds trimmed their short exposure: it’s no secret that while popular shorts generally underperformed the market during 3Q, they have rallied sharply in recent weeks, weighing again on hedge fund returns. In fact, according to Snider, a monthly-rebalanced basket of the most concentrated short positions (GSCBMSAL) lagged the Russell 3000 by over 20 percentage points between the end of June 2021 and the end of October (-16% vs. +5%). However, during the first week of November, the shorts jumped by 16%, outperforming by 13 pp. As we have frequently discussed over the past month, this surge was coincident with a rise in retail trading activity.
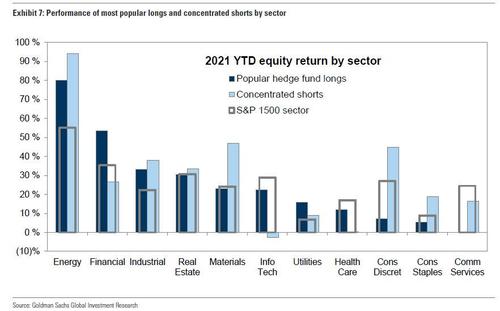
Drilling down into the pain, on a sector basis, concentrated shorts have created the most pain in the Consumer Discretionary and Materials sectors YTD. Portfolios of the most concentrated shorts in those sectors have dramatically outperformed both the most popular hedge fund positions and the aggregate sectors this year. In other words, for yet another quarter, going long the most popular shorts – something we first said in 2013 is the only winning strategy in this broken, manipulated market – has been the best trade!
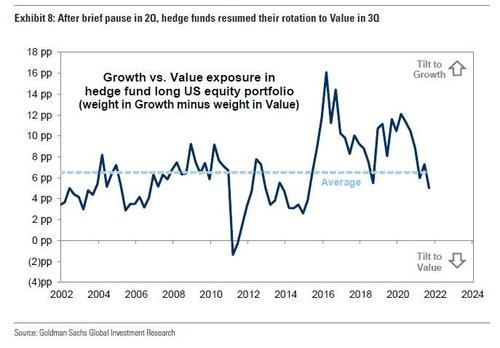
Adding insult to injury, in addition to the latest squeeze, at a factor level funds entered 4Q with their smallest Growth tilt since early 2015, but Growth has outperformed so far this quarter. Funds are typically tilted to Growth but began to rotate toward Value in mid-2020 as the economy and equity market began to rebound. Funds temporarily shifted back to Growth in 2Q 2021 but resumed their rotation to Value during 3Q. Since the start of 4Q, Goldman’s sector-neutral, long/short Growth factor (GSMEFGRO) has returned 4% and the Russell 1000 Growth index has outperformed the Value index by 7%.
Here it’s worth noting that while hedge funds took down their overall market exposure in Q3, retail investors did the opposite, and as Snider notes, one reason short interest has declined so dramatically is the still-elevated degree of retail trading activity in the equity market. After surging in late 2020 and early 2021, retail trading activity appeared to stabilize this summer but has risen again in the last several weeks, particularly in call options. Since early last year, changes in retail trading activity have been reflected in the performance of the most popular retail stocks as well as in the stocks with the most concentrated short interest. During the last few weeks, as retail trading activity increased, a basket of the most concentrated short positions (GSCBMSAL) rallied by 16% vs. 4% for the Russell 3000.
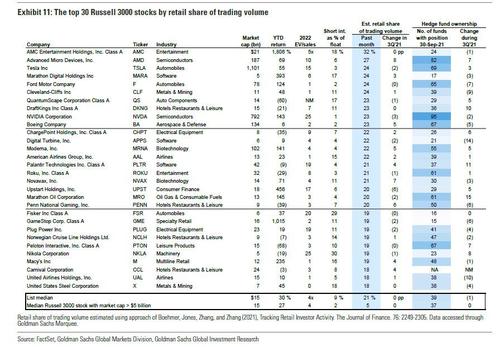
The chart below shows the top 30 Russell 3000 stocks based on the estimated retail share of trading volume during the past month. As before, the stocks in this list generally carry higher short interest than the typical Russell 3000 stock. Of these 30 stocks, only AMD and NVDA are constituents of the Hedge Fund VIP list. We will have more to say on the retail most popular/most shorted stocks in a subsequent post.
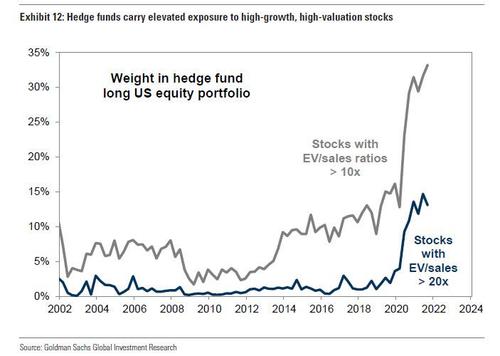
Still, before you cry for hedge funds, it’s worth noting that they are now suffering the consequences of their own greedy actions. As Goldman notes in its HF tracker, “surprisingly, while hedge funds rotated long portfolios toward Value during 3Q, they also lifted the weight of high-multiple growth stocks to a new record.” In other words, they took the barbell trade to absolute extremes, betting on deep value and extremely overvalued, high growth names. While stocks with EV/sales ratios over 10x account for 23% of Russell 3000 market cap, they account for a third of US equity hedge fund long portfolios in aggregate, up from 31% at the start of 2021 and 16% at the start of 2020. That said, funds slightly trimmed their exposure to stocks with EV/sales multiples over 20x.
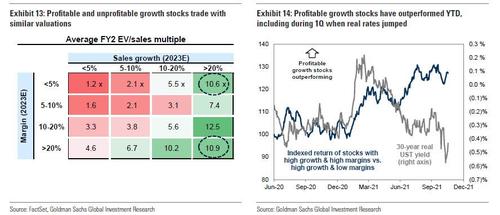
While it’s obvious by now, Snider explains that “extremely low interest rates [i.e., thank you, Fed] and investor focus on future growth have created a large premium for stocks with very fast revenue growth without regard for the profitability of those companies. The average Russell 3000 stock with consensus 2023 revenue growth greater than 20% and a profit margin over 20% trades at 11x FY2 EV/sales, roughly the same multiple as a stock with 20%+ growth but low or no profitability.”
Goldman cautions that while many of these high growth, low profit companies have attractive outlooks, the dependence of their current valuations on long-term future cash flows makes them particularly vulnerable to the risks of rising interest rates or disappointing revenues. The outperformance of highly profitable growth stocks this year, particularly during 1Q when real interest rates jumped, underscores their attractiveness relative to growth stocks with low profitability.
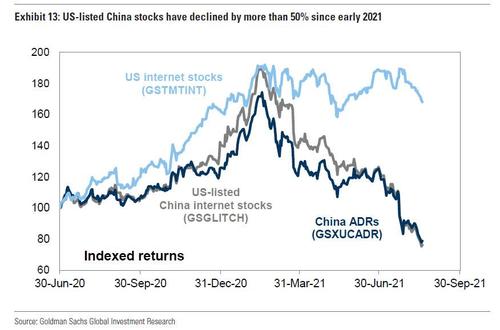
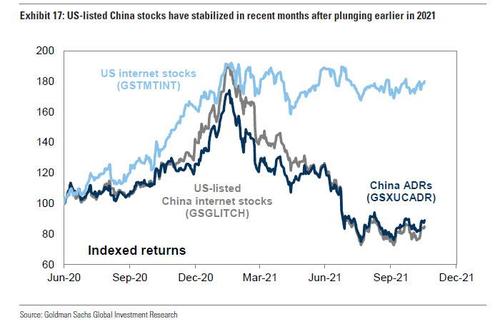
As mentioned above, a key reason for hedge fund underperformance in Q3 was the continued aversion to all things Chinese. While prices of US-listed China stocks generally stabilized in recent months, during 3Q hedge funds cut their exposures to the stocks to the lowest level since late 2018. China ADR share prices declined by more than 50% between mid-February and late August. The drop weighed on the returns of hedge funds, which entered 3Q 2021 with the largest exposure to China ADRs on record. The share of US hedge funds in Goldman’s sample with a long position in at least one China ADR registered 33% entering 3Q but dropped to 25% by the start of 4Q as prices fell and funds cut exposure.
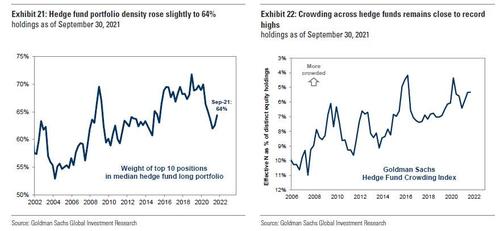
Turning attention to portfolio construction next, Goldman finds that hedge fund portfolio concentration rose modestly in 3Q 2021 but still remains far below pre-COVID levels. The typical hedge fund holds 64% of its long portfolio in its top 10 positions, slightly above the historical average but well below the 70% share at the end of 1Q 2020 – this underscores the importance of VIPs for overall hedge fund returns. Unlike the slight increase in concentration within hedge fund portfolios, crowding across hedge fund portfolios remained flat in the quarter; that said, Goldman’s crowding Index remains near the record highs of early 2016 and 2020.
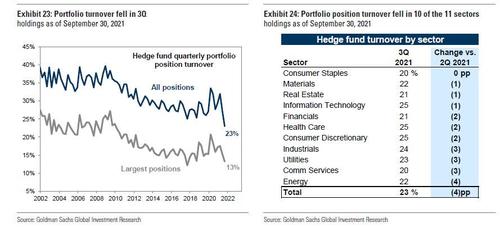
Amid the relentless market confusion of 2021 in general and Q3 in particular, portfolio paralysis has set in and as the net chart shows, portfolio position turnover continued its recent trend and declined in 3Q 2021. The average fund turned over 23% of distinct equity positions in 3Q, the lowest in at least 20 years. Turnover decreased in 10 of the 11 sectors with Consumer Staples the only exception.
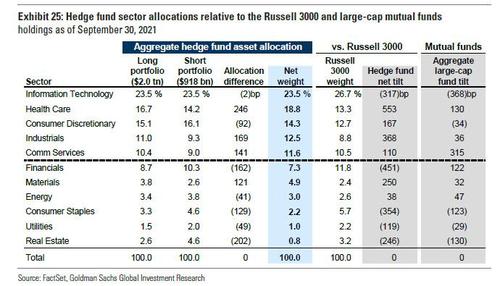
Looking at sector exposure, as before, Info Tech represents the largest sector net exposure (24%) but a large underweight (-317 bp) relative to the Russell 3000. Health Care Tech represents 19% of funds’ net exposure and is the largest overweight (+553 bp). Hedge fund and mutual fund sector tilts are generally in the same direction, with Financials representing a notable exception: Mutual funds carry a large overweight in the sector, but hedge funds have a net underweight tilt relative to the Russell 3000. Consumer Discretionary is the other point of disagreement between hedge funds (overweight) and mutual funds (underweight).
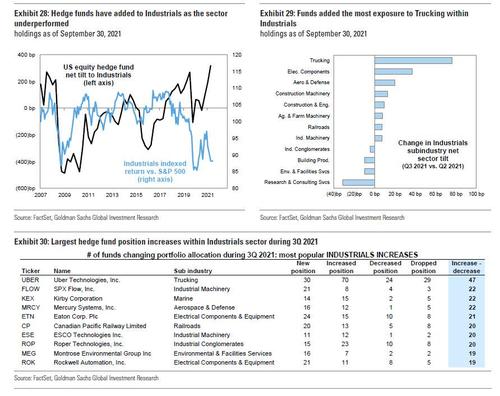
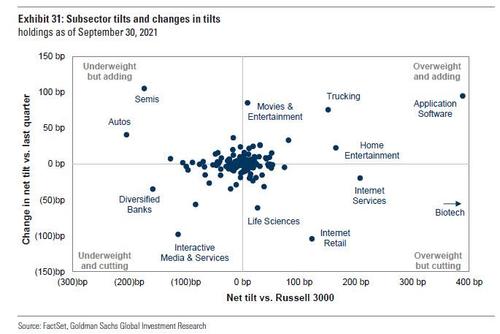
While IT remains unloved, funds increased net tilts to Industrials by 128 bp, the largest change in any sector. The current 368 bp hedge fund overweight in Industrials is the largest tilt at any point since at least 2007. Unfortunately, the sector has underperformed the S&P 500 by 11 pp since May, but Goldman economists expect economic growth to reaccelerate from 2.0% in 3Q 2021 to 4.5% in 4Q 2021 and 1Q 2022, which should benefit the most cyclical pockets of the sector (we’ll see about that after another round of covid lockdowns in the US). Within Industrials, hedge funds added the most to Trucking and Electrical Components & Equipment. Six Industrials stocks currently screen into Goldman’s Hedge Fund VIP list: BLDR, INFO, KSU, TDG, UBER, WSC.
Finally, at the subsector level, hedge funds increased tilts to both secular growth and cyclical equities in 3Q. Funds added to tilts in Trucking, Autos, and Software while cutting exposure to Diversified Banks, Internet Retail, and Biotech.
The current fund tilts in Energy and Communication Services rank as nearly the smallest positions in the past decade. While the Energy tilt is very small relative to history, during 3Q funds moved from underweight to overweight the sector relative to the Russell 3000.
While professional subscribers have access to the full report in the usual spot, in a subsequent post we will drill down into the 30 most popular as well as 30 most hated/shorted names for those who wish to put on the most successful trade of the past decade – going long the most hated names and shorting the most popular basket.
Tyler Durden
Mon, 11/22/2021 – 07:24
via ZeroHedge News https://ift.tt/3oODgVc Tyler Durden
