Investors Face “Lost Decades”, Wall Street Fears Dramatic Equity Downside Amid “Doozy Of Epic Short Gamma” Into Op-Ex
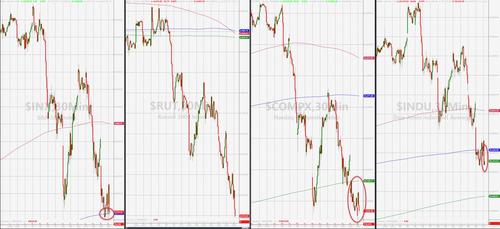
US equity markets just cannot catch a bid and are puking below critical support levels this morning:
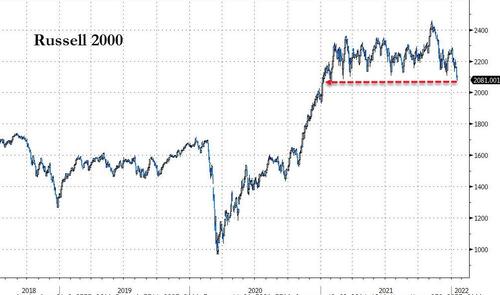
The Russell 2000 is now down 4% on YoY basis (its first YoY drop since July 2020)…
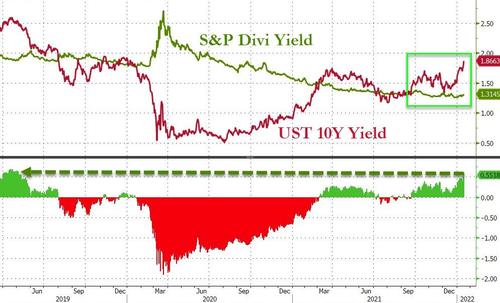
And these shifts are starting to shake the unwavering bullish foundation that so many have stuck to in recent years as TINA is dead (bonds are now trading at their ‘cheapest’ to stocks in three years)…
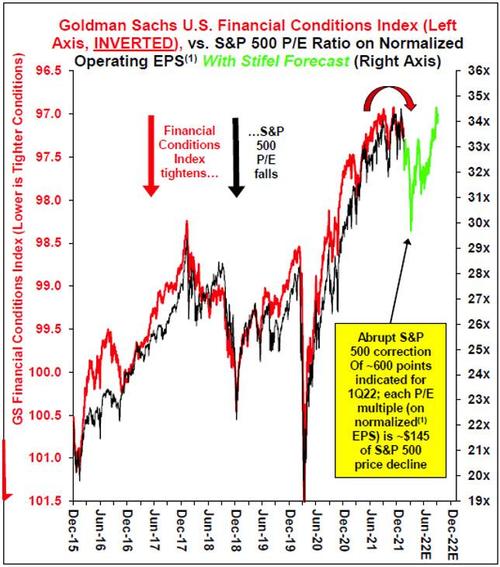
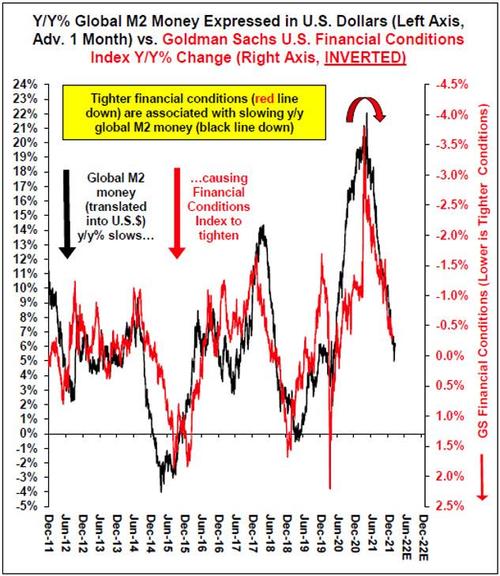
Stifel’s Chief Equity Strategist Barry Bannister wrote in a note Tuesday that the S&P 500 could fall ~600 points to ~4,200 near term in a P/E multiple correction…
The S&P 500 may slide to about 4,200 points this quarter as price-to-earnings multiples correct, U.S. financial conditions are likely to tighten…
…as global M2 money supply growth slows amid a stronger dollar and less stimulus.
Bannister recommends investors overweight defensive groups and underweight some cyclicals since a cyclical-defensive equal-weight index hit a 22-year trend ceiling.
But has an even more ominous outlook for what may lie ahead:
“Post-correction, equities risk the third bubble in 100 years if the Fed loses its nerve and cancels much of the tightening plan. We doubt that occurs anytime soon, because we believe bubbles are exceptionally poor policy, and the prior two equity bubble tops (1929 and 2000) were followed by ‘lost decades’.”
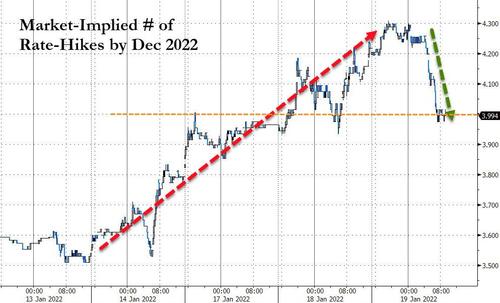
And some are wondering if the drop in Dec 2022 rate-hike expectations (now back below 4 hikes) is a sign that the stock market ‘flex’ lower is indeed expected to spook Powell off his hawkish pedestal?
At the same time, Ned Davis Research strategists trimmed the weighting of domestic stocks in their recommended portfolio and cut the country’s equities to neutral.
Of course, Ed Clissold, the firm’s chief U.S. strategist, was careful not to panic the firm’s mostly-long-only clients:
“Broadly speaking, the catalysts are changes in our models and evidence that the maturing Fed and earnings cycles” are unfolding, Ned Davis Research strategists including Clissold said in a note to clients.
“A neutral U.S. equity outlook incorporates expectations for positive, albeit lower, returns. The reduction in risk appetite is not an outright bearish call.”
But, Clissold admits that several factors are behind the shift, which when put together trigger a warning that the run in U.S. stocks is set to falter. A slowdown in the pace of earnings growth is one of the reasons behind the cut. A faster-than-expected withdrawal of accommodative stimulus is another. The prospect of higher volatility doesn’t help, either.
Bannister and Clissold are not alone as many others on Wall Street have begun to grow nervous about everything from the impact of the omicron variant to a spike in yields to the Fed’s policy shift.
As Larry McDonald recently noted in The Bear Traps Report, the Nasdaq is facing major downside risk as he warns “contagion is moving upstream.”
The probability of a Nasdaq – large cap – equity crash, say a 20-30% drawdown is very high. We know most of the Nasdaq has already crashed, we recently noted – 1300 stocks are off 50% or more. The Fed is digging in – tech stocks will be for sale until the Fed softens its stance; 3-4 rate hikes and QT (balance sheet run-off) in 2022 gets you a 10k Nasdaq vs. 15.5k now. We are coming into the Fed’s quiet period this weekend. On top of that. a long weekend and the taper is accelerating this week as well. Stocks are saying too much, Mr. Powell.
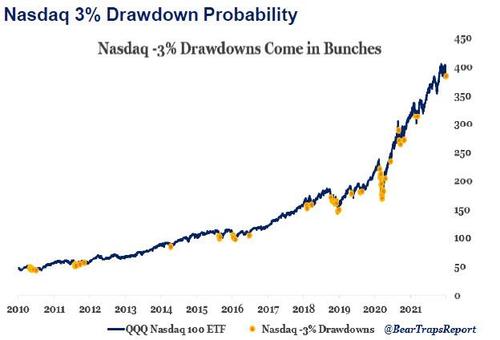
Large tremors rarely happen in Isolation. Over the past decade, the Nasdaq has had 55 separate -3% drawdowns in one trading day. 55 occurrences in the past 3,022 trading days is a probability of roughly 1.8%. However, 23 of these 54 occurrences happened within 10 trading days of each other (41.8%>). While 36 occurrences happened within 30 trading days of each other (65.4%). This means although -3% daily drawdowns in the Nasdaq are a rare event, there is roughly a 67%o chance we see one in the next ~30 days. Ten days have passed since the last – 3% drawdown and although we didn’t get another this week, just a pullback -2.5% on Thursday.
These more strategic perspectives may all be signalling downside ahead, but how to trade it?
Nomura’s Charlie McElligott’s more tactical focus provides us with just that recipe for action in US equities.
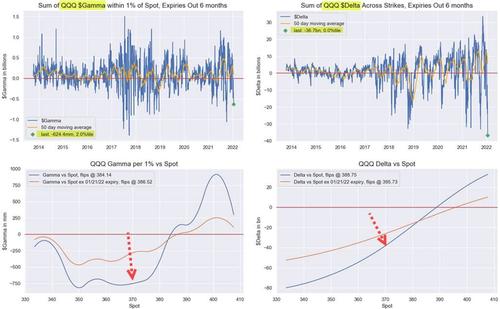
“It’s a doozy of epic “short Gamma, short Delta” into Op-Ex, with the Delta pressure from all that Dealer “short downside” an obviously massive part of yday’s moves:
-
SPX / SPY consolidated net $Delta just a massive move, as it went from -$10.6B on Friday to -$272.9B (5.1%ile since 2013) by the end of yesterday; $Gamma is -$11.0B (3.9%ile, with 36.4% rolling-off Friday), and we are currently around ~-$12B per 1% move; Gamma neutral line at 4664.25, Delta neutral line at 4662.41
-
QQQ is just a hot mess, net $Delta went from prior -$17.1B on Friday to -$36.7B (0.0%ile, “shortest” in our history) by EOD; $Gamma is -$624.4mm (2.0%ile, with 55.5% of it rolling-off Friday), and currently near “max short Gamma” ~-$750mm per 1% move; Gamma neutral line at 384.14, Delta neutral line at 388.75
-
IWM also super grim, net $Delta went from -$13.4B Friday to -$19.9B (0.1%ile) by EOD; $Gamma less extreme but still negative / short at -$239.2mm (13.9%ile, and 53.2% of it rolling-off Friday), as we currently are also near “max short Gamma” point ~-$650mm per 1% move; Gamma neutral line at 220.05, Delta neutral line at 223.40
As McElligott joked “I’D LIKE TO REPORT A MURDER” in delta and gamma…
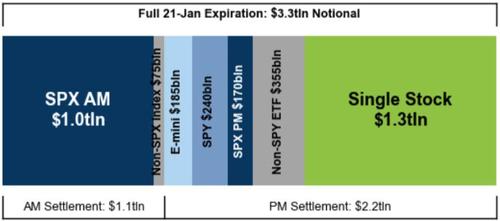
As Goldman warned this week, facing a massive $3.3tln of options notional, including $1.3tln of single stock options, expiring on Friday…
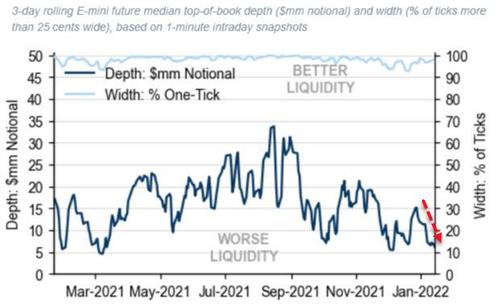
…market liquidity has worsened significantly to start the year…
Specifically, the levels to watch for more pain ahead are as follows:
-
Russell 2000, currently -37.4% short, [2092.1], more selling under 2092.29 (+0.01%) to get to -69%, max short under 2092.1 (+0.00%), buying over 2248.85 (+7.49%) to get to 31%, more buying over 2249.06 (+7.50%) to get to 100%, flip to long over 2248.85 (+7.49%), max long over 2249.06 (+7.50%)
-
NASDAQ 100, currently -37.4% short, [15206.0], more selling under 12868.62 (-15.37%) to get to -69% , max short under 12867.1 (- 15.38%), buying over 15319.19 (+0.74%) to get to 31% , more buying over 15320.71 (+0.75%) to get to 100%, flip to long over 15319.19 (+0.74%), max long over 15320.71 (+0.75%)
-
S&P 500, currently 100.0% long, [4571.25], selling under 4490.36 (-1.77%) to get to -37%, more selling under 3699.05 (-19.08%) to get to – 100%, flip to short under 4490.36 (-1.77%), max short under 3699.05 (-19.08%)
-
Nikkei 225, currently -37.4% short, [28250.0], more selling under 27537.96 (-2.52%) to get to -69% , max short under 27535.13 (-2.53%), buying over 29065.01 (+2.88%) to get to 31%, more buying over 29067.83 (+2.89%) to get to 100%, flip to long over 29065.01 (+2.88%), max long over 29067.83 (+2.89%)
-
Euro Stoxx 50, currently 100.0% long, [4252.5], selling under 4121.92 (-3.07%) to get to -37%, more selling under 3374.92 (-20.64%) to get to -100% , flip to short under 4121.92 (-3.07%), max short under 3374.92 (-20.64%)
-
HangSeng CH, currently -100.0% short, [8423.0], buying over 9072.86 (+7.72%) to get to -31% , more buying over 10911.91 (+29.55%) to get to 69% , flip to long over 9073.7 (+7.73%), max long over 10911.91 (+29.55%)
So, as the majors break below key technical levels, McElligott calls out S&P 4490 as crucial support.
Tyler Durden
Wed, 01/19/2022 – 12:22
via ZeroHedge News https://ift.tt/3FGsuXp Tyler Durden
