Consumer Survey Shows Rising Bullishness
Authored by Lance Roberts via RealInvestmentAdvice.com,
The latest consumer survey data from the New York Federal Reserve had interesting data.
“The New York Fed’s latest consumer survey found that expectations that stocks will be higher in the next 12 months rose from 39% to 41% since last month’s reading. At the same time, inflation expectations dropped slightly. Consumer sentiment numbers have recently highlighted how certain demographics are thriving while others aren’t, but with the market near all-time highs, it’s no surprise that those who own stocks are feeling good.” – Yahoo Finance
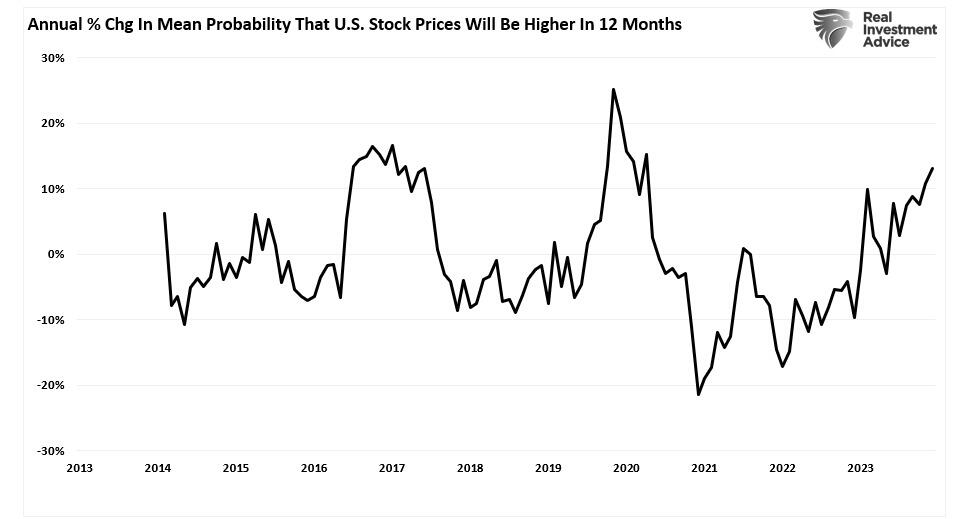
The chart below shows the annual change in consumer surveys of higher stock prices. Unsurprisingly, investors have become increasingly exuberant about stock prices in conjunction with the market rally that began in 2022.
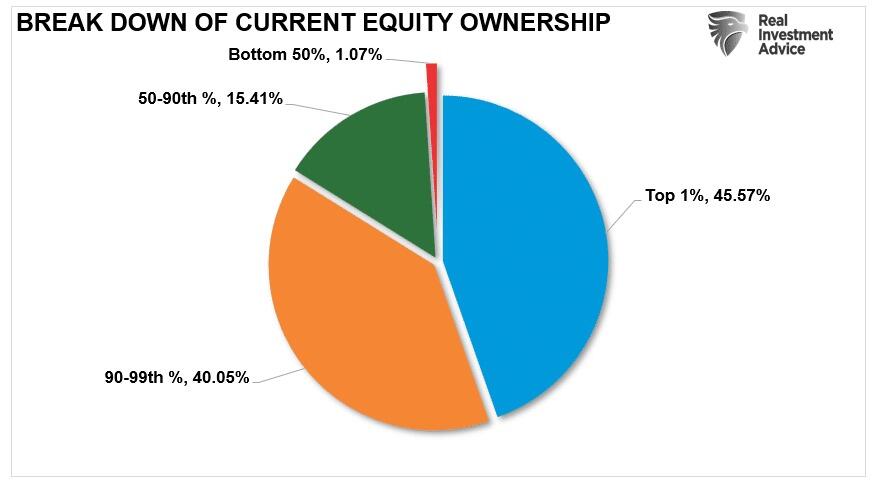
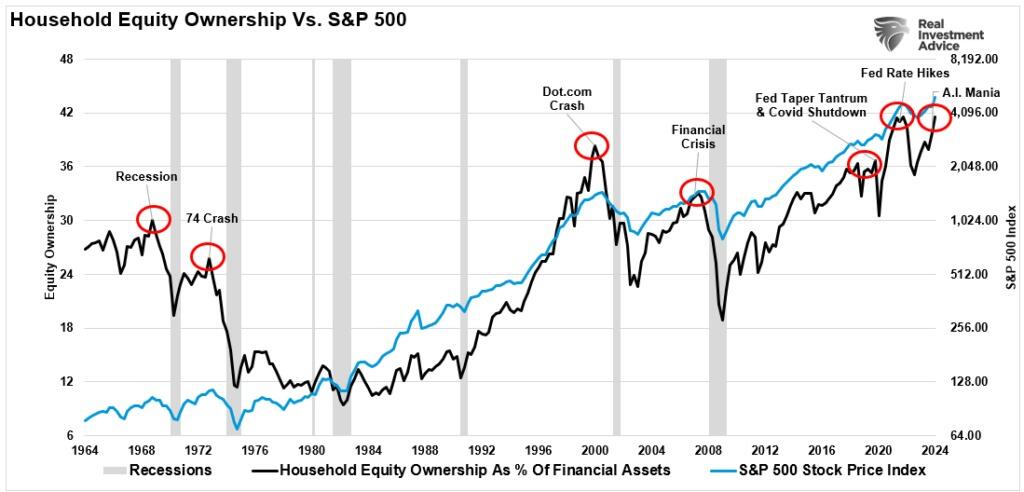
However, Yahoo suggests that the rising bullish sentiment in the consumer survey reflects the “haves and have-nots.” That statement is understandable when considering the breakdown of household equity ownership and the finding that the top 10% of households hold 85% of the equities.
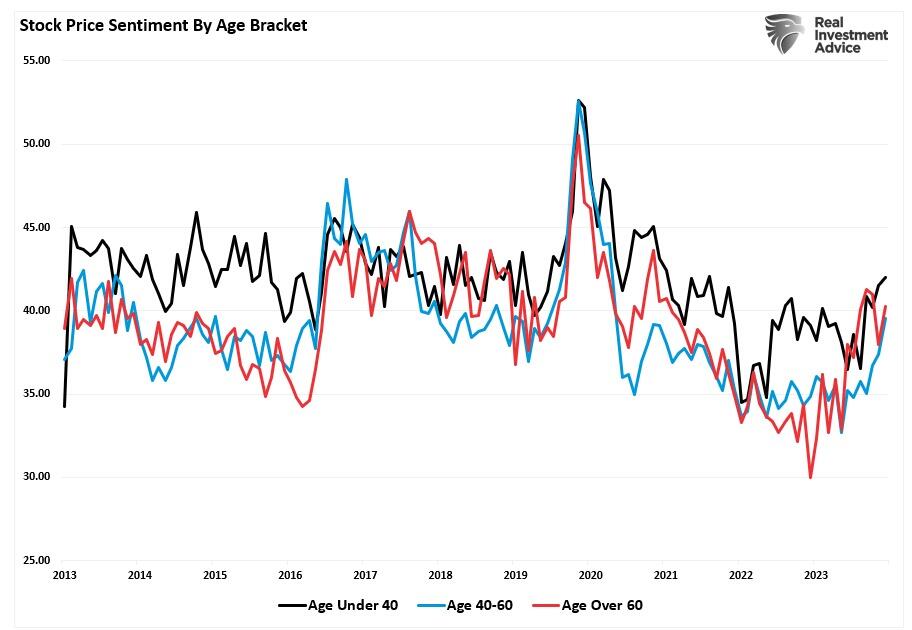
However, consumer survey data shows rising stock market prices lifted confidence across age and income brackets. That should be unsurprising given the daily drumbeat of social and mainstream media highlights of the current bullish market.
Furthermore, when looking at the consumer survey data by income bracket, we see that the lowest and middle-income brackets have seen the most prominent advances in confidence.
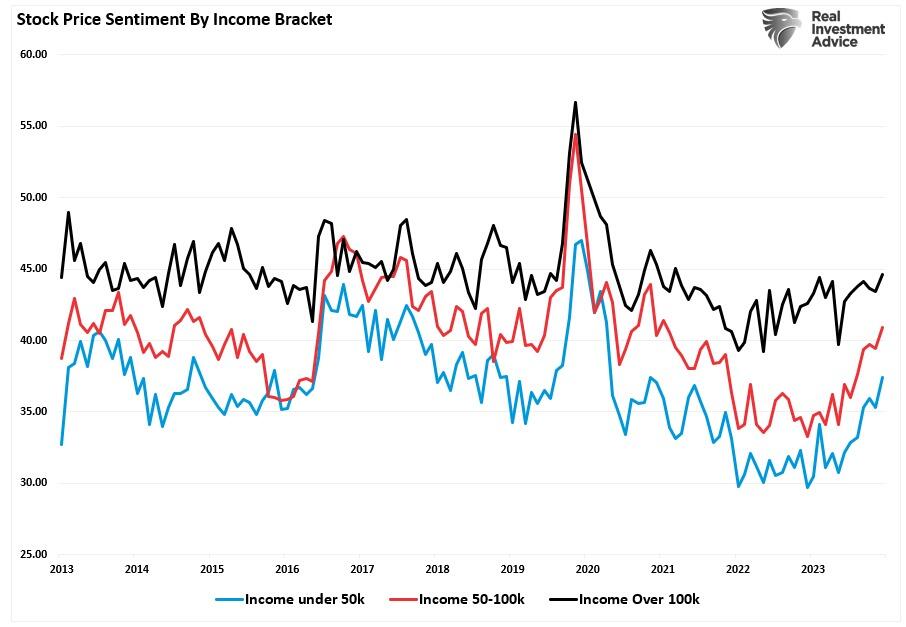
Given the popularization of the financial markets through trading apps like Robinhood combined with a rising tide of social media commentary, it is unsurprising that lower income brackets have joined the fray hoping to “get rich quick.”
However, a warning is buried in the rising tide of bullish sentiment.
Market Warning In Bullishness
To understand the problem, we must first realize from which capital gains are derived.
“Capital gains from markets are primarily a function of market capitalization, nominal economic growth, plus dividend yield. Using John Hussman’s formula, we can mathematically calculate returns over the next 10-year period as follows:
(1+nominal GDP growth)*(normal market cap to GDP ratio / actual market cap to GDP ratio)^(1/10)-1
Therefore, IF we assume that GDP could maintain 2% annualized growth in the future, with no recessions ever, AND IF current market cap/GDP stays flat at 2.0, AND IF the dividend yield remains at roughly 2%, we get forward returns of:
(1.02)*(1.2/1.5)^(1/10)-1+.02 = -(1.08%)
But there are a “whole lotta ifs” in that assumption. Most importantly, we must also assume the Fed can get inflation to its 2% target, reduce current interest rates, and, as stated, avoid a recession over the next decade.”
Yet, despite these essential fundamental factors, retail investors are again throwing caution to the wind. As shown, household equity ownership has reverted to near-record levels. Historically, such exuberance has been the mark of more important market cycle peaks.
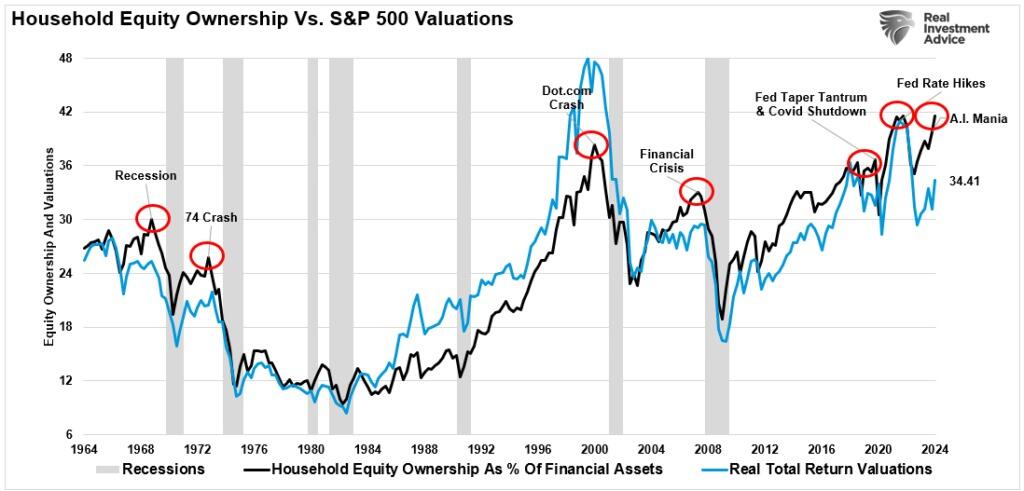
If economic growth reverses, the valuation reduction will be quite detrimental. Again, this has been the case at previous peaks when expectations exceeded economic realities.
Bob Farrell once quipped investors tend to buy the most at the top and the least at the bottom. Such is simply the embodiment of investor behavior over time. Our colleague, Jim Colquitt, previously made an important observation.
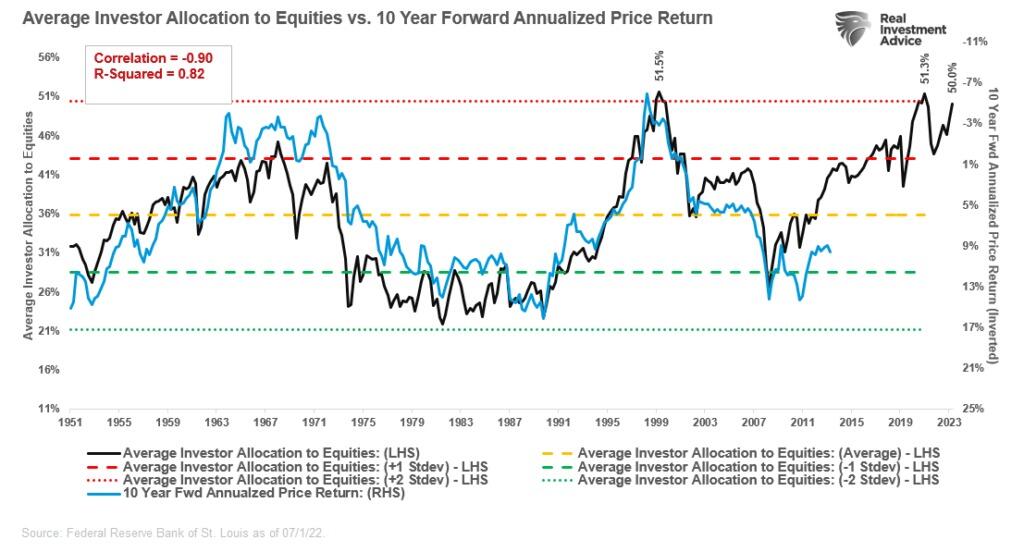
“The graph below compares the average investor allocation to equities to S&P 500 future 10-year returns. As we see, the data is very well correlated, lending credence to Bob Farrell’s Rule #5. Note the correlation statistics at the top left of the graph.”
The 10-year forward returns are inverted on the right scale. Such suggests that future returns will revert toward zero over the next decade from current levels of household equity allocations by investors.
The reason is that when investor sentiment is extremely bullish or bearish, such is the point where reversals have occurred. As Sam Stovall, the investment strategist for Standard & Poor’s, once stated:
“If everybody’s optimistic, who is left to buy? If everybody’s pessimistic, who’s left to sell?”
The only question is what eventually reverses that psychology.
Exuberance Fails With Reality
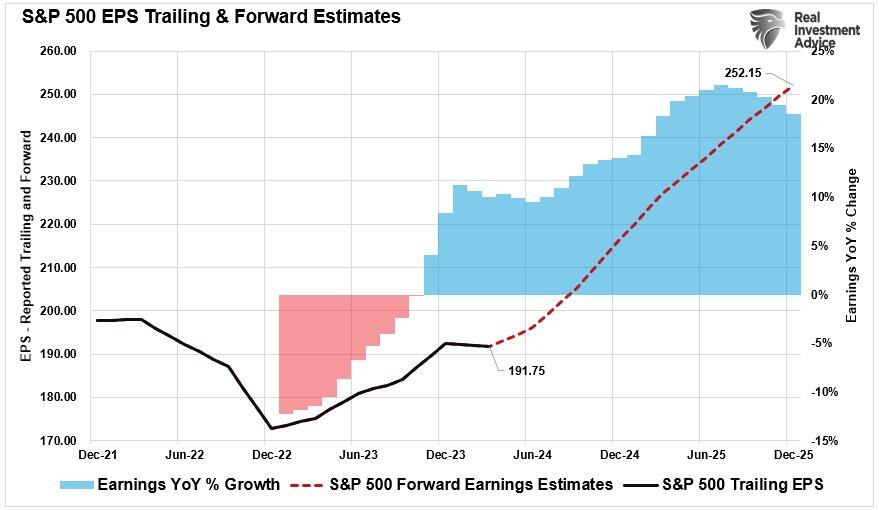
Unsurprisingly, equity markets are rising currently. Such is particularly the case as expectations for earnings growth have surged, with analysts expecting near 20% annualized growth rates over the next 18 months.
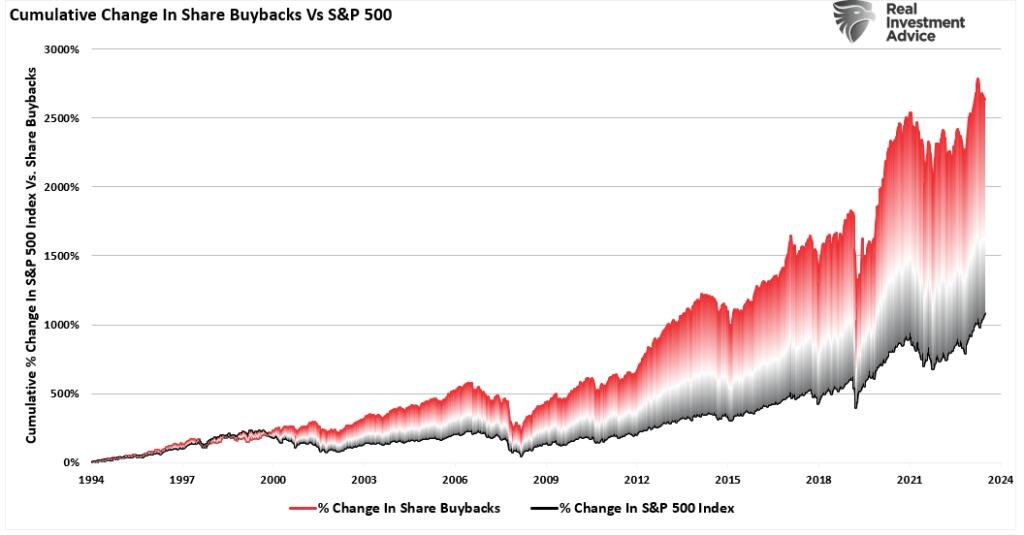
At the same time, corporations have engaged in massive share buyback programs, which have elevated prices and reported earnings per share by lowering the number of shares outstanding.
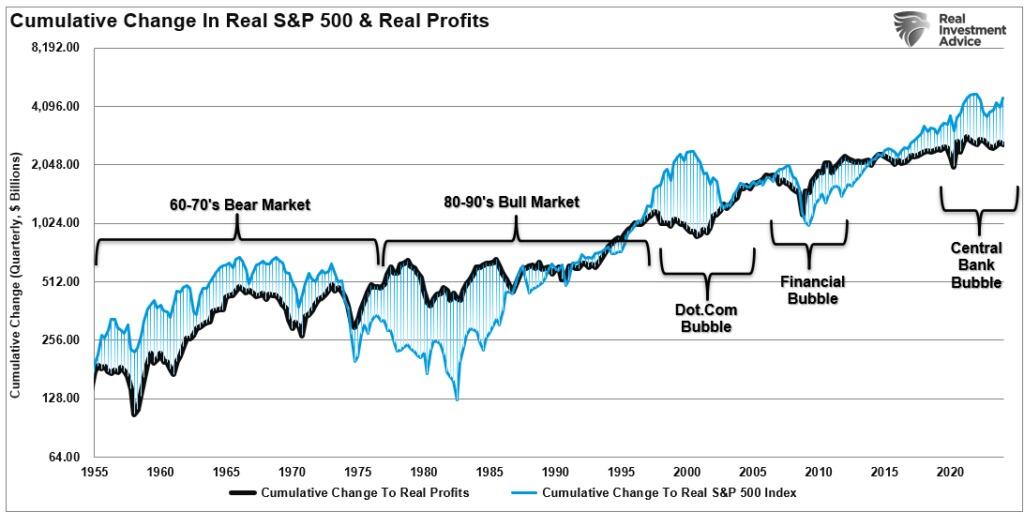
However, as economic growth slows, profit margins will begin to revert, and disinflation eats into earnings. Profit margins are tied to economic activity.
“Profit margins are probably the most mean-reverting series in finance. And if profit margins do not mean-revert, then something has gone badly wrong with capitalism. If high profits do not attract competition, there is something wrong with the system, and it is not functioning properly.” – Jeremy Grantham
Historically, when the market trades well above actual profits, there has always been a mean-reverting event to realign expectations with economic realities.
Many things can go wrong in the months and quarters ahead. This is particularly true when economic growth and unemployment are slowing.
While the consumer survey is very bullish on the outlook for continuing asset price increases, that sentiment is based on the “hope” that the Fed has everything under control. History suggests there is more than a reasonable chance they don’t.
Tyler Durden
Tue, 06/18/2024 – 08:21
via ZeroHedge News https://ift.tt/OnecQum Tyler Durden