June Payrolls Preview: Another Big Drop
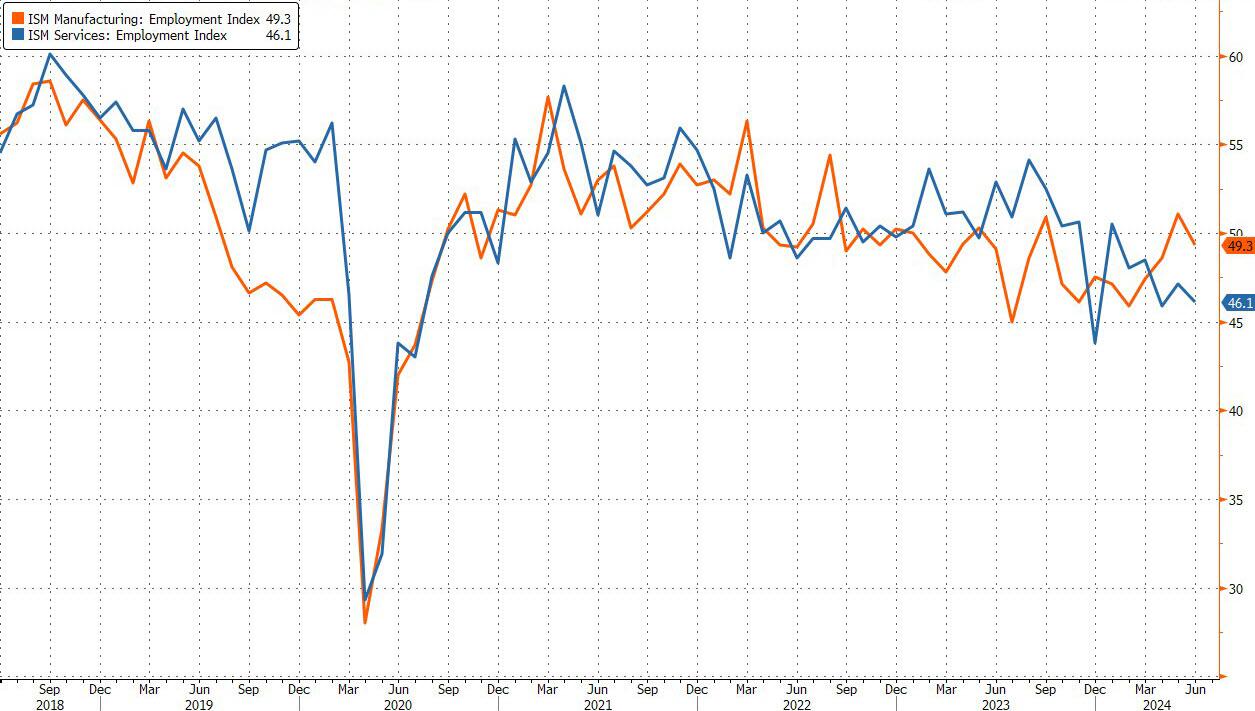
US payrolls is expected to once again in June to 190k from 272k in May and after a cycle low 165K in April. Most economic indicators in the past month indicated labor market deterioration: jobless claims that corresponded with the BLS’ survey window for the jobs report worsened. ADP’s gauge of payrolls came in blow consensus, as wage metrics fell and analysts noted that forward looking gauges of pay compensation suggest wage growth will slow even more ahead. Challenger job cuts jumped in June YoY relative to a decline in May. Business surveys were also downbeat, with the ISM manufacturing report seeing its employment sub-index fall back into contractionary territory, while the ISM services employment component dipped further into contractionary territory.
The June jobs report will help shape expectations for near-term Fed rate cuts; currently, markets see a decent chance of two rate cuts this year (in contrast to the Fed’s median forecast for just one reduction in 2024), with the first fully discounted cut seen at the November meeting, and around a 80% chance that the cut could be seen in September – the June report may help to define that pricing. A huge miss tomorrow and the odds of a July rate cut or a double rate cut in September will spike.
EXPECTATIONS:
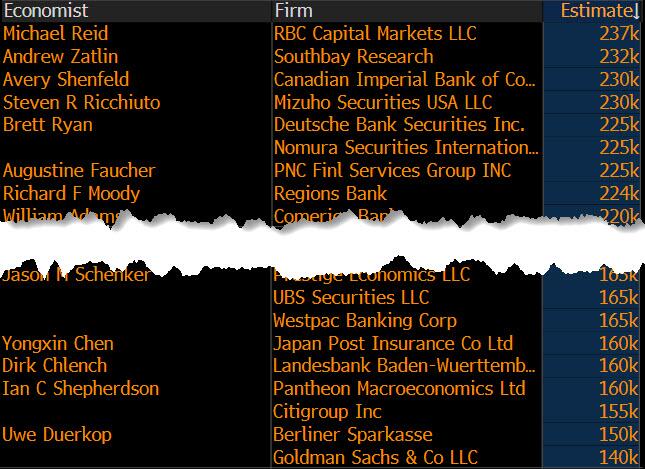
- The rate of headline payrolls growth is expected to cool to +190k in June, down from +272k in May, and down from a 3 month average 249k, 6 month average 255k, and 12 month average 230k. Wall Street estimates range from a high of 237K at RBC Capital Markets, all the way down to 140K at Goldman Sachs, which for once has lost its Panglossian optimism and expects a downright ugly number.
- To justify its bearish outlier estimate, Goldman expects payrolls to rise only 140k in June, as “Big Data measures continue to indicate a below-normal pace of job creation during the spring hiring season, and our layoff tracker continues to edge higher from low levels. We also assume a 50k drag from payback effects, because we believe the longer-than-usual survey window in last month’s report pulled forward reported job growth from June into May. While the seasonal factors in principle adjust for these effects, it appears they may have been distorted by the weak payrolls reading in May 2019, which was also 5 weeks long.”
- The unemployment rate is expected to be unchanged at 4.0% (NOTE: the Fed’s June SEP has pencilled in a rate of 4.0% for this year, rising to 4.2% next year).
- The rate of average hourly earnings growth is seen paring to +0.3% M/M (vs +0.4% in May), while the annual rate is likely to ease to 3.9% Y/Y from 4.1%.
MAY’S DATA:
The May jobs data surprised to the upside, with the headline and wage metrics rising above expectations (as we reported, it was the “most ridiculous jobs report in years“). Other analysts also noted that this strong number seemed at odds with other labor market indicators, like initial jobless claims and Challenger layoffs data. Some of the upside has been chalked up to stronger government payrolls, but Capital Economics said that “with balanced budget requirements forcing state and local governments to rein in spending and hiring to eliminate growing deficits, there is scope for a smaller gain, or even outright decline, in government payrolls in June,” and “given the widespread announcements of education sector layoffs, we are worried that will become a drag.” It adds, however, that most of the impact of this will likely be seen in the July data. May’s JOLTs data (a key barometer monitored by Fed officials, and was released after the May BLS jobs data), saw headline job openings rise to 8.14mln (exp. 7.91mln) from a revised down 7.92mln April reading – driven entirely by an increase in government job openings…
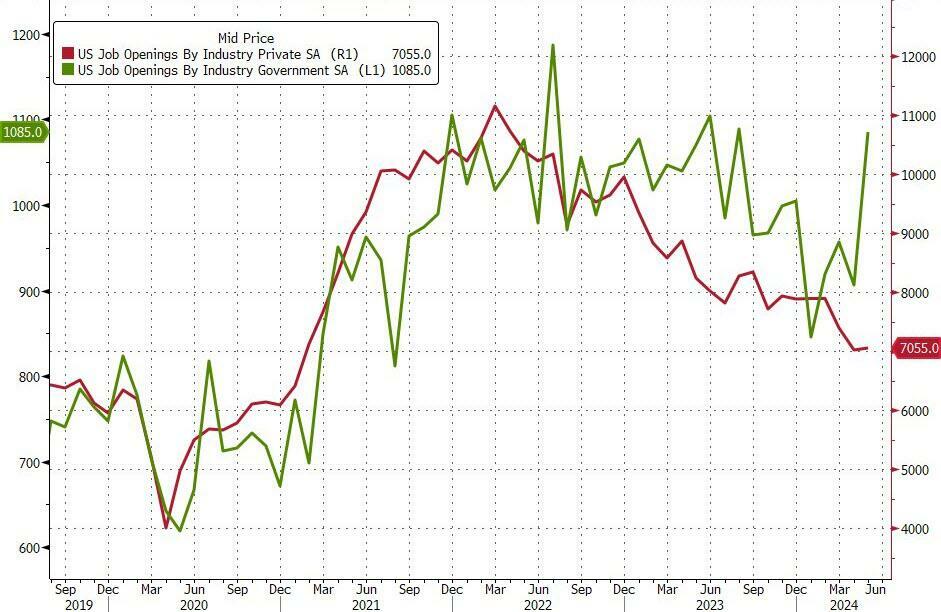
… with the vacancy rate ticking up to 4.9% from 4.8%; some Fed officials see the vacancy rate as one of the best representations of excess labor demand; Fed Governor Waller has said that if the vacancy rate continued to fall below 4.5%, it would likely suggest that excess labour demand has been worked off, and the unemployment rate could start to rise. The May JOLTs data also saw the Quits Rate unchanged at 2.2% for the 7th consecutive month; Oxford Economics notes that it stands a little below pre-pandemic levels, and is consistent with ongoing moderation in wage growth, but it is not sending any signals about significant weakness in the labor market. Note, at the June 12th FOMC, Fed Chair Powell was quizzed about the different pictures the household and establishment surveys are showing within the BLS report. Powell acknowledged that sometimes you can’t reconcile the differences, but that is why it makes sense to look at the 3, 6 and 12-months series, rather than just one report. But nonetheless, the overall picture is one of a strong and gradually cooling-gradually rebalancing labor market.
JOBLESS CLAIMS:
In the week that corresponds to the BLS survey window for the June jobs report, weekly initial jobless claims data were at 239k vs 216k heading into the May jobs report, while continuing claims were up at 1.839mln vs 1.79mln going into the prior jobs report. Oxford Economics said that “initial claims suggest that the gain in non-farm employment in May won’t be duplicated in June, and the risks to the labour market should be garnering attention by the Fed.” It points out that the softening in the job growth has been primarily driven by a deceleration in hiring via reduced labour demand, with the job openings rate having declined noticeably, but that still has not translated into a significant rise in the unemployment rate. On continuing claims, it notes that in the week that coincides with the BLS jobs report survey window, it rose to the highest since late 2021; “the rise in continued claims on the surface points to a moderation in job growth,” but adds that “increases in claims in California and Minnesota – which accounted for more than half the total rise in continued claims – are likely due more to noise than any underlying softening in the labour market.”
ADP EMPLOYMENT & WAGES:
While analysts offer their usual caveats about how the data series offers low predictive power for the more widely followed BLS jobs report, ADP’s gauge of national employment printed 150k in June (exp. 160k, prior 157k). The median change in annual pay for job-stayers fell to the slowest since August 2021 at 4.9% Y/Y (prev. 5.0%), and it eased to 7.7% Y/Y (prev. 7.8%) for job-changers. The payrolls provider said that while job growth has been solid, it was not broad based, adding that had it not been for a rebound in hiring in leisure and hospitality, June would have been a downbeat month. Despite Average Hourly Earnings moving higher in May, Capital Economics notes that forward-looking indicators, like job quit rates, still point to wage growth declining to nearer 3.5% Y/Y. CapEco is below consensus, expecting average hourly earnings to rise +0.2% M/M (consensus looks for +0.3%), owing to favourable base effects; that may be enough to bring the annual rate of AHE down to 3.8% Y/Y (consensus: 3.9%).
BUSINESS SURVEYS:
Within ISM’s manufacturing PMI for June, the employment index fell to 49.3 from 51.1 in May, beneath the 50.0 mark that separates expansion and contraction. The report said that many respondents’ are continuing to reduce headcounts through layoffs, attrition and hiring freezes, though commentary in June indicated a marginal decline in staff reductions vs May, supported by the approximately 1.3-to-1 ratio of hiring versus head-count reduction comments. The ISM Services PMI saw the employment component dip further into contractionary territory at 46.1 from 47.1 in May. Elsewhere, Challenger reported US job cuts were -19.8% Y/Y at 48,786 in June (vs 63,816 in May). So far this year, 434,645 job cuts have been announced (-5.1% vs the 458,209 in H1 of 2023). Most job cuts were seen in consumer products manufacturers, followed by technology, and then construction. Challenger said “June is typically a low month for job cut announcements, as most companies are midyear or at the end of their fiscal years,” and that “the months following fiscal year ends tend to have a spike in cuts, as those plans are implemented.”
CONSUMER CONFIDENCE:
The Conference Board’s data showed consumers’ assessment of current business and labor market conditions increased to 141.5 (prev. 140.8), while the expectations on consumers’ short-term outlook for income, business, and the labor market fell to 73.0 (prev. 74.9); the CB notes that the Expectations Index has been below 80, a threshold which usually signals a recession ahead, for five consecutive months. That said, the appraisal of the labor market improved in June, with 38.1 saying that jobs were “plentiful” (prev. 37.0 in May), while 14.1 said jobs were “hard to get” (prev. 14.3%). The short-term outlook was also less negative in the month, with 12.6 expecting more jobs to be available (down from 13.1 in May), while 17.3% anticipated fewer jobs ahead (vs prev. 18.8). The CB’s economists said “confidence pulled back in June, but remained within the same narrow range that’s held throughout the past two years, as strength in current labour market views continued to outweigh concerns about the future,” but warned that if material weaknesses in the labour market were to appear, confidence could weaken ahead. The report also said that consumers’ feelings were mixed; their view of the present situation improved slightly overall, driven by an uptick in sentiment about the current labour market, but their assessment of current business conditions cooled. And for a second consecutive month, consumers were slightly less pessimistic about future labour market conditions despite expectations for both future income and business conditions weakening.
ARGUING FOR A WEAKER-THAN-EXPECTED REPORT
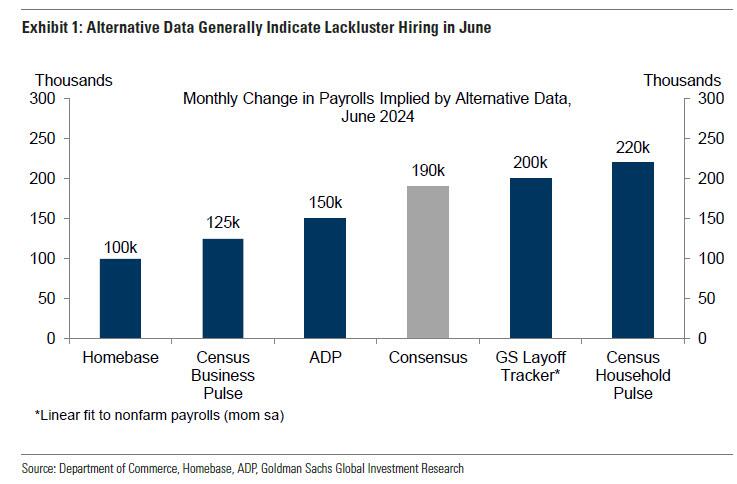
- Big Data. Alternative measures of employment growth generally indicate a softer pace of hiring in June, with a median pace of +150k across the five indicators Goldman tracks (vs. +150k in May and compared to reported May job growth of +272k). An even slower pace of job gains is implied by the Homebase employer panel (+100k). Withheld income and employment taxes also decelerated further (-1% yoy in June compared to +2% in May and +6% on average in January-April, nominal basis).
- Payback from the long May payroll month. Goldman assumes a 50k drag from a pull-forward of reported jobs into May related to a longer BLS survey window—5 weeks from the April survey week to the May survey week, compared to 4 weeks in a typical May. Additionally, the seasonal factor for last month’s report was unusually favorable, providing a 12k boost to monthly payroll gains relative to May 2019 and a 64k boost relative to May 2014, the last two Mays that also had five weeks. While the seasonal factors in principle adjust for the 5-week effect, it appears they may have been distorted by a weak payrolls reading in May 2019, which was also 5 weeks long.
ARGUING FOR A STRONGER-THAN-EXPECTED REPORT
- Job availability. JOLTS job openings rebounded 0.2mn to 8.1mn in May, but online measures have trended lower. While labor demand has fallen meaningfully over the last year, it remains elevated by 1mn relative to 2019 and represents a positive factor for job growth. The Conference Board labor differential—the difference between the percent of respondents saying jobs are plentiful and those saying jobs are hard to get—edged up by 1.3pt to +24.0 in June but remains below the +30.4 average level of Q1.
NEUTRAL/MIXED FACTORS
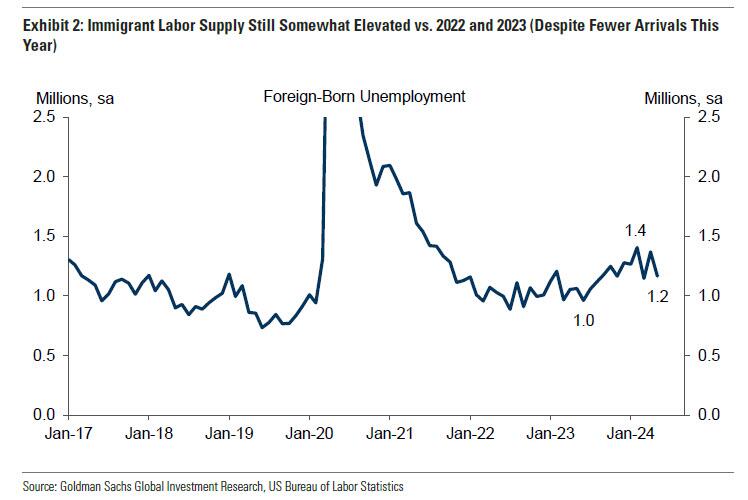
- Immigration. Elevated illegal immigration boosted labor supply growth by roughly 80k per month last year, relative to normal, and Goldman expects a continued tailwind averaging 50k per month this year. While the pace of immigration has slowed sharply in 2024 and foreign-born unemployment pulled back in May, the absolute number of jobseekers in that labor supply segment still remained roughly 200k above 2022-23 levels to start the June payroll month.
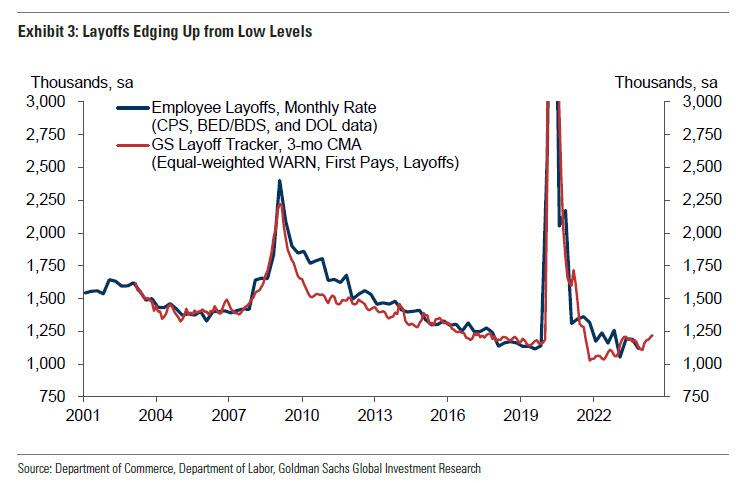
- Layoffs. Layoff activity increased from low levels in June, with the GS layoff tracker edging up to to 1.24mn from 1.20mn in May and compared to the recent low of 1.1mn in December and January. Initial jobless claims also increased, to an average of 233k in the June payroll month from 218k in May and above the 223k average of 2023 (though some of the increase reflects expanded eligibility). The JOLTS layoff rate was unchanged at 1.0% in May. Announced layoffs reported by Challenger, Gray & Christmas decreased by 6k in June to 50k (SA by GS), compared to 54k on average in the second half of 2023.
- Employer surveys. The employment components of business surveys increased but remained at contractionary levels in June. The employment component of the GS manufacturing survey tracker increased 0.2pt to 48.4 while the employment component of the GS services survey tracker decreased 1.8pt to 49.8. However, the signal from soft data has been less useful—and at times misleading—during the post-pandemic period.
POLICY IMPLICATIONS:
Fed officials generally agree that inflation would need to continue cooling, and the labor market would need to continue its gradual rebalancing for rate cut conditions to be met. That said, as Newsquawk notes, their policy reaction could be tilted back towards ‘higher for longer’ if inflation were to misbehave again; although the plan to cut rates could be accelerated if there were unexpected weakness in the labor market. Speaking this week, Fed Chair Powell said that while the labor market was cooling-off, it was still strong. This has also been a theme among other policymakers too. Officials have generally been arguing that they are trying to tame inflation without causing any stress in the labor market; Powell did repeat however that any unexpected weakness in the jobs market could trigger the Fed to react with looser policy. Previously, however, he has indicated that a small movement in the unemployment rate, of a couple of tenths, would not constitute this unexpected weakness.
For reference, and perhaps providing some context to Powell’s caveats, the Fed’s latest economic projections see the jobless rate at 4.0% at the end of this year, where it currently stands (the Fed’s broad range of forecasts for 2024 is between 3.8-4.5%); it is then seen picking up to 4.1% next year (broad range: 3.7-4.3%), and at 4.1% in the long-run (long-run range of forecasts is between 3.8–4.3%). Fed Governor Cook recently said that it would take monthly job gains of around 200k to keep the unemployment rate steady. In aggregate, the deceleration in inflation, combined with the decent labor market conditions gives the Fed scope to be patient before acting on rates, analysts at Oxford Economics argue; that way they can ensure inflation is on its way to target in a sustainable manner.
More in the full preview folder available to pro subscribers.
Tyler Durden
Thu, 07/04/2024 – 22:26
via ZeroHedge News https://ift.tt/C0TJSPM Tyler Durden