Fed’s Favorite Inflation Indicator Unexpectedly Misses As Savings Rate Plunges To Near Record Low
The broadly weak trend of US macro data was jolted yesterday by the hotter than expected GDP print (hilariously driven by a surge in personal consumption at the same time as Dollar General announced the time of death of the US consumer), which prompted a hawkish shift in rate-cut expectations. However, this morning, the doves get another chance for some ‘bad news’ (disinflation) to support their ‘we must cut in September” narrative, unveiled by Powell himself last week during Jackson Hole, when the Fed’s favorite inflation indicator – Core PCE – came in line with expectations, and even missed estimates on a core YoY basis. Starting with headline:
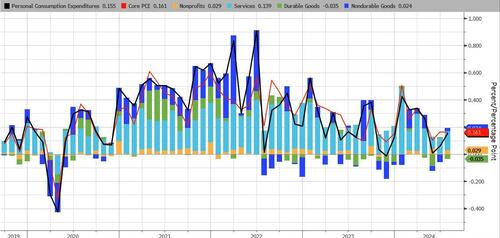
- PCE 0.2% MoM (unrounded 0.155%), in line with estimates of 0.2% and up from the 0.1% (0.0788%) last month
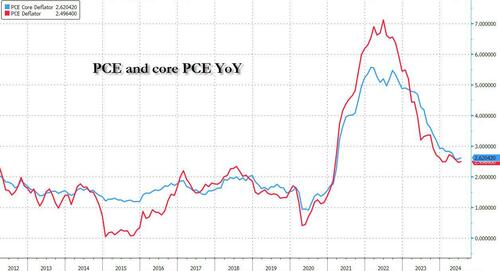
- PCE 2.5% YoY, in line with estimates of 2.5%, and unchnaged from last month’s 2.5% YoY increase.
And here is core:
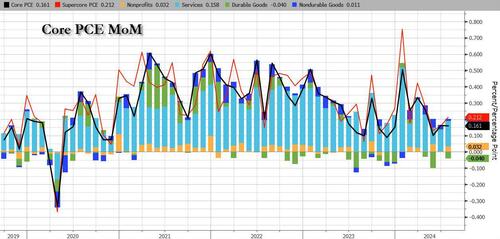
- Core PCE 0.2% MoM (unrounded 0.1611%), in line with estimates of 0.2%, and unchanged from last month’s 0.2% (0.1818%) MoM increase
- Core PCE 2.6% YoY, missing estimates of a 2.7% increase and unchanged from last month.
Here is the MoM headline change…
…and the annual:
Under the hood, durable goods deflation continues to drag Core PCE lower while Services costs continue to rise…
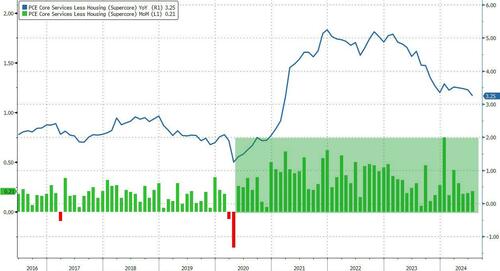
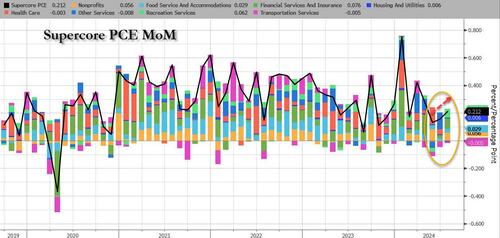
Even more notably, the so-called SuperCore PCE rose 0.2% MoM, the highest in 3 months, and which pushed YoY supecore to 3.25%, which remains awkwardly stagnant at elevated levels…
This was the 51st straight monthly rise in SuperCore prices with virtually all costs except transportation rising:
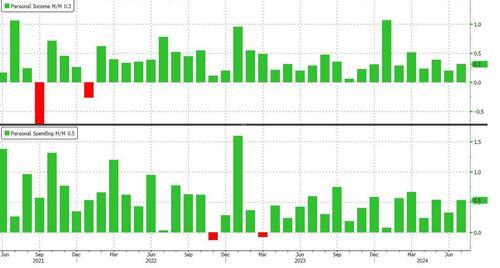
Turning to the household income statemet, on A MoM basis, income growth was stronger than expected (+0.3% vs +0.2% exp), while spending came in line as expected at +0.5% as expected.
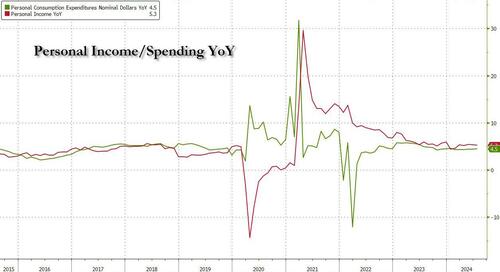
The problem, however, is that spending growth continues to tick far above income growth, and on a YoY basis, spending continues to outpace incomes.
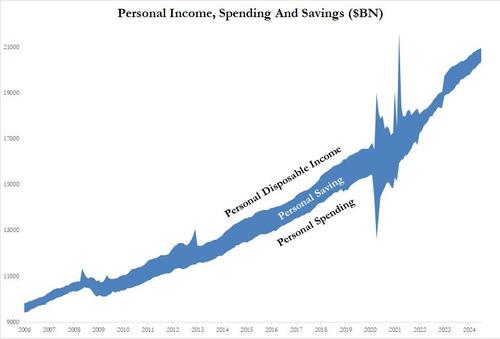
The absolute delta between the two series is shown in the next chart
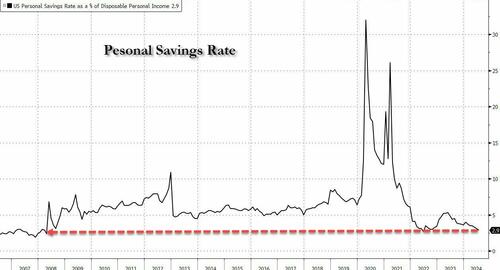
The result is another month of declining savings: in July, the US savings rate as a percentage of disposable personal income dropped below 3.0% for the first time since covid – 2.9% to be precise – from 3.1%. This was the lowest print since June ’22 and the second lowest of the post-QE era.
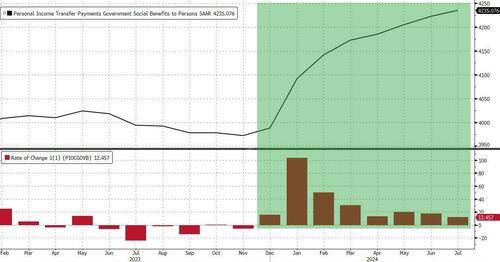
All of which takes place against a background of the eight straight month of rising government handouts (well it is an election year after all) which means the savings rate would have puked even more without it!
In other words, the consumer is now wiped out and yet inflation refuses to drop materially. So yes, the Fed will cut and then we can finally unleash the second coming of the Arthur Burns hyperinflation Fed.
Tyler Durden
Fri, 08/30/2024 – 09:09
via ZeroHedge News https://ift.tt/zaUWA73 Tyler Durden
