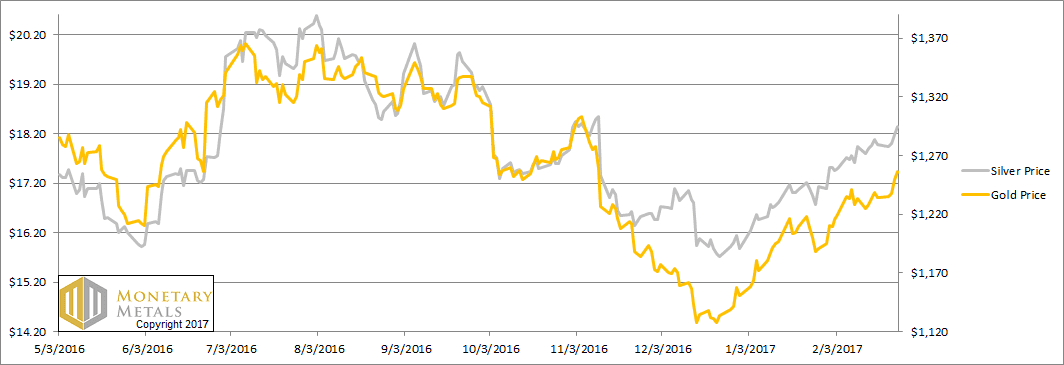
This holiday-shortened week (Monday was President’s Day in the US), the price of the dollar fell. In gold, it fell almost half a milligram to 24.75mg, and prices in silver it dropped 30mg, to 1.7 grams of the white monetary metal. Flipped upside down, gold went up 23 notes from the Federal Reserve, and silver appears to go up by 41 cents.
Below, we will show the only true picture of the gold and silver supply and demand fundamentals. But first, the price and ratio charts.
The Prices of Gold and Silver
Next, this is a graph of the gold price measured in silver, otherwise known as the gold to silver ratio. It moved sideways again this week, which would normally be odd for a time when the prices of the metals are rising.
The Ratio of the Gold Price to the Silver Price
For each metal, we will look at a graph of the basis and cobasis overlaid with the price of the dollar in terms of the respective metal. It will make it easier to provide brief commentary. The dollar will be represented in green, the basis in blue and cobasis in red.
Here is the gold graph.
The Gold Basis and Cobasis and the Dollar Price
For a very long time, we would post graphs that looked almost the same. Oh, the specifics of month, price, and basis would be different. But they had a certain sameness. The price of the dollar (i.e. inverse of the price of gold, in dollar terms) would move along with the cobasis (i.e. scarcity of gold). So as the dollar would rise (i.e. the price of gold would fall), the scarcity would rise. And vice versa. This means changes in price were due to changes in behavior by speculators.
And now we have a clear picture of … the opposite. The dollar has been falling since mid-December. And for that same time, the cobasis (scarcity of gold) has been rising.
Yes, gold has been getting scarcer as it becomes pricier.
How could this be possible? Doesn’t the law of supply and demand work for gold? You know, the standard “X” graph from Econ. 101?
Gold has several unique properties. One is that it is not purchased for consumption, but for monetary reserves or jewelry (which in most of the world is monetary reserves). Contrast that to copper which is purchased by plumbing manufacturers to make pipe. It’s a competitive market, and if the price of copper plumbing goes up too much then home builders will switch to plastic. Demand drops as price rises. Also, the marginal copper mine will increase production. Supply rises as price rises. It is self-correcting.
Gold, not being bought to consume, does not have a limit to demand as price rises. If anything a rising price (i.e. a falling currency) signals to people that holding gold is a good thing. They were wise to get out of their falling paper currency, and should consider buying more gold.
Also, virtually all of the gold ever mined in human history is still in human hands. All of this gold is potential supply, at the right price and under the right conditions. Even if gold mining worked like copper mining, and miners could just produce more, changes in mine production at the margin are not material to the overall gold supply. By official estimates, the total inventory of gold would take over 70 years to be produced at current mine production rates (and we believe this is a low estimate).
Readers may object that this question is a bit unfair, as any commodity can experience rising tightness and that will accompany its rising price for a while until the market can correct itself. That is true, but what we are looking at in gold is not that at all. When the market corrects itself—which we think is very likely, we do not see Armageddon just yet—it will not be because gold miners have cranked up their outputs, nor because gold users have substituted another metal. There is no substitute for monetary reservation, particularly as paper currencies are in the terminal stages of failure.
Our calculated fundamental price is now up to almost $1,400.
Now let’s look at silver.
The Silver Basis and Cobasis and the Dollar Price
The trend of falling dollar (i.e. rising price of silver) and rising cobasis (scarcity) is here in silver, too, but it’s weaker.
Silver does not quite have the same stocks to flows ratio as gold, but it has far and away a higher ratio than copper or any ordinary commodity. That is why silver is the other monetary metal.
The fundamental price of silver is now up to about $18.70. While this is over the market price of the metal, it’s not nearly so much above as gold.
This is why we calculate a fundamental on the gold-silver ratio over 74.
© 2017 Monetary Metals
via http://ift.tt/2mugLUG Monetary Metals