After last week’s earnings deluge, 46% of the companies in the S&P 500 have now reported actual results for Q4 2018. And according to Factset data, so far earnings season is mediocre at best with the percentage of companies reporting EPS above estimates (70%) below the 5-year average. Companies are also reporting earnings that are 3.5% above the estimates, which is also below the 5-year average. The silver lining is that in terms of revenues, the percentage of companies reporting actual revenues above estimates (62%) is above the 5-year average, and on aggregate, companies are reporting revenues that are 0.8% above the estimates, which is also above the 5-year average.
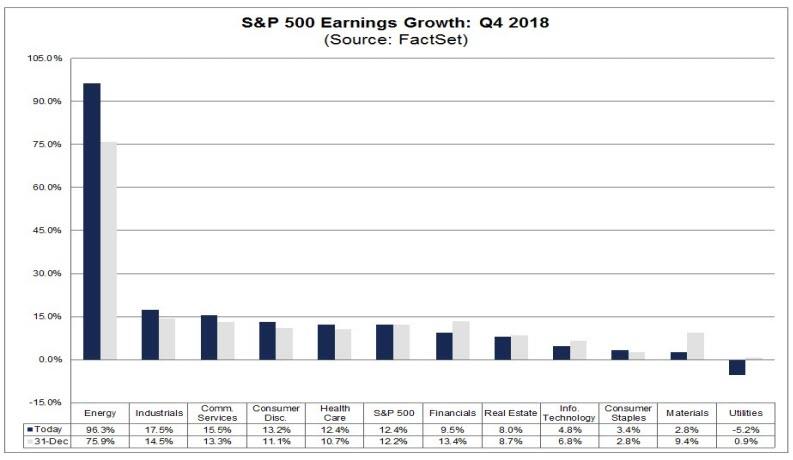
Separately, the blended year-over-year earnings growth rate for the fourth quarter is 12.4% today, which while is above the earnings growth rate of 10.9% last week, if well below the Q3 earnings growth, with positive earnings surprises reported by companies in multiple sectors – led by the Energy sector – responsible for the increase in the earnings growth rate during the week.
While hardly a disaster, if 12.4% is the actual growth rate for the quarter, it would mark the first time the index has not reported earnings growth above 20% since Q4 2017 according to Factset. However, it will also mark the fifth straight quarter of double-digit earnings growth for the index (although this is unlikely to persist, see below). Ten of the eleven sectors are reporting year-over-year earnings growth. As shown in the chart above, five sectors are reporting double-digit earnings growth, led by the Energy, Industrials, and Communication Services sectors.
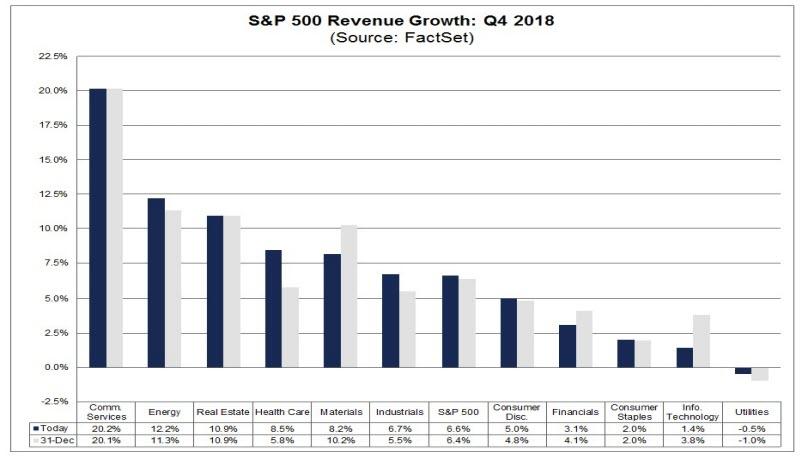
Looking at the top line, the blended, year-over-year revenue growth rate for the fourth quarter is 6.6% today, which is above the revenue growth rate of 6.2% last week. Positive revenue surprises reported by companies in multiple sectors (led by the Health
Care sector) were responsible for the increase in the revenue growth rate during the week. Ten of the eleven sectors are reporting year-over-year growth in revenues. Three sectors are reporting double-digit growth in revenues: Communications Services, Energy, and Real Estate.
Some more key metrics on Q4 earnings season courtesy of Factset:
- Earnings Revisions: On December 31, the estimated earnings growth rate for Q4 2018 was 12.2%. Six sectors have higher growth rates today (compared to December 31) due to upward revisions to EPS estimates and positive EPS surprises.
- Earnings Guidance: For Q1 2019, 33 S&P 500 companies have issued negative EPS guidance and 9 S&P 500 companies have issued positive EPS guidance.
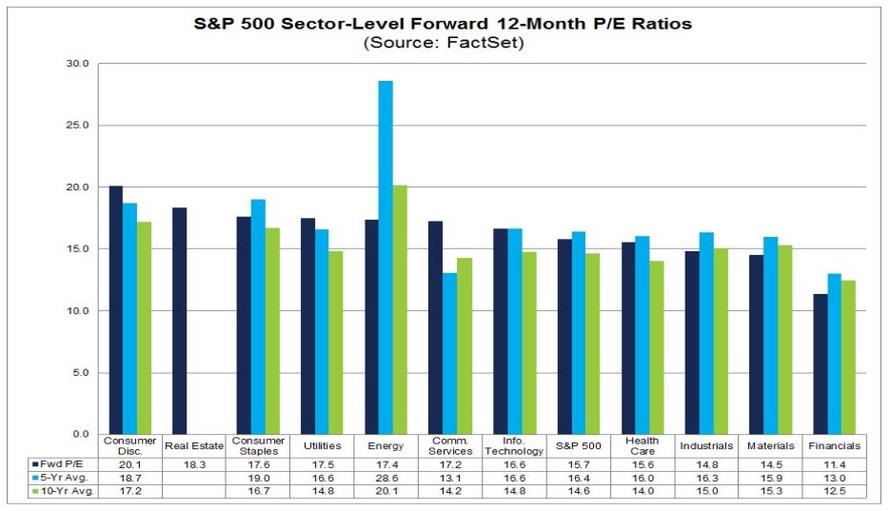
- Valuation: The forward 12-month P/E ratio for the S&P 500 is 15.7. This P/E ratio is below the 5-year average (16.4) but above the 10-year average (14.6).
So on net, earnings season is progressing generally in line with expectations. That’s the good news.
The bad news is that while companies are still reporting generally strong earnings, the good days are about to end with a bang as a result of the recent barrage in profit warnings and negative preannouncements, first and foremost starting with Apple, which issued a shocking guidance cut one month ago for the first time since 2001.
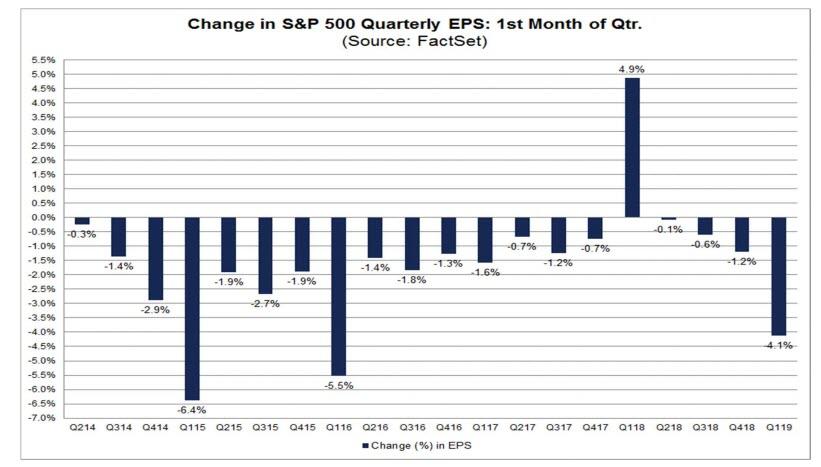
As a result, during January, analysts lowered earnings estimates for companies in the S&P 500 for the first quarter, and the Q1 bottom-up EPS estimate dropped by 4.1% (to $38.55 from $40.21) during this period.
How significant is a 4.1% decline in the bottom-up EPS estimate during the first month of a quarter? How does this decrease compare to recent quarters? Here are some troubling answers from FactSet which notes that during the past five years (20 quarters), the average decline in the bottom-up EPS estimate during the first month of a quarter has been 1.6%.
During the past ten years, (40 quarters), the average decline in the bottom-up EPS estimate during the first month of a quarter has been 1.8%. During the past fifteen years, (60 quarters), the average decline in the bottom-up EPS estimate during the first month of a quarter has been 1.7%. Thus, the decline in the bottom-up EPS estimate recorded during the first month of the first quarter was larger than the 5-year, 10-year, and 15-year averages.
In fact, the first quarter marked the largest decline in the bottom-up EPS estimate during the first month of a quarter since Q1 2016 (-5.5%). At the sector level, all eleven sectors recorded a decline in their bottom-up EPS estimate during the first month of the quarter, led by the Energy (-22.5%) and Information Technology (-7.3%) sectors. Overall, seven sectors recorded a larger decrease in their bottom-up EPS estimate relative to their 5-year average and their 10-year average for the first month of a quarter.
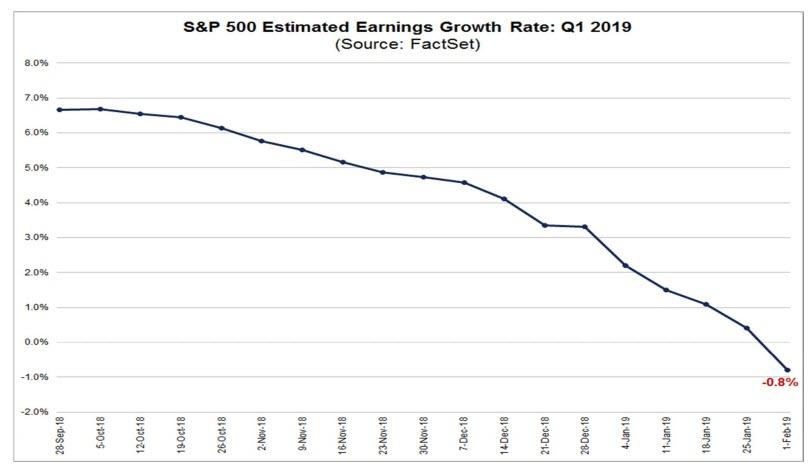
What is striking is just how fast Q1 earnings have been slashed lower, with the S&P expected to post a 3.3% growth as recently as Dec 31, a number which is now down to -0.8%, as consensus for the first time expects Q1 EPS to post an annual decline due to downward revisions to EPS estimates during the month.
The collapse is even more pronounced if one extend the period under observation: on September 30, the estimated earnings growth rate for Q1 2019 was 6.7%. On December 31, the estimated earnings growth rate for Q1 2019 was 3.3%. Six of the eleven sectors are now predicted to report a decrease in earnings for the first quarter, curiously led by the Information Technology (-8.9%) sector which until recently had been the fastest growing sector for years.
And, as noted above, if the index reports an actual decline in earnings for the first quarter, it will mark the first year-over-year decline in earnings since Q2 2016 (-3.1%).
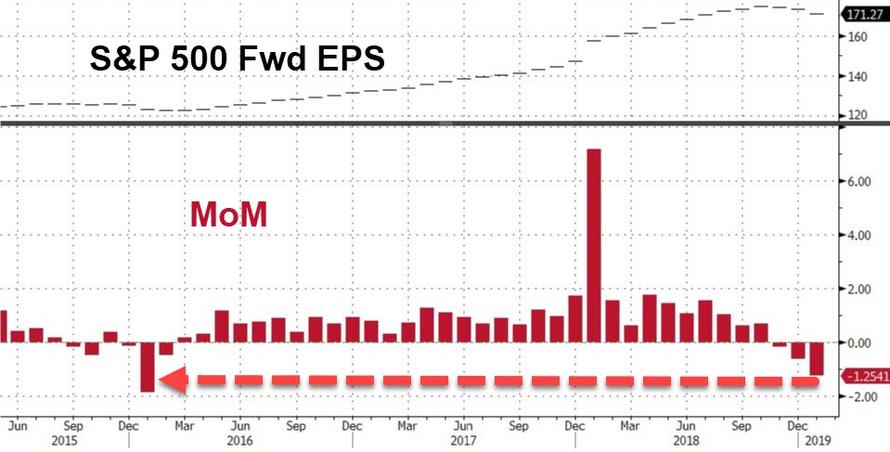
Furthermore, the after peaking in October, forward EPS for 2019 has been declining ever since and in January recorded its biggest sequential decline since January 2016.
What about beyond Q1, which is now expected to be the first quarter since 2016 to post negative earnings growth? Well after the earnings decline in Q1 2019 analysts now expected – at best – low, single-digit growth in earnings in Q2 2019 and Q3 2019. For Q1 2019, analysts are projecting a decline in earnings (-0.8%) and revenue growth of 5.7%.
- For Q2 2019, analysts are projecting earnings growth of 1.6% and revenue growth of 5.1%.
- For Q3 2019, analysts are projecting earnings growth of 2.7% and revenue growth of 4.9%.
- For Q4 2019, analysts are projecting earnings growth of 9.9% and revenue growth of 6.0%.
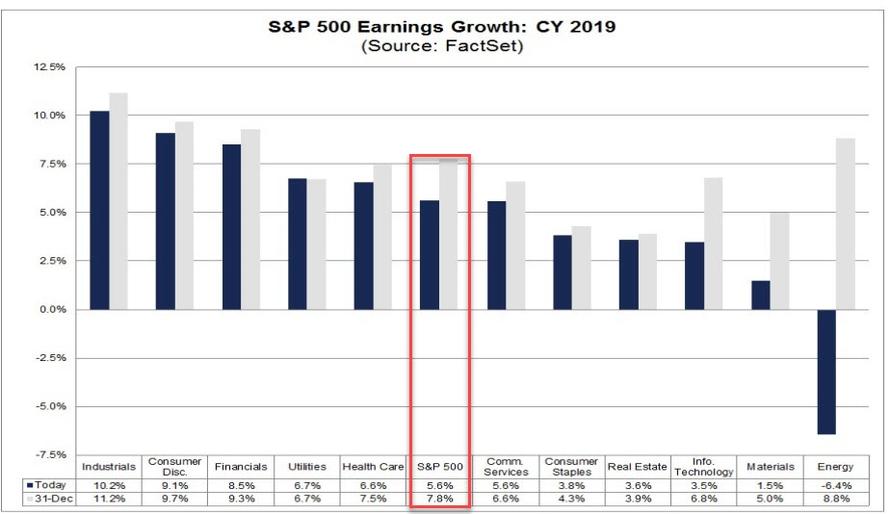
- For CY 2019, analysts are projecting earnings growth of 5.6% and revenue growth of 5.3%.
Incidentally the 5.6% EPS growth for the full year 2019 is already a 30% haircut to the 7.8% EPS growth that was expected on Dec. 31… and we are only 1 month into the new year.
What does all of this mean for stocks?
Well, the current consensus year-end target price for the S&P 500 is 3044.19, which is 12.6% above the closing price of 2704.10. At the sector level, the Energy (+18.8%) sector is expected to see the largest price increase, as this sector has the largest upside difference between the bottom-up target price and the closing price. On the other hand, the Utilities (+1.8%) sector is expected to see the smallest price increase, as this sector has the smallest upside difference between the bottom-up target price and the closing price.
Meanwhile, from a valuation standpoint, the forward 12-month P/E ratio – assuming 2019 EPS grows 5.6% Y/Y – is 15.7x. This P/E ratio is below the 5-year average of 16.4 but above the 10-year average of 14.6. It is also above the forward 12-month P/E ratio of 14.4 recorded at the end of the fourth quarter (December 31). Since the end of the fourth quarter (December 31), the price of the index has increased by 7.9%, while the forward 12-month EPS estimate has decreased by 1.1%.
At the sector level, the Consumer Discretionary (20.1) sector has the highest forward 12-month P/E ratio, while the Financials (11.4) sector has the lowest forward 12-month P/E ratio.
Finally, as clearly shown in the chart beow, the only reason stocks have surged nearly 15% from their mini bear market lows on Dec 24 is due to multiple expansion, as Forward EPS have continued to decline, however the Fed’s dovish reversal has been quite successful in boosting forward PE multiples.
As the chart above clearly shows, the Fed’s dovish flip has made earnings largely irrelevant for the market’s near term direction, as Powell’s stated intent to pause hiking and ostensibly slow the Fed’s balance sheet shrinkage has taken priority over everything else. In any case, now that Q4 earning session is over the hump, during the upcoming week, 103 S&P 500 companies (including 1 Dow 30 component) are scheduled to report results for the fourth quarter. Expect even more market upside irrelevant of what historicals companies report or what guidance they deliver.
via ZeroHedge News http://bit.ly/2Gk2k1D Tyler Durden
