Authored by Chris Hamilton via Econimica blog,
Math, being math, is pretty helpful in figuring out problems. Today’s problem is how long employment (and associated economic activity) can move upward. Math seems to suggest mid 2019 is the likely terminus for both the growth in employment and likely economic activity. I’ll detail why 2019 can offer an increase of just 65 thousand potential new employees per month and why this will put the brakes on the US economy.
The most reliable gauge of changing economic demand is the changing population. Even more telling is the growth in employment, broken down among the different age segments that make up the workforce. The chart below details the year over year change in employment since 1970 among 15-24yr/olds (yellow columns), 25-54yr/olds (blue column), and 55-64yr/olds (red columns). Lastly, the black line represents the total 15-64yr/old population change. The decelerating total population growth among the working core should be pretty well known. However, the decelerating employment growth among 15-24 and 25-54yr/olds should be noted while the substitution of the 55-64yr/old employees also pointed out.

Breaking out population growth versus employment growth among each age segment:
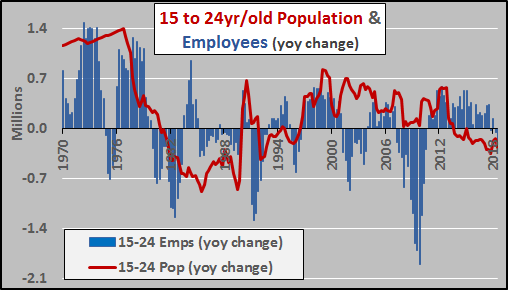
15-24yr/olds year over year population change (red line) versus year over year change in employment among them (blue columns).
25-54yr/olds year over year population change (red line), versus year over year change in employment among them (blue columns).

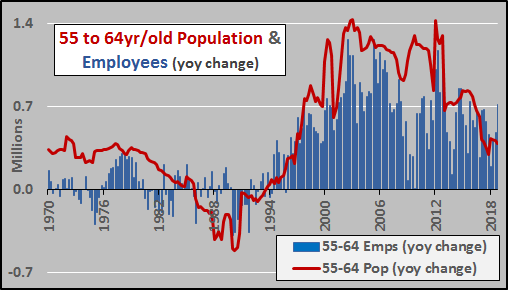
55-64yr/olds year over year population change (red line), versus year over year change in employment among them (blue columns).
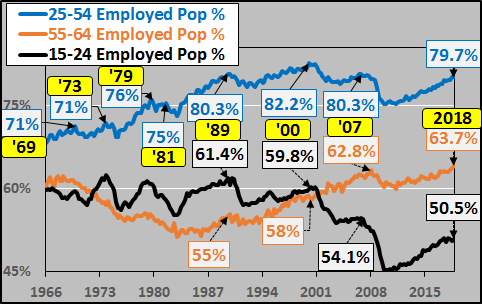
During each economic cycle, jobs grow faster than the population until peak employment hits and absent further jobs growth, recession ensues. The chart below shows peak employment for every recession back to 1969.
2015 through 2018: Population Growth vs. Jobs Growth
To highlight my point, I detail the population growth versus jobs growth among the primary working age population from 2015 through 2018…plus I note the new normal primary population growth nexus, the elderly, with very low labor force participation rates:
15-24yr/olds
- population -835 thousand
- employees +442 thousand
- 50.5% labor force participation
25-54yr/olds
- population +1.6 million
- employees +4.55 million
- 79.7% labor force participation
55-64yr/olds
- population +1.9 million
- employees +2.1 million
- 63.7% labor force participation
65-69yr/olds (fyr)
- population +1.8 million
- 32% labor force participation
70-74yr/olds (fyr)
- population +2.6 million
- 19% labor force participation
75+yr/olds (fyr)
- population +2.1 million
- 8% labor force participation
2019 Population Growth and Potential Labor Force Growth
Given we pretty much know the 15+yr/old population growth for 2019 by age segment, a quick estimate of potential labor force growth is easy enough. Since the majority of the population growth in 2019 will be among elderly with very low labor force participation rates, 15+yr/old population growth of approx. 2.3 million nets an annual potential labor force increase of about 760 thousand (an increase of 64 thousand a month). It doesn’t take a genius to determine if jobs are growing by up to 300 thousand per month but the potential labor force is growing by just 64 thousand per month, and core age segments are already at typical “full employment” (as noted above)…peak employment is fast approaching. However, over the next five years, this trend only worsens with average potential labor force growth sagging under 60 thousand monthly (all this is premised on ongoing high rates of immigration…any slowdown in immigration will directly reduce the potential workforce).
Come Summer of 2019, employment among the 25-54yr/old population segment will likely reach the typical breaking point slightly above 80% employment. Simultaneously, employment among 55-64yr/olds will likely peak out at a new record high, potentially up to 65%. Employment among 15-24yr/olds may have already peaked at 50.7% in 2018 and is likely to continue rolling over for multiple reasons. With such minimal upcoming population growth among the 15-64yr/old potential workforce and such outsized employment gains, coupled with such low labor force participation rates among the 65+yr/old population…growth in employment and associated economic activity will soon hit a brick wall…previously known as recession. This is the primary reason why this was likely the final positive interest rate cycle in America, detailed HERE.
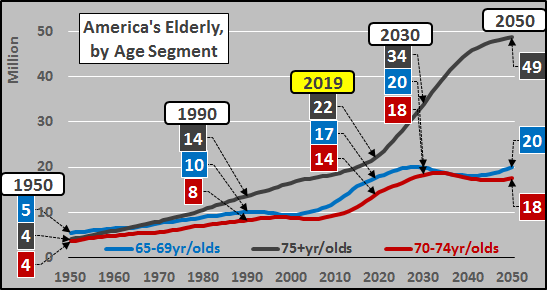
Again, the reason jobs growth will be hitting a brick wall is pretty straight forward. The vast majority of the US population growth is now coming among those that are unwilling/unable to work, particularly the 75+yr/old (chart of growing elderly US populations below).
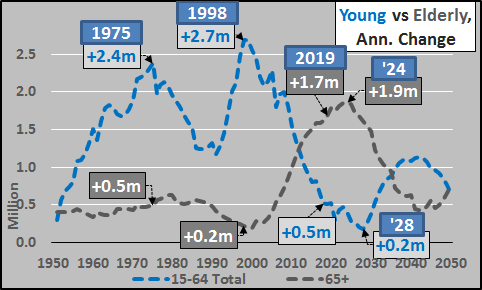
Just for comparison, the chart below shows the annual change in the 15 to 64yr/old population versus annual change in 65+yr/olds. That the US (and nearly all advanced and developing economies) have been struggling since the late ’90’s as this reversal in “magnetic North” takes place should be no surprise.
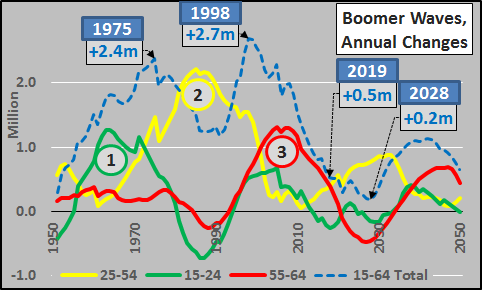
Lastly, highlighting when the boomer growth wave crested in each age segment (1=15-24yr/olds, 2=25-54yr/olds, 3=55-64yr/olds) and the impact on the 15 to 64yr/old annual population growth (dashed line). Obviously, we are entering the minimum 15 to 64yr/old growth period over the next decade while simultaneously the elderly population skyrockets (above).
via ZeroHedge News http://bit.ly/2SpEdoM Tyler Durden