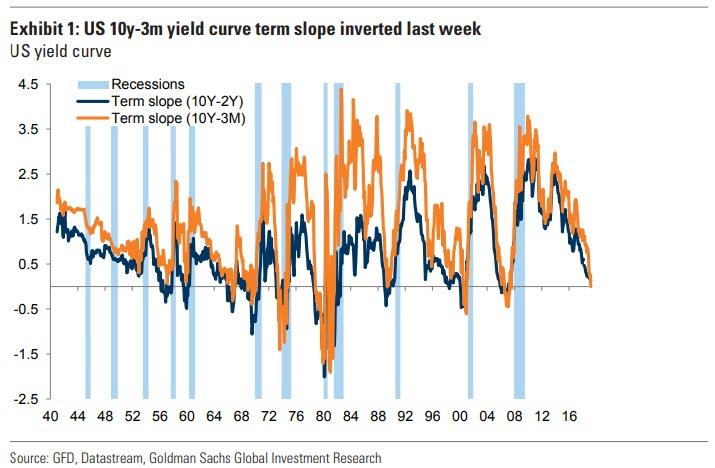
Last week the yield curve, or rather the 3 month-10 year spread inverted for the first time since 2007, an event which sparked near-panic in the market as historically curve inversion has preceded the last 7 recessions.
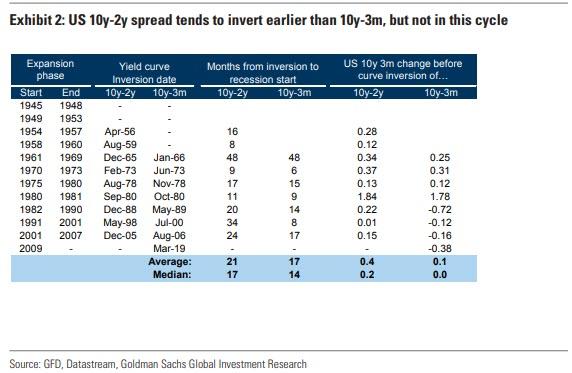
One unique feature about this latest curve inversion, however, is the sequence of events. Traditionally, the yield curve usually tends to flatten as the economy moves later cycle and the Fed increases rates to prevent the economy overheating. As such, the 2s10s spread usually invert earlier than 3M-10Y as it incorporates rate expectations of subsequent hikes.
However, as we observed repeatedly, this did not happen last week, with the 3M-10Y curve inverting alone, which as Goldman observes overnight “is quite unusual.” In the last 4 cycles bear flattening (the yield curve level rising with 2y rates increasing faster than 10y rates) has driven curve inversion, while this time the curve have ‘bull flattened’ (the yield curve level falling with 2y rates falling more slowly than 10y rates).
So what caused this reversal in the traditional yield curve flattening sequence? According to Goldman’s Alessio Rizzi, this dynamic has been supported by international spillovers from non-US rates “where QE and low growth and inflation expectations have supported lower 10y rates.”
As a result, Goldman concludes that “the curve inversion signal could be less powerful for recessions than in the past since long dated yields across regions have become more correlated.” In other words, the Fed which will cause the next depression when the “everything bubble” finally bursts, may not have caused the next recession. Or at least Goldman does not think it has. Yet.
In any case, to justify its thesis, Goldman also points out that credit spreads which usually react to recession risk early – did not increase materially last week.
Ok, fine, but what if Goldman’s optimistic spin is wrong and a recession is now inevitable? The question then is when?
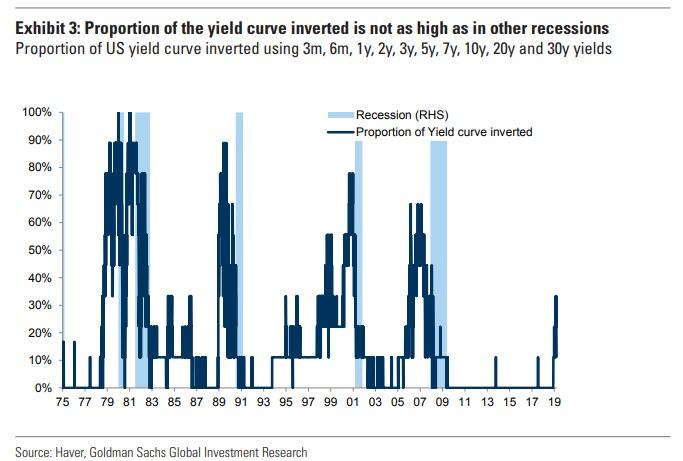
As we pointed out last week, recessions tend to take time to materialise after curve inversion, in particular recently as expansion phases have become longer. For example in the last 2 cycles, a recession started more than 2 years after the curve inversion date (based on 10y-2y spread). Moreover, tracking the proportion of the curve inversion across different maturities, the signal still remains relatively weak compared to the last 4 recessions where more than 70% of the curve was inverted compared to about 40% currently.
Finally, the question on all investors’ lips is how do risk assets perform once the curve flattens and/or inverts. According to backtests from Goldman, while risky assets in general can have positive performance with a flat yield curve, risky asset performances tend to be lower. This is consistent with Goldman’s base case forecast combining low (but positive) returns from here given the lack of profit growth and a less favouable macro backdrop.
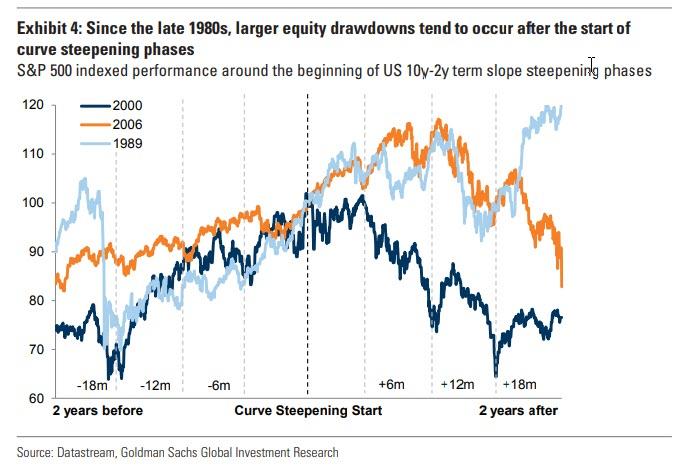
What is far more notable, as we showed most recently last July, is that since the mid-1980s, significant stock drawdowns (i.e. market crashes) began only when term slope started steepening after being inverted.
Of course this cycle has been different from all prior ones given the ultra low level of rates and so historical results are unlikely to be repeated, and while one can argue that recession risk remains “somewhat low” – as Goldman does – amid an environment of lower returns and high vol of vol, the reality is that nobody knows what will happen to the financial system once the biggest source of profitability for banks – a normal sloping yield curve no longer serves to generate income and causes the loan issuance machinery to grind to a halt.
via ZeroHedge News https://ift.tt/2FCia77 Tyler Durden


