Back in January 2018, during the infamous stock market meltup and right before the Volmageddon implosion of inverse VIX ETFs when sellers of volatility saw years of accrued paper profits wiped out in seconds on February 5, 2018, the financial press greeted readers with article such as this one.
Just one week later, it would plunge 10%.
Fast forward 16 months, one mini bear market and dramatic end of central bank “normalization” later, and the S&P is now up almost 25% since its Christmas Eve plunge which forced Steven Mnuchin to call the Plunge Protection Team… and the rest is history.
And now, with the global economy deteriorating by the day (despite “credible” data out of China that the world’s most important economy is starting to recover) and the worst earnings season since 2016 having officially started, we are starting to see similar headlines in the financial media: no matter what one throws at the market, it just refuses to go down.
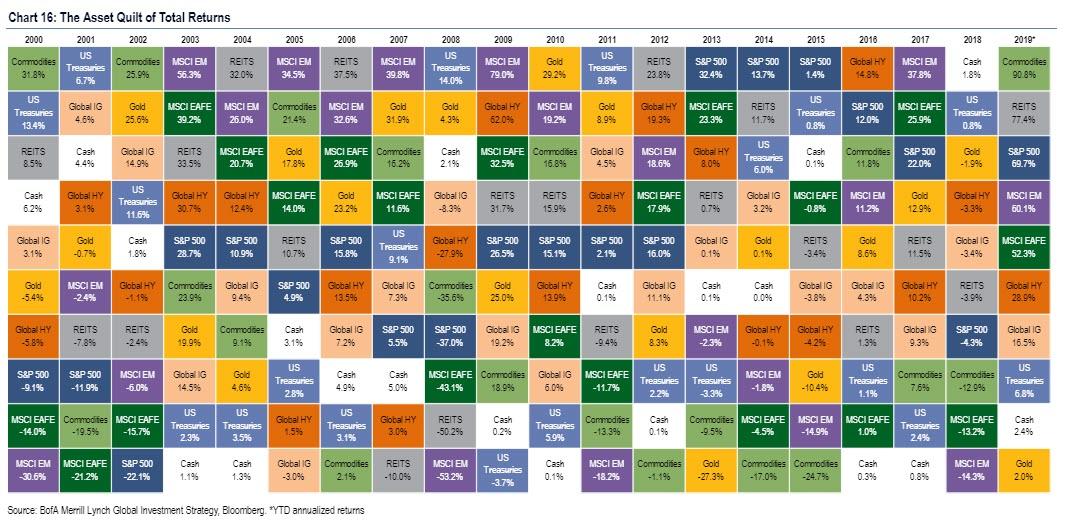
But wait, it may be about to get much worse, or better – depending on whether on is bearish or bullish – because as Bank of America writes for the second consecutive week, if the current ramp in the the stock market continues without any notable drawdowns, the S&P is on the verge of the biggest annual blow off top in history as the annualized return is currently just over 69%. That would make 2019 the best year ever in the history of capital markets.
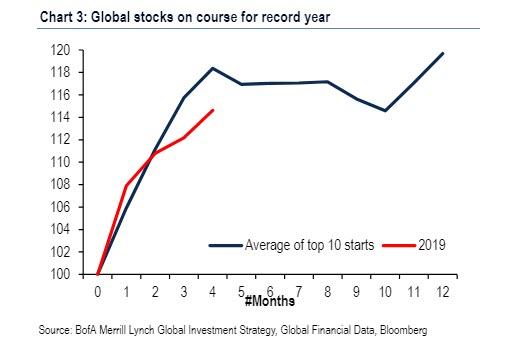
The following chart from Bank of America shows the current YTD performance for the S&P relative to the average of the Top 10 best starts for stocks. It shows that if one goes off simply by the average return of the 10 best years for the S&P, then 2019 is already 70% of the way to outperforming the full year return.
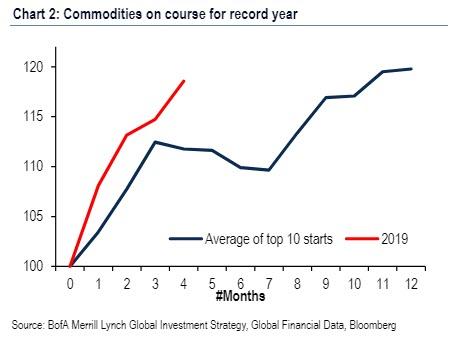
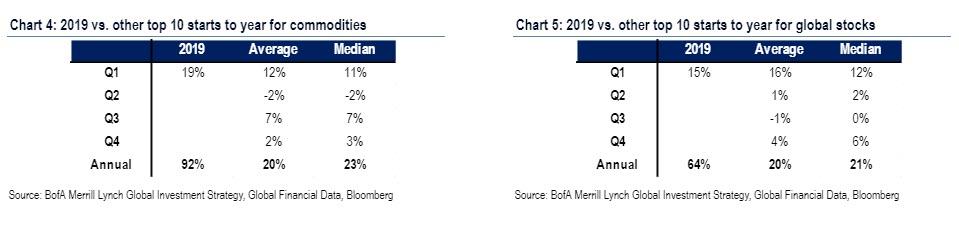
It’s not just stocks however: the annualized return for commodities is even more impressive at 91%, and is still tracking strongest in past 100 years.
So what happens next?
Well, if analysis these days is as simple as pulling a Birinyi “ruler” extrapolation (and with central banks in charge of price formation once again, there is no reason to think that fundamentals matter any more), then as Bank of America’s CIO Michael Hartnett writes, the history (for what’s it’s worth) of Top 10 best Q1 starts shows 1) commodity returns dip 2% in Q2, but 2). end year with median 22.5% gain (hit-ratio 8/10).
A similar analysis for stocks shows 1) stock prices follow big Q1 with small gain Q2, and flat in Q3, and 2) end-year up a median 20.8% gain (which would mean 3028 this year – hit-ratio year 9/10).
Historical analogies aside, what does Hartnett, who has traditionally had a bearish bent on risk assets, think happens next?
His first observation is that despite a market that is approaching massively overbought levels, the bank’s own “Greed” indicator isn’t flashing red yet, and remains in “neutral.” It would, however, enter the redline territory and trigger a sell-signal level of 8 in Q2 would if there is a combo of i) $20bn EM equity inflow, $25bn HY+ EM debt inflow, FMS cash level <4.2%, FMS equity OW >10%.
Which brings up the broader question: with the S&P just 1% away from its all time highs, how does one spot the market top?
BofA’s response is that to spot the inflation point, the lead indicators of the rally would become “overbought”, and price action flips from “bad news = good” to “good news = bad”;
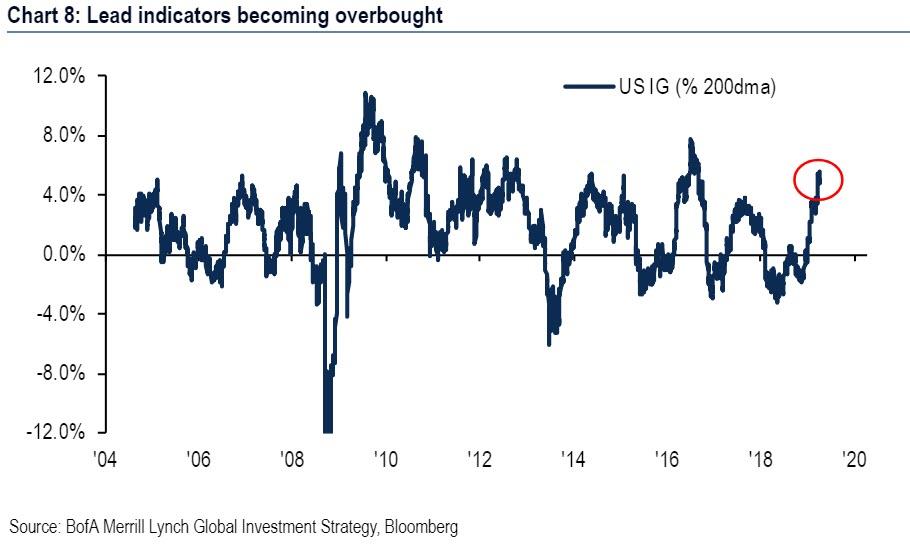
Meanwhile, some signals that indicate euphoria include the IG ETF LQD which is already in the most overbought (rel to 200dma) since Aug’16, the Shanghai Composite is the most overbought since Jul’15, the Semiconduct, SOX, index is most overbought since Mar’18. At the same time, LQD >$122, SOX >1650 would signal most overbought conditions in credit & tech since 2010 and “hence would be warning sign to bulls.”
One final question: how to spot peak Policy, Profits & Positioning (all critical factors, especially the first one as without central banks this market would not exist). The answer:
- investor feedback “twitchy” as Fed perma-ease,
- US-China trade deal, and global “green shoots” all largely discounted;
Finally, as Hartnett admits, it is hard for policy to be any more positive for risk assets, or any more negative for volatility; but atthe same time, BofA claims that what is NOT discounted is US/ UK/ Australian/ Canadian real estate markets showing recent drop in mortgage rates boosting activity, a subsequent rise in bond yields in Q2, and rotation from credit to equity & commodities (long commodity currencies & bank stocks) would all take place ahead of “a big summer top.” As such, Bank of America stays bullish for now, expecting to a move higher to SPX >3000 in Q2, before slumping in the second half and potentially retesting the 2018 lows.
via ZeroHedge News http://bit.ly/2G6U9nE Tyler Durden