While December answered one of the burning questions facing traders, namely where approximately is the Powell Put, or the level where the Federal Reserve will abandon monetary prudence and flip from hawkish to dovish, another question still remains, i.e., where is the “Trump Put”, or the price level below whichthe US president will not engage in further trade war escalation.
To be sure, the history of the US administration’s rhetoric and actions on trade policy over the last 18 months clearly suggests the state of the equity markets played a role. Consider the following observations from Deutsche Bank’s Binkhy Chadha:
- The start of the trade war. The first concrete action in the trade war, the imposition of tariffs on washing machines and solar panels, came on Jan 22 2018 at a time when the S&P 500 was surging to new record highs almost daily and talk in the market was of a “melt up”. The market peaked and sold off just days later, although the tariff announcement was most likely not a direct driver given scant attention paid to it at the time.
- The market starts paying attention. By the end of February 2018, the market had recovered 2/3 of the way back to the peak when the next installment of the trade war arrived in the form of steel and aluminum tariffs. The market sold off again, but only briefly and then rallied back. Soon after a plan for taking action against China was announced. The market then sold off sharply and stayed near a bottom. It started rallying only after President Xi appeared to de-escalate by promising to open up China’s economy and President Trump thanked him on Twitter followed by de-escalations such as the announcement of trade talks in China.
- Testing the market’s resolve. The US and China jointly issued a statement on May 19 2018 that progress was made on a deal, only for President Trump to then negate it with a tweet a few days later. This was also immediately followed by the threat of global auto tariffs and proposed tariffs on $50bn of Chinese goods. As the market reacted only mildly to these announcements and continued to grind higher, the administration embarked on a series of escalations over the summer, culminating in a 10% levy on $200bn of Chinese goods in mid-September, slated to rise to 25% by year end. The market peaked shortly after in late September and then fell sharply.
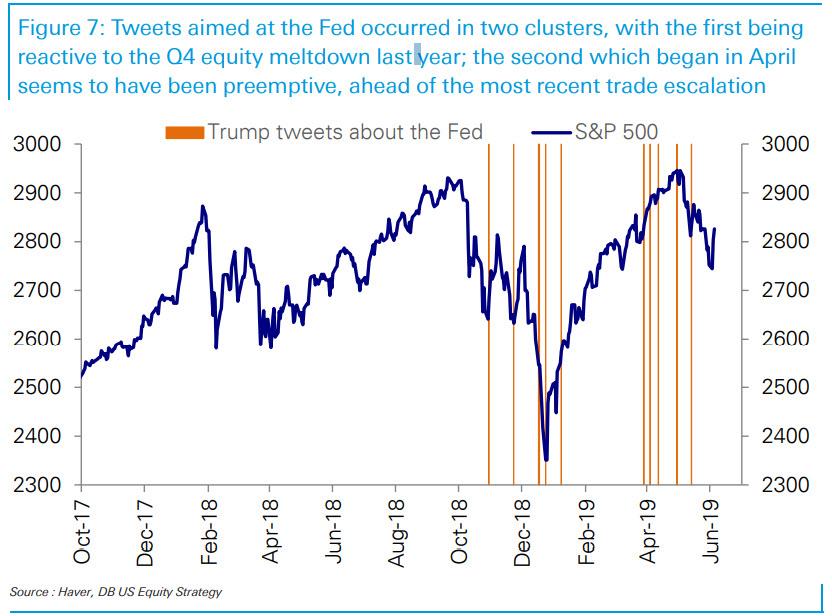
- Spin and repair phase. As the market sold off through October and fell under 2650, we got the first Trump tweet about the Fed, asking them to be dovish. A Trump-Xi phone call on Nov 1 saw a short- lived rally but the market sold off again, which prompted another tweet aimed at the Fed.
- Freefall. Hopes of a G20 truce saw the market rally briefly again in late November, but while a plan to strike a deal was announced it was quickly overshadowed by the arrest of Huawei’s CFO in Canada and Trump’s “tariff man” tweet in early December. The market went into free fall even as the administration tried to de-escalate. Criticism of the Fed ratcheted up at the same time.
- De-escalation phase. Starting late December 2018 and continuing all the way through Apr 2019, there were several efforts to de-escalate with numerous statements and tweets asserting that talks with China were going very well. Prompted in part by the conciliatory moves and hopes of a resolution the S&P 500 rallied uninterrupted through April.
- Renewed tensions just as market notched a new high. The surprise tweet re-escalating trade tensions and raising the tariff rate on $200bn Chinese goods from 10% to 25% occurred on the weekend right after the S&P 500 reached a new high.
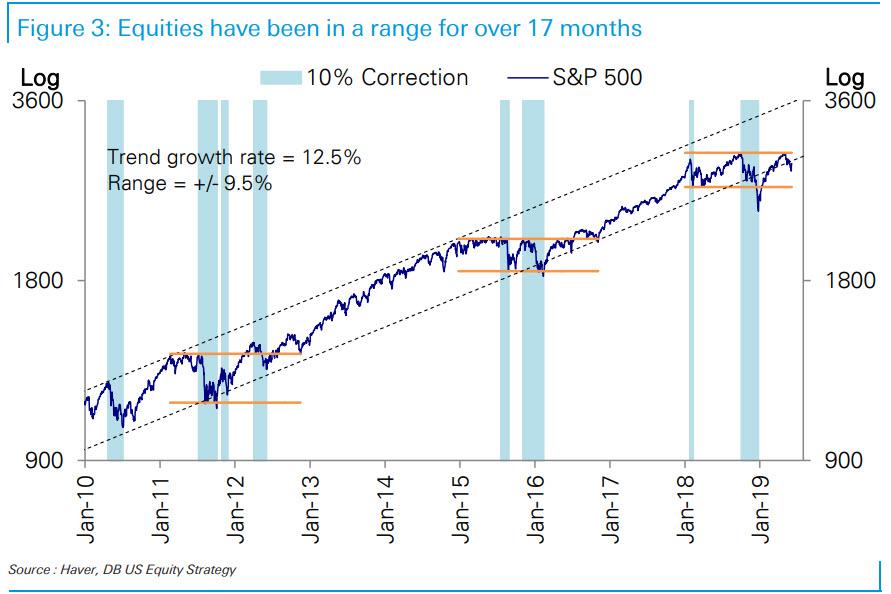
This can all be summarized by two charts, the first showing the locus of major escalations, which tend to cluster at market tops…
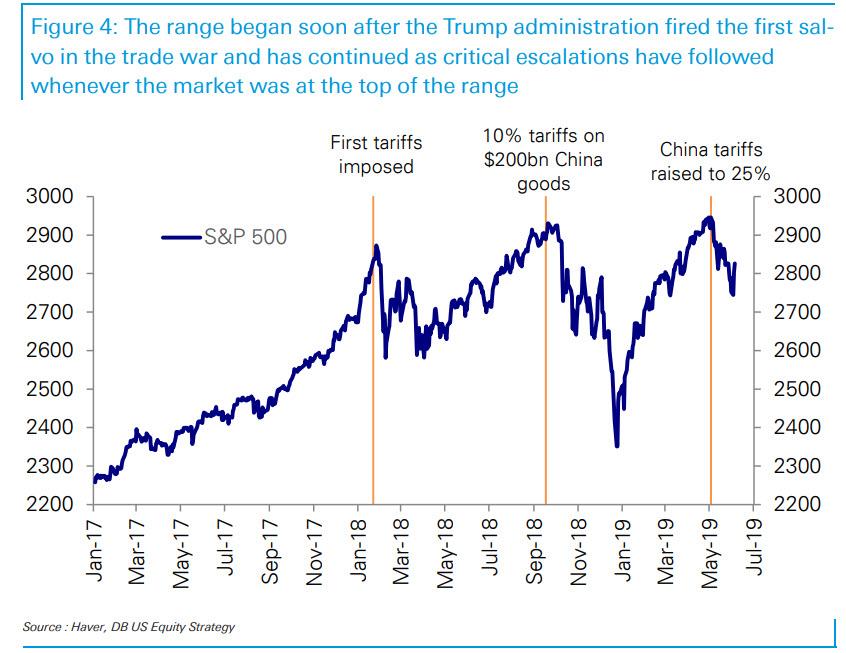
… while there are virtually no trade war escalations when the S&P is below 2,650.

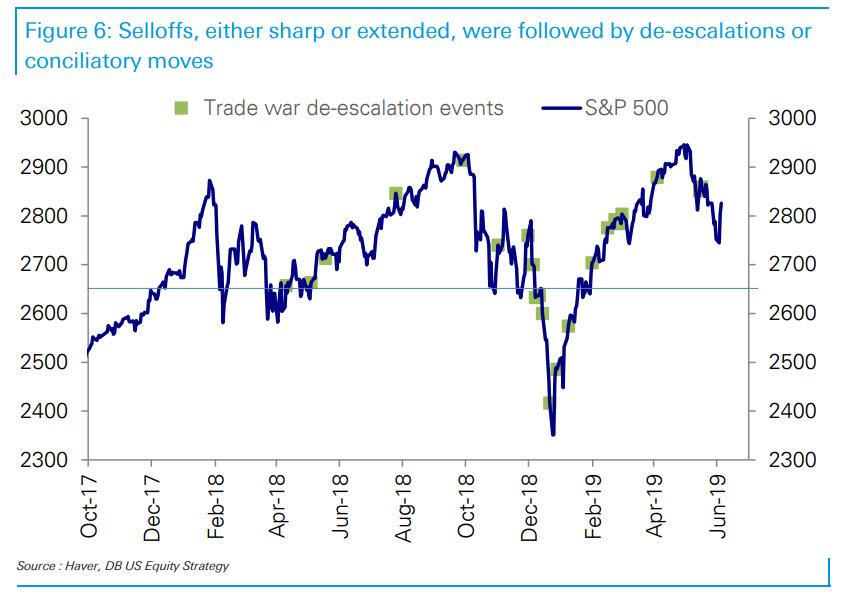
Meanwhile all selloffs are followed by de-escalations:
So is there a “Trump put” when the S&P drops below 2650?
While escalations and de-escalations on trade occurred at a variety of levels and trajectories of the S&P 500 and they were clearly not the only driver, Deutsche Bank notes several empirical regularities.
- One, major escalations followed new market peaks, the timing suggesting the administration viewed the peaks as an indicator of stock market strength even though as we have noted they have been in a range for over 17 months now.
- Two, rallying markets were sufficient for escalations and new peaks not necessary.
- Three, selloffs, either sharp or extended, were followed by de-escalations or conciliatory moves. The Q4 2018 20% selloff was followed by an extended period of de-escalation.
- Four, there were no escalations below 2650 and this naturally looks to be the Trump put level, if there is one.
- Five, complaints about the Fed in hindsight may well have been an indicator of subsequent intent on trade policy, with preemptive complaints associated with intentions to maintain or escalate trade pressure; an absence of Fed tweets suggesting an intent to de-escalate.

- Finally, we would emphasize that while the S&P 500 2650 level appears to be the put level followed by de-escalation, these de-escalations were not effective in preventing the market from falling significantly further in Q4 last year with the eventual bottom another 11% lower.
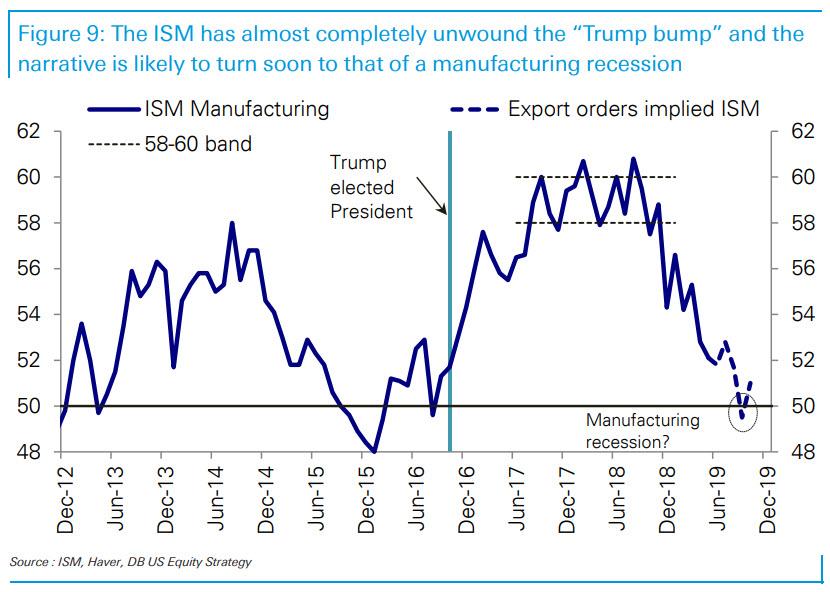
Is the level of the S&P the only trigger to watch for trade war “de-escalation”? No: in Chadha’s view, a more likely imminent trigger for sustained de- escalation is the state of US manufacturing, where the Trump-bump to the ISM has already been wiped out; and prospects are for continued declines, taking it to recession levels. Deutsche Bank explains:
In October 2016, the month before the presidential election, the ISM manufacturing index, in its early stages of recovery from the prior US dollar and oil shocks printed 51.7. It then rose to 58-60 by the summer of 2017 and stayed there for about 15 months, in what was unusually sustained period of growth at high levels. Since the slowdown began in November last year, the ISM has been falling sharply and has already fallen to 52.1, while new export orders which have been leading the headline continue to point down.
So the “Trump bump” to manufacturing in the US which takes place in many swing states has already petered out. As a result, a continued decline and in particular a falling below 50 will be hard to spin as anything but a manufacturing recession. It may thus force Trump to once again concede to China in hopes of sparking a fresh rebound.
But besides the stock market and the state of US manufacturing, arguably most critical for the de-escalation calculus are the President’s job approval ratings, but – as DB correctly notes – these are unlikely to fall until the trade war begins to impact consumer goods sourced from China or Mexico.
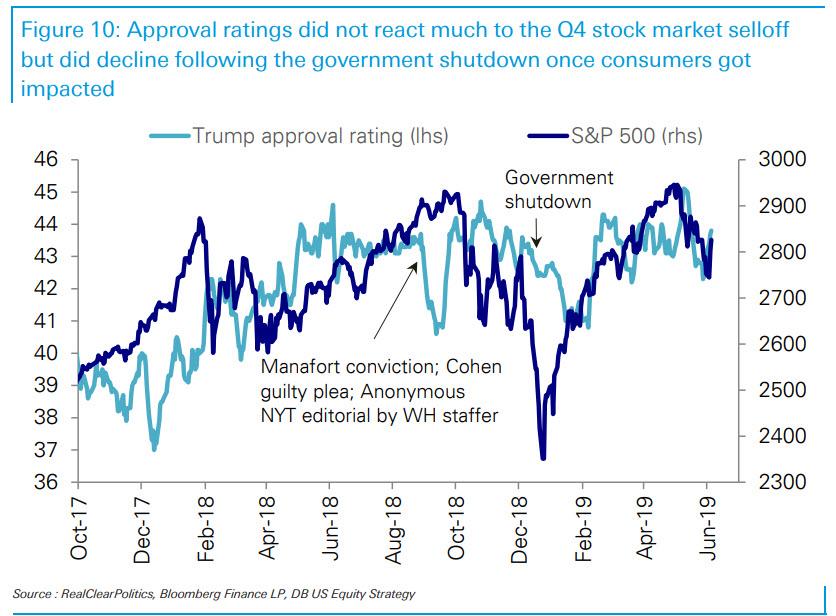
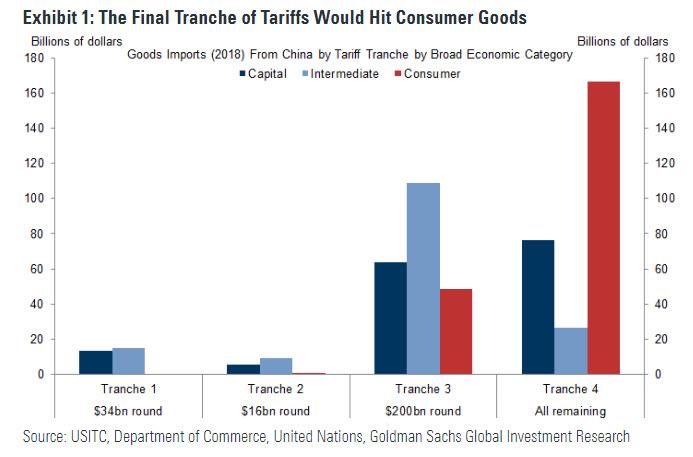
One can therefore argue, that the lightning rod for the administration to de-escalate would be a decline in approval ratings. But there is a major risk here: approval ratings tend to be slow moving; and so far the impacts have fallen largely on corporates. It is also notable that President Trump’s approval ratings did not respond to the large declines in the stock market in Q4 last year, even though with a lag consumer confidence did. But the subsequent government shut down did see his approval ratings fall, arguably with a lag as it began to impact public services such as TSA-related delays at airports. So approval ratings may not fall until tariffs or supply issues associated with imports begin to impact the prices of US consumer goods from China, which in turn will only happen months after Trump enables tariffs on the last, 4th tranche, which will include tariffs on virtually all Chinese imports.
At that point it just may be too late to hope for a graceful concession as both Trump and Xi will be way too deep in their “war of personalities”, and the hit to Trump’s approval rating may be far greater if he is perceived as waving a white flag in the trade war, than if he simply maintains a strategy which ends up pushing stocks into a bear market and the economy into a recession.
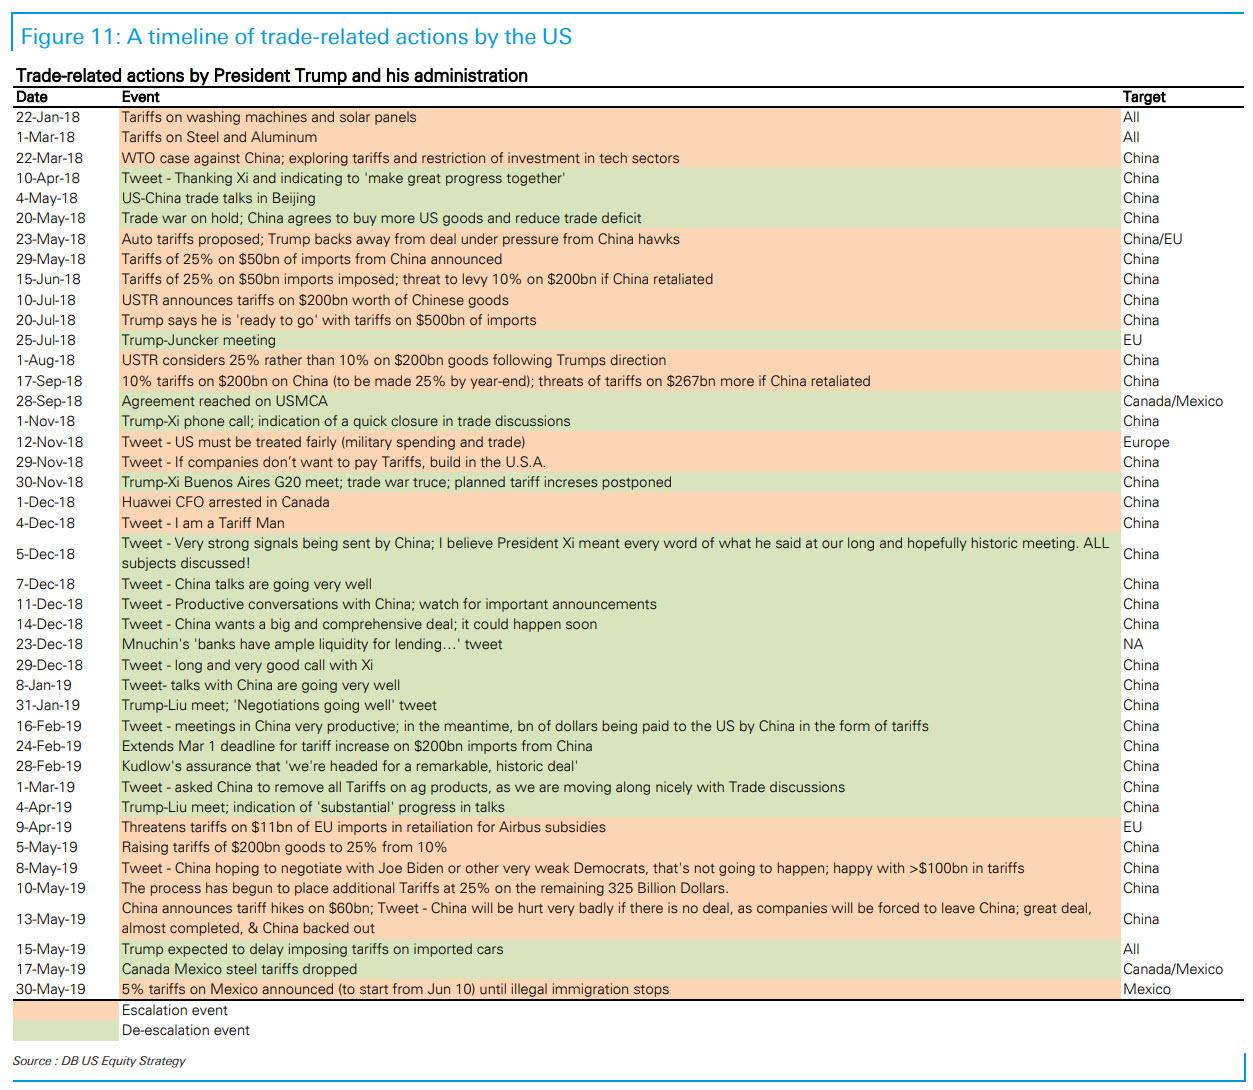
Appendix A: a history of trade-related escalations and de-escalations by the White House.
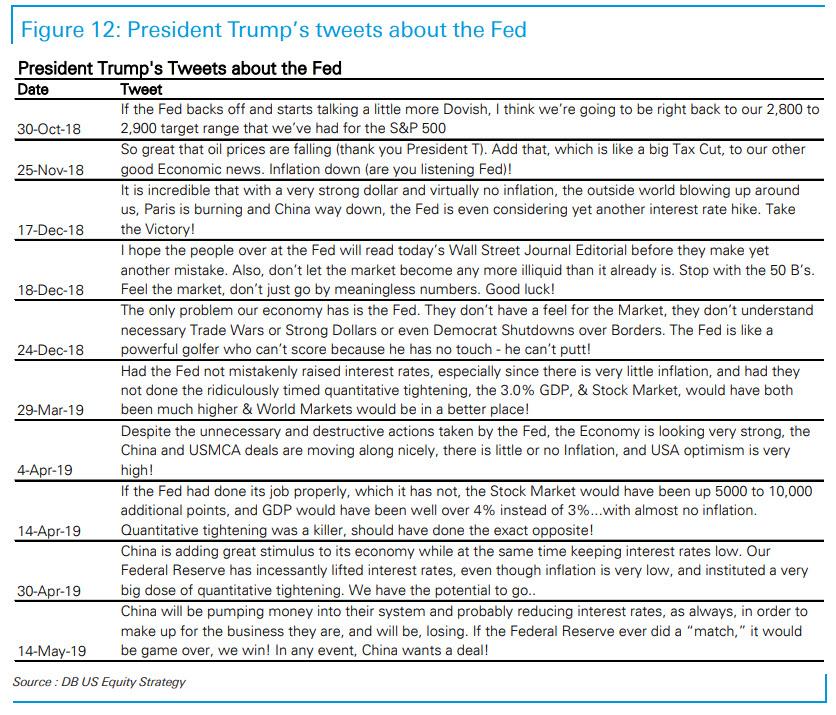
Appendix B: a history of Fed-related Trump tweets.
via ZeroHedge News http://bit.ly/2X9KlUq Tyler Durden