While Deutsche Bank’s Aleksandar Kocic already made the argument that the US economy finds itself in an odd “quantum superposition” state, where like Schordinger’s Cat, it is both booming and headed for a recession, one can make a similar argument about two other key aspect of capital markets: stocks and liquidity.
While global equity markets have surged in 2019, rebounding strongly from their 2018 sell-off and the more recent slump in May, SocGen’s Andy Lapthorne reminds us that stocks, too, now exist in two separate worlds: consider that while the overall MSCI World index has added 6.5% in June – its best month in decades – and is up 15.6% in 2019 with most markets doing well, “it is worth reminding ourselves that apart from the US, Hong Kong, Finland and Switzerland, the remaining MSCI indices in USD terms are still well below their January 2018 highs.”
However, even more important than the geographic breakdown of performance is a divergence that the SocGen strategist observes in terms of company size, and specifically how it affects both company returns and liquidity.
As Lapthorne writes in a Monday note, “there have been quite a few headlines recently surrounding “liquidity issues,” which he finds surprising given the strong performance of asset markets this year:
“That investors flee at the first sign of a problem appears to confirm that investors are shuffling towards the exit door, in anticipation of a need to leave the party in haste.”
But, as he adds, there are other dynamics in play.
First and foremost, Lapthorne brings attention to a key barometer he watches, which is equal-weighted versus market cap-weighted performance, because “Not only as many our quant models tilted towards an equal-weighted structure, but it is clearly healthier for the majority to be outperforming the more concentrated large cap-tilted index and of course passive and associated top-down flows favour market cap rather than equal-weighted ones.”
What is worrying, is that as in 2018, so again this year, the MSCI World equal-weighted index has slumped versus the more closely watch market cap index. In other words, a majority of companies are struggling.
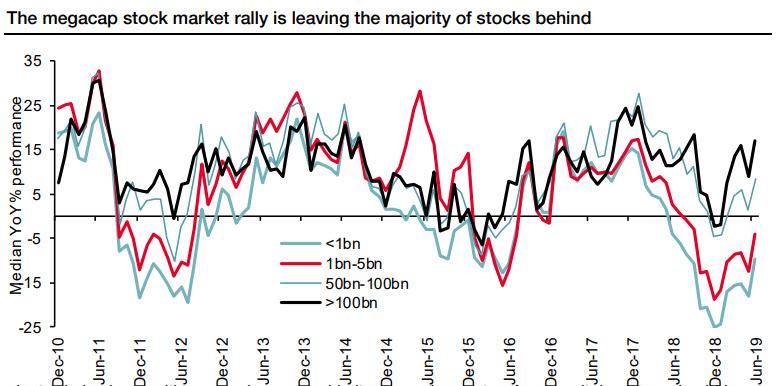
And here a remarkable observation: pointing out the divergences shown in the chart below, which splits the global universe of 17,000 stocks into market-cap grouped portfolios and measures their median annual performance over the last 12 months, the SocGen strategist notes that the megacap group (those companies with a market cap above $100BN) is powering ahead while those small-caps in the sub-$1BN market cap range “are still struggling to make back last year’s loss.”
What is even more remarkable is that this $100BN portfolio represents just 77 companies but 27% of the global market cap. Meanwhile the sub $1BN universe represents just 7% of the market capitalisation yet contained over 11,000 companies, or 65% of total numbers!
This, to SocGen, is the problem: “our increasing focus on a few large cap indices populated by just a fraction of the world’s companies is giving investors a false impression.”
Lapthorne’s conclusion: “Corporates are struggling“, but since confirmation bias – both structural and that in traders’ heads – only looks at those names that keep on levitating and pushing the S&P to new record highs, expect conventional wisdom to be firmly grounded in the belief that this is a bull market for everyone… not just a handful of companies which dominate the stock market with their gargantuan market cap.
via ZeroHedge News https://ift.tt/2JkWDjO Tyler Durden
