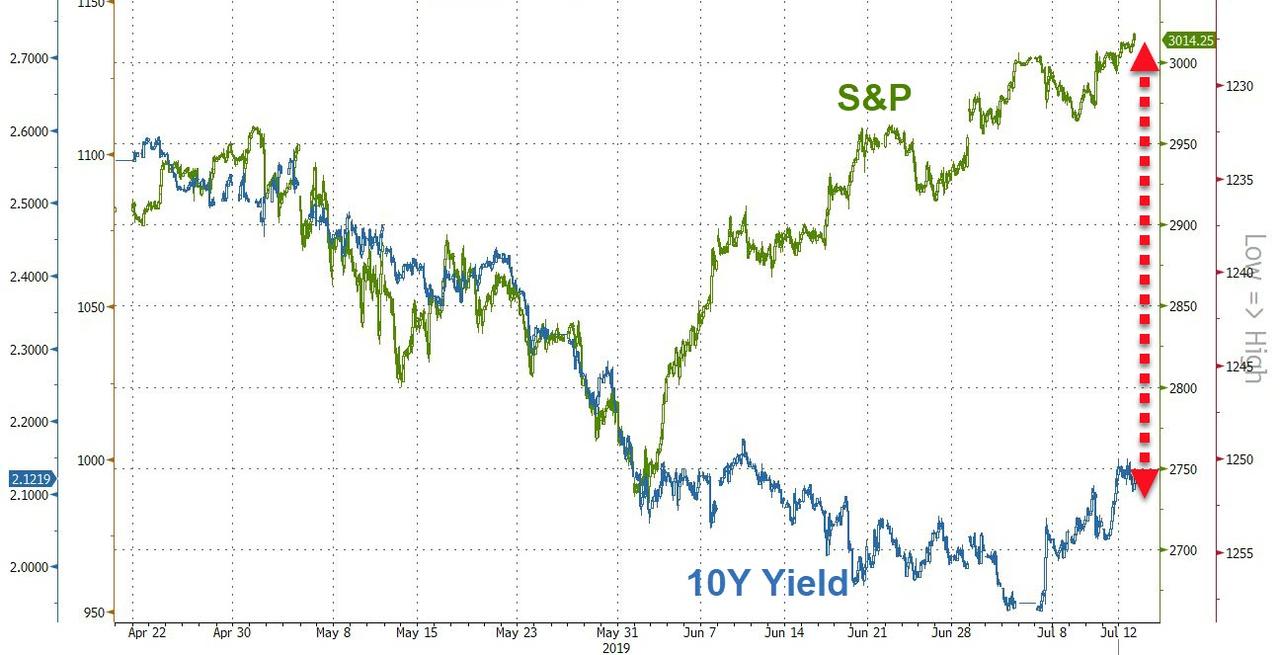
Last week, we observed that for stocks, it was once again a return to the most important question of 2019, namely “Why Do Stocks Keep Going Up“, at a time when tumbling bond yields continue to scream a recession is imminent…
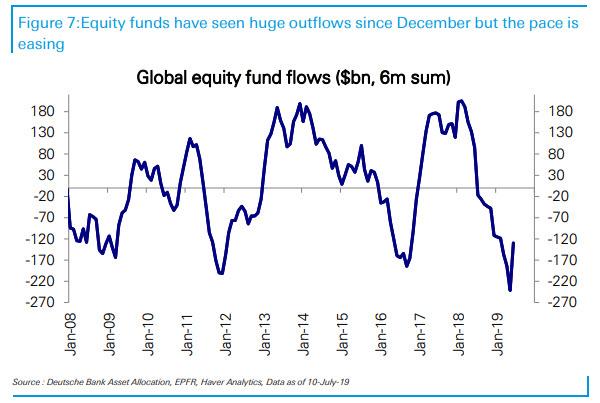
… when outflows from equity funds have never been greater…
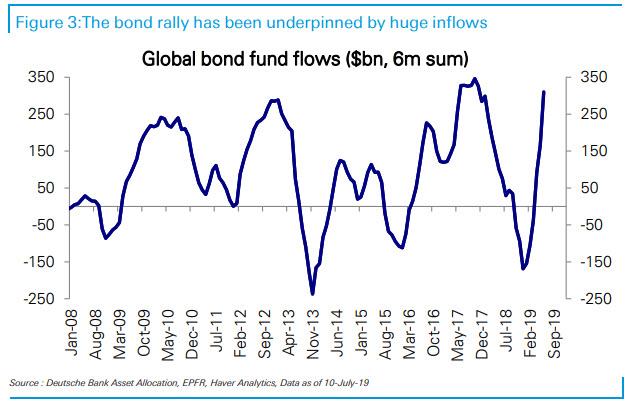
… and when inflow to bond funds are the highest on record.
The answer, as DB’s Parag Thatte explained last week, is that “buybacks have been the most important driver of S&P 500 price increases during this cycle” running at over $200bn a quarter (gross) over the last year, and while announcements remain noisy, “they do not suggest a slowing yet.” The level of corporate earnings is the primary driver of buybacks. Earnings have been flat this year and are on track to be down slightly in Q2. But absent a large decline, companies are likely to maintain the pace of buybacks, as they did in the previous earnings slowdowns in 2011-2012 and 2015-2016.
And yet, while we know the main answer to who is the biggest source of market upside in 2019, that’s not the only answer.
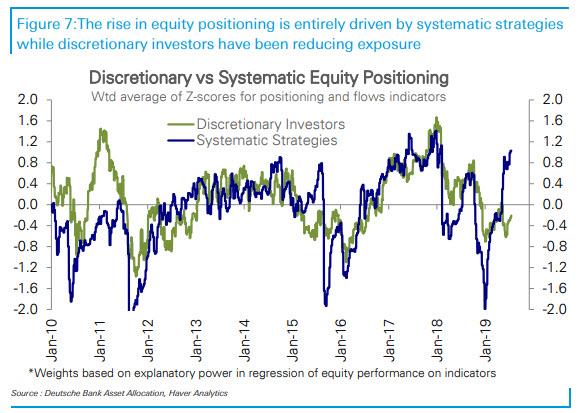
In a follow up to last week’s flows analysis from Thatte, the Deutsche Banker notes that whereas discretionary investors have been cutting equity positioning as growth has slowed…
… systematic strategy allocations – i.e., quants (sometimes also called “robots”) and the like – have been marching higher. To evaluate how various investor classes have been approaching markets, Thatte divides his suite of equity positioning and flows indicators into those that track discretionary investors like long-short hedge funds, real money mutual funds and retail investors versus systematic strategy allocations for Vol Control, CTA and Risk Parity funds.
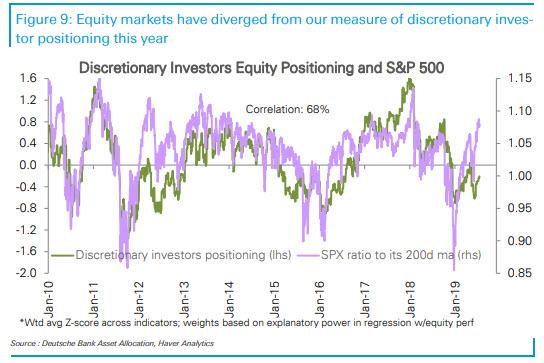
And here a very odd divergence has emerged: historically, positioning for both discretionary and systematic strategies have typically moved together and were highly correlated with growth indicators. This year however, discretionary investors have steadily reduced their exposure which is now below average, in line with their behavior historically when growth is slowing.
Meanwhile, as “humans” are selling, the robots are buying, and systematic strategies have rapidly raised their exposure; in fact, the gap between systematic (robots) and discretionary (humans) equity positioning is amongst the widest it has been in this cycle. This is best shown on the chart below.
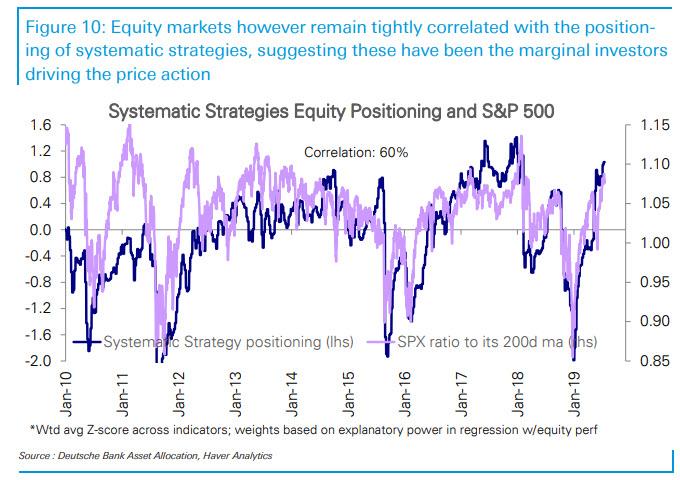
What does this mean: not only do broader markets track systematic rather than discretionary flows, but the marginal price setter is no longer of human (discretionary) origin, but rather robotic. As Thatte notes, equity markets have diverged from his measure of discretionary investor positioning this year, yet remain tightly correlated with those of systematic strategies, “suggesting the latter have been the marginal investors driving the price action.”
Meanwhile, as robots double down on going all in, discretionary investors – who are focusing far more on the signals sent by the recessionary bond market – are likely to lower equity exposure on further declines in growth, and unlikely to raise it until there are clear signs of a rebound.
A more granular breakdown of systematic positioning reveals the same patterns we observed last week: the “robots” are largely all-in, to wit:
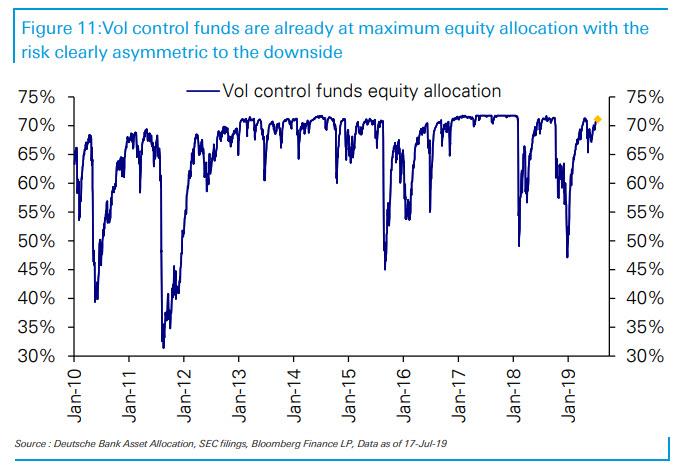
- Vol Control remain near max equity allocations and risk is asymmetric to the downside. SPX 1M realized vol has steadily fallen MTD and is near 2Y lows, while intraday price moves have remained less than 1%. Implied vol has also been subdued and range bound at 13%. Continued subdued volatility will probably not see a marginal bid from the Vol control funds. However, given the current earnings season and Fed meeting ahead, if higher implied volatility with bigger daily moves do materialize, VC funds will be the riskiest and prompted to mechanically reduce their equity exposure.
- CTAs have not seen any material changes to their S&P 500 allocations this week and remain near YTD highs. The spot came off its record high over the week, but medium and long term trendlines are holding steady and sizably cushioned from selling triggers of crossing averages. US Treasuries’ weekly gains helped the medium-term trends to stay on course and CTAs’ bond allocations on the heavier side of its multi-year range. Gold prices are at a 5Y peak, with both short and medium term trend followers likely increasing their exposures.

- Risk Parity equity allocations are unchanged near the top of their historical range. Muted equity volatility and falling bond volatility have increased RP asset allocations over the past couple of months. Recent drop in bond-equity correlation has been in line with a slight pickup in bonds’ exposure of the complex. Realized vol of the cross asset portfolio fell back to its historical median around 5, so de-risking is not likely unless volatility picks up significantly. Risk Parity managers have significant discretion but tend to move slower than the other systematic strategies.

This is bad news for the overall market, because systematic strategy exposure is already at the top of its historical range, suggesting limited room to raise it any further and offset cuts by discretionary investors. And since the biggest signal for systematic positioning is volatility – usually in circular fashion as the lower VIX drops, the higher the market rises, and so on – any upcoming increase in volatility will prompt a reduction in exposure, especially for vol control funds, which in turn will exacerbate a sell-off in equities, which are already being sold by discretionary investors.
Finally, besides a vol shock should the VIX spike higher forcing quants to delever and puke their holdings, how else can this unprecedented divergence converge? According to DB, risks in the near term include earnings season disappointments and potentially a re-escalation of the trade conflict as has often followed “record highs” and a ramp up of pressure on the Fed.
via ZeroHedge News https://ift.tt/2Lyz2zW Tyler Durden
