This Is The Best Performing Asset Of The Past Decade… And Other Remarkable “Best” And “Worsts”
It’s almost time for the month-end, year-end and, yes, decade-end retrospectives from various investment banks.
To start us off, here is an excerpt from the latest “Flow Show” from BofA’s Michael Hartnett, who in addition to pointing out that this week in which the S&P hit another new all time high, $1.7 billion was pulled out of equities while $9.1 billion flowed into bonds, confirming that once again the stock market levitated entirely on the back of Apple’s non-stop stock buybacks as mom and pop were selling, lays out the following decade-long walk down memory lane.
And so, without further ado, here is “2010s did you know…”
-
Central banks: most activist…Brazil (25 cuts, 24 hikes); least activist…Japan (1 cut, 0 hikes).
-
Population growth: most…India +149 million since 2010; least…Syria -4 million since 2010.
-
US jobs: in the 2000s US economy lost net 1 million jobs; in the 2010s US economy created net 22.4 million jobs.
-
Negative yielding debt: $0 of bonds were negative yielding in 2010 vs. $17 trillion at peak in 2019.
-
Government bonds: best…30-year Treasury $1 in 2010 = $2.08 today; worst… Turkey govt $1 in 2010 = $0.61 today.
-
Equities: best…US equities $1 in 2010 = $3.46 today; worst…Greece $1 in 2010 = $0.07 today.
A little something for the goldbugs:
- Commodities: best…gold $1 in 2010 = $1.34 today; worst…oil $1 in 2010 = $0.74 today.
And last but not least:
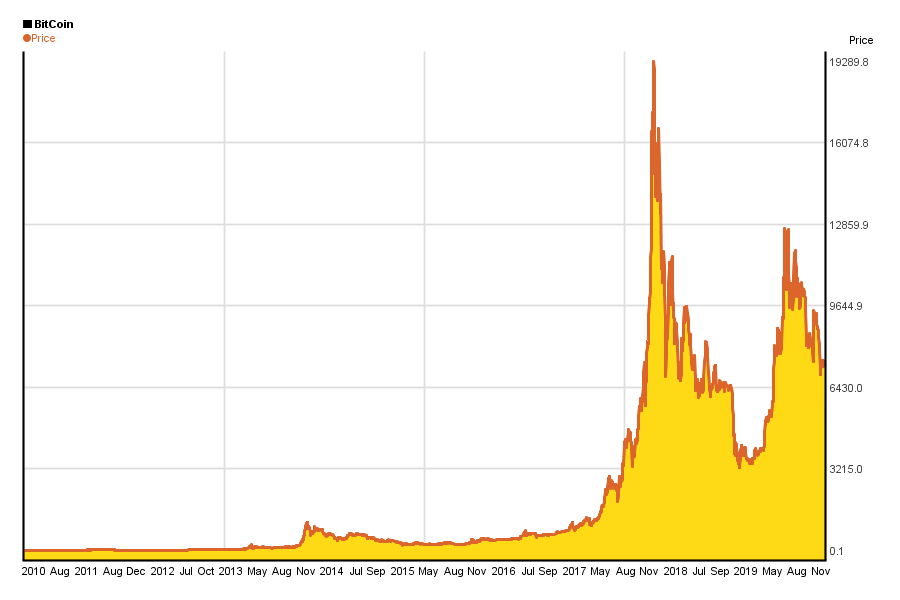
- Asset class: best…Bitcoin $1 in 2010 = $90,026 today; worst…Myanmar Kyat $1 in 2010 = $0.004 (spot) today.
Tyler Durden
Sat, 12/14/2019 – 12:00
via ZeroHedge News https://ift.tt/36AY9Zb Tyler Durden
