US Freight Shipments Fall Below 2014 Level. Answers Emerge
Authored by Wolf Richter via WolfStreet.com,
It’s not the consumer.
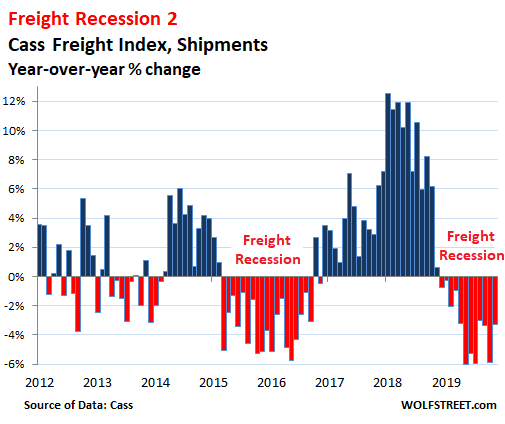
Freight shipment volume in the US by truck, rail, air, and barge of consumer and industrial goods but not bulk commodities declined 3.3% in November from a year ago, the 12th month in a row of year-over-year declines, according to the Cass Freight Index for Shipments. This follows a huge boom in shipments through much of 2018, but by November last year, that boom was already fizzling, and by December last year, shipments declined on a year-over-year basis for the first time since the last freight recession. Note the infamous boom-and-bust cycles of the business:
The Cass Freight Index tracks shipment volume of consumer goods, industrial products such as construction materials, equipment and components being shipped to or by manufacturers, supplies and equipment for oil & gas drilling, and many other things. But it does not track bulk commodities, such as grains. Cass derives the data from actual freight invoices paid on behalf of its clients ($28 billion in 2018).
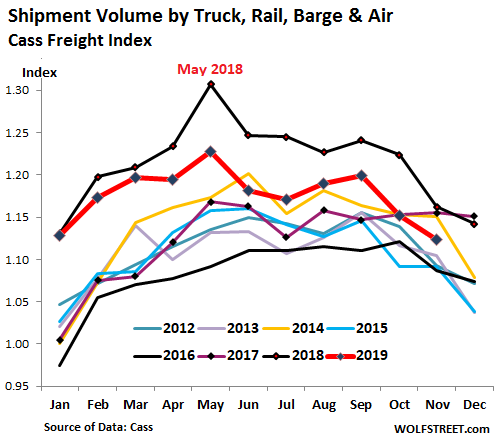
The boom levels last year had been stimulated by pandemic efforts all around to front-run the tariffs by loading up on merchandise. But November’s drop in shipment volume didn’t just put the index below November last year, but also below 2017 levels and 2014 levels and nudged it closer to the lows of the 2015 and 2016 freight recession.
In the stacked chart below – note the seasonality of the business – the red line represents the index for 2019. The top black line represents 2018, the purple line 2017, and the yellow line 2014:
Freight expenditures tick down but remain high.
Declining demand for transportation services, as seen in the drop in shipment volume, has started to put pressure on some freight rates, such as in trucking. But FedEx, UPS, and other freight companies have raised their rates, as ecommerce is booming. And many contracts were negotiated near the peak last year. So despite the declining shipment volume, freight expenditures – a function of shipment volume and freight rates – remain historically high.
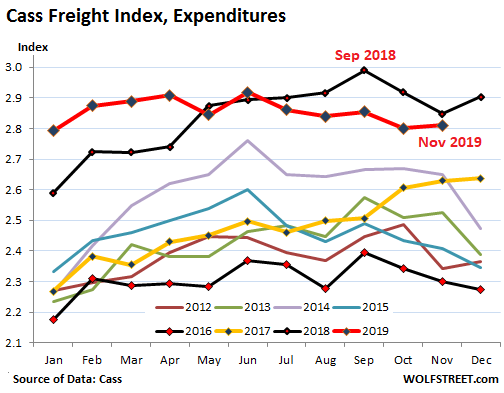
The total amount that shippers, such as manufacturers, retailers, or industrial companies, spent on freight by all modes of transportation – rail, truck, air, and barge – declined for the fifth month in a row, down 1.4% in November compared to a year ago, but was the second highest for any November.
Just how powerful the surge in freight expenditures was last year – on high volume and high rates – becomes obvious in the stacked chart below. The top black line denotes 2018. The yellow line denotes 2017. For most of last year, freight expenditures completely blew past any prior record and peaked in September 2018 with a year-over-year surge of 19%, that then began to fizzle:
Where does the decline in shipment volume come from?
Retail sales are fine, powered by ecommerce. Retail sales in November rose 3.1% from November last year. Not red-hot growth, but solid growth. Brick-and-mortar retail sales continue to get crushed, but ecommerce is growing at a red-hot pace, and the speed with which it is gaining share appears to be picking up. All these goods need to be shipped from the port of entry or from the manufacturer in the US across the fulfillment infrastructure to the consumer.
The industrial economy is weak. Industrial production – which includes manufacturing, oil & gas drilling, mining activities, and utilities – had boomed in late 2017 and 2018 as companies were front-running the tariffs. Year-over-year growth rates topped out at 5.5%, the fastest growth since the recovery from the Great Recession. But it peaked in December 2018, then started declining. The month-to-month drop was particularly sharp in October, according to Federal Reserve data. This was followed by a big month-to-month bounce in November, leaving year-over-year industrial production down just 0.8%.
Manufacturing – which is within industrial production – declined 0.7% year-over-year. These are obviously not large declines. In late 2015, during the worst of the Oil Bust, manufacturing production had declined 2.0% year-over-year. During the peak of the financial Crisis, it plunged 18%.
Construction spending ticked up 1.1% in November, from low levels a year earlier, according to the Commerce Department. In dollar terms, construction spending remains down about 3% from the first half in 2018.
The Oil-and-Gas-Bust Factor.
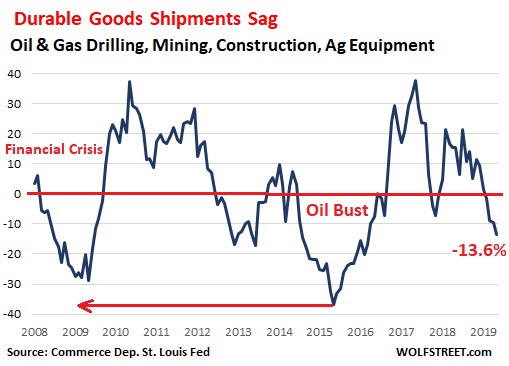
For more granularity, we’ll look at durable goods shipments – which include anything from washing machines (knock on wood in term of “durable”) to industrial equipment. Durable goods shipments in November fell 1.5% year-over-year.
But within that group, shipments of machinery and equipment for agriculture, construction, and mining, which is dominated by equipment for shale oil-and-gas drilling, plunged 13.6% year-over-year. During the peak of the Oil Bust in late 2015 and early 2016, shipments of equipment to these sectors plunged by as much as 37% year-over-year, much worse than the plunge during the Financial Crisis when they’d bottomed out at -29%. This is how important the oil-and-gas sector has become to US industry.
While other industrial segments may be trying to scramble out of the decline, the oil-and-gas drilling industry is forced to cut back on purchasing equipment and machinery as money is drying up. Investors in these companies, which need much higher oil prices to be cash-flow-positive, are grappling with another existential crisis.
In 2019 so far, about three dozen oil-and-gas drillers have filed for bankruptcy. Other drillers, such as Chesapeake Energy, are jostling for position at the filing counter. They’re leaving investors exposed to heavy losses, including billionaires who thought they’d picked the bottom in 2016.
* * *
Tyler Durden
Sat, 12/21/2019 – 13:30
via ZeroHedge News https://ift.tt/2ZerhDh Tyler Durden


