SocGen Makes A Striking Discovery: For More Than Half The Market, It Already Feels Like A Recession
One week ago, Morgan Stanley brought the market’s attention to the “other one percent”, namely that handful of companies which have been responsible for the vast majority of market gains and market upside not only in 2019 but for much of the past decade. As the bank’s chief equity strategist, Michael Wilson wrote, in a world of low growth, limited pricing power and now rising costs, “it’s clear that bigger is better and scale matters” which is also the main reason why Morgan Stanley has been underweight US small caps since July 2018, a relative trade that is now up close to 20%.
As Wilson explained, small-cap companies can’t offset rising labor costs with technology as easily as large caps, nor do they have the same access to the record-low cost of capital. Additionally, rising regulatory and cyber costs over the past decade also favor larger-cap companies, who can spread such costs across a larger revenue base. “In short”, Wilson summarized, “the big get bigger as they continue to eat the small guy’s lunch” and added that this trend “is unsustainable and potentially a bigger risk to the economy and markets than the very important issue of individual income inequality.“
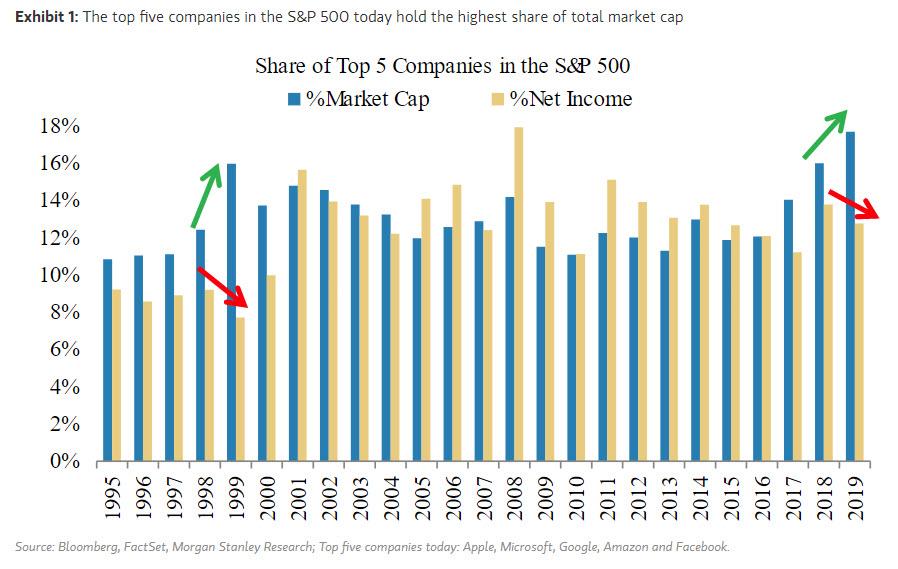
Of course, markets are fully aware of this dynamic, which is why small caps have underperformed so significantly over the past 18 months and, worse, over this entire cycle. But this phenomenon is manifesting itself in other ways: as the chart below shows, capital concentration is following corporate inequality like never before, and currently, the top five companies in the S&P 500 (the “other 1 percenters”) make up 18% of the total market cap.
“A ratio like this is unprecedented, including during the tech bubble”, Wilson concluded ominously, especially since we all know remember how the tech bubble ended. And yet, little has changed since the day right before the burst: during 2019, the net income concentration for the 1 percenters didn’t keep pace with their market cap concentration, similar to what happened during the 1999 concentration peak.
Wilson was also not shy assigning blame, and giving his view on what caused this unprecedented divergence:
I think this divergence is the result of the extraordinary liquidity being provided by the world’s central banks, which is flowing to the most liquid and largest names in the S&P 500. This also recalls 1999, when the Fed expanded its balance sheet at the end of the year and early in 2000 as a precaution against Y2K disruption.
Today, picking up on this topic of the “Other one percent” versus everyone else, SocGen’s quant team lead by Andrew Lapthorne presents a series of charts which add further arguments to the debate that the unprecedented divergence between a handful of companies and the rest of the market will end in disaster.
Lapthorne, who earlier today asked the $64 trillion question, “How Long Investors Will Ignore Record Valuations And Weak EPS” and whose answer may determine the fate of the stock market in 2020 (and onward), laid out the current market dynamic as follows:
The big change during 2019 was a significant rise in equity prices on the back of the Fed’s policy reversals at the start of the year, so whilst economic indicators, profits and bond yields continued to fall, equity markets ignored the fundamentals and charged ahead, finishing the year with a “not-QE” boost which benefited Growth stocks in particular.
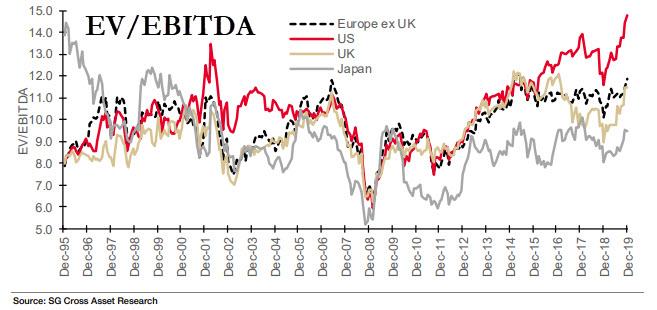
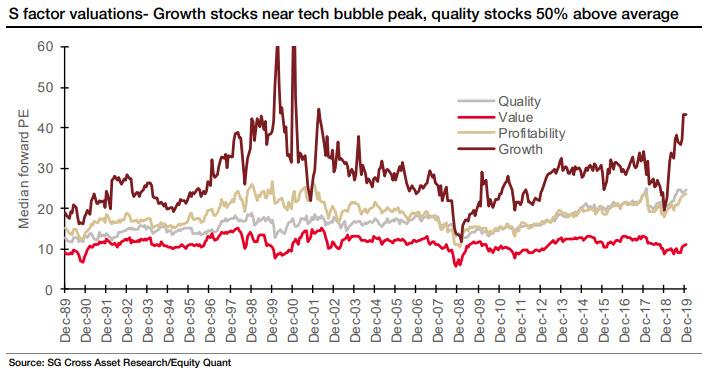
This has left investors feeling bullish but also carrying incredible valuation problems and high expectations into 2020. The real yield on a global balanced portfolio hit 0% before any costs are deducted, US stocks hit all-time highs on an EV/EBITDA basis, bond proxies remain highly exposed to a higher bond yield and therefore improving economic sentiment, and growth stocks have hit valuation levels last seen at the peak of the late nineties tech boom. Even Value stocks – having rallied strongly in Q3 – are no longer ‘cheap’ in places like the US.
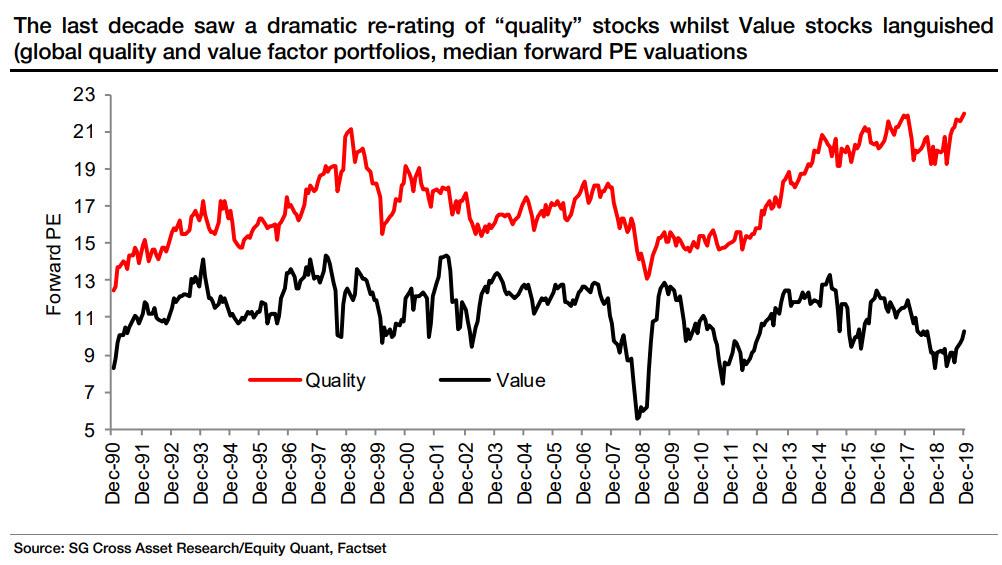
With that in mind, and we will shortly show charts to reinforce Lapthorne’s points, we proceed to the first point which the SocGen quant team makes, namely that the equity story of the last decade has been “the re-rating of the quality factor” (well they are a quant team so yes), a factor barely mentioned prior to the financial crisis.
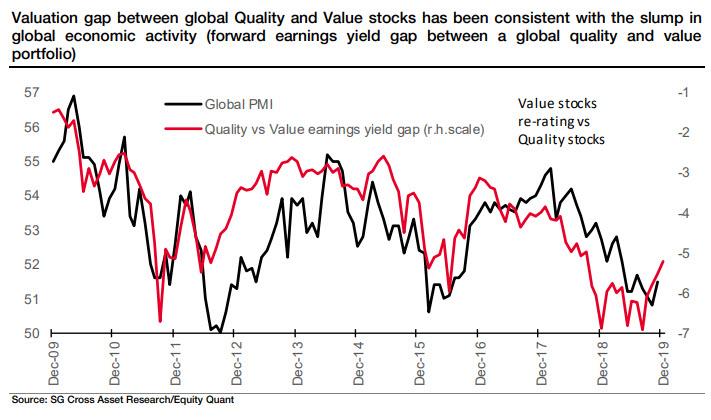
In retrospect, this divergence probably should not be a surprise as the valuation discrepancy is in line with the drop in global economic activity with the valuation gap tracking global PMIs lower; add to this valuation risk if economic sentiment improves and one may reasonably ask why value has “only” dropped this muchL
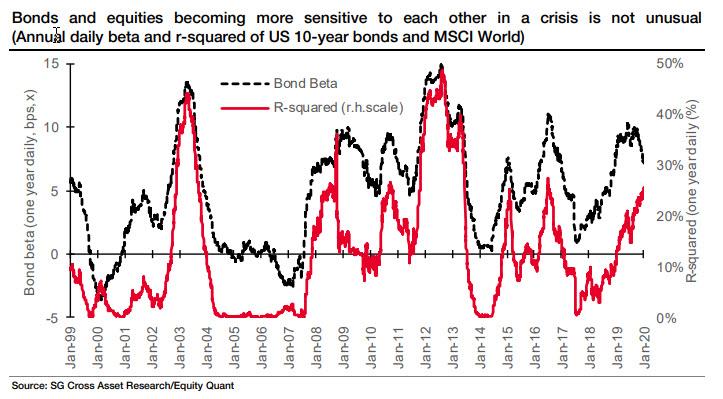
Stepping away from the realm of factor investing, SocGen then looks at relative returns of bonds and stocks and points out that although bonds and equities remain negatively correlated on a day to day basis, this doesn’t prevent them from both making money at the same time, which they clearly have done in the past year when both bonds and stocks outperformed.
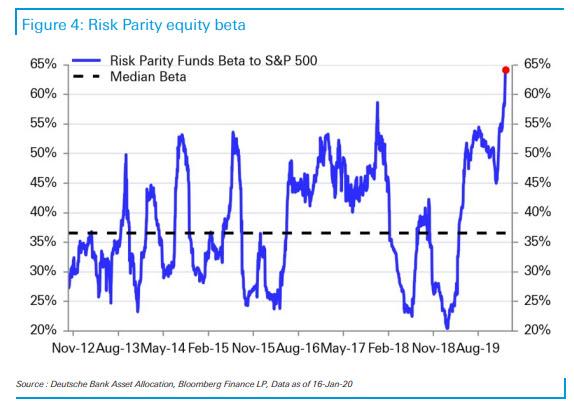
Hence the appeal of risk parity time strategies historically, and why ina world of near record low volumes, risk-parity funds are now the most all in they have ever been.
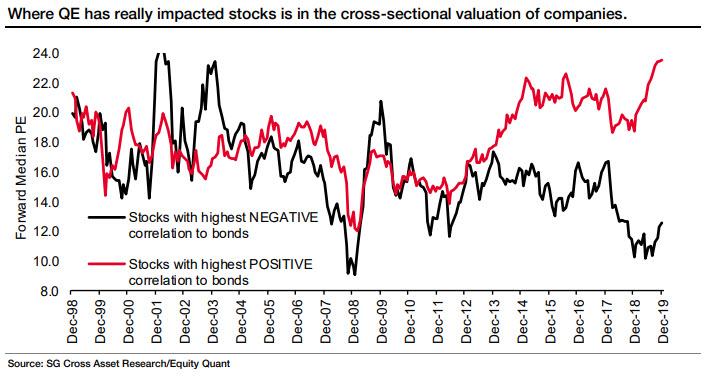
And since QE is fundamentally a mechanism to boost bond prices, it is also hardly surprising that stocks with the highest positive correlation to bonds have massively outperformed those that have had a negative correlation. As Lapthorne notes, “this valuation gap represents a major challenge to stock pickers. In a recovery, with rising bond yield this gap could narrow quickly. However, the assumption that the red-line will benefit if bond yield went lower in a recession is misplaced. Even “safer” stocks fall in a bear market and the valuation risk, might compound the declines.”
Which brings us to the report’s punchline, namely valuations and its assorted cross-sections.
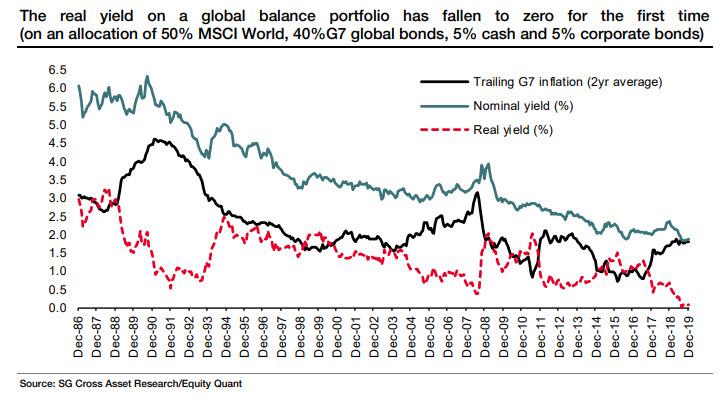
Here, the first thing to note is that after tremendous gains for both stocks and bonds in 2019, the real yield on a global balanced portfolio has fallen to zero for the first time ever (and his is before costs)!
So will balanced yields go negative next? Well, nothing is impossible, but there is probably a limit: after all the striking stock price gains last year in the absence of profit growth have left equity valuations “seriously extended”, and as a result of continued massive re-leveraging, particularly in the US, has left US equities trading at record high EV/EBITDA valuations!
As noted above this has been mostly due to “growth” stocks, which have exploded higher in the past year, with their forward PE multiples not seen outside of the 2000 tech bubble. As a result, with both Quality and Growth stocks extremely expensive by historical standards and Value stocks having now rallied back to average valuations, Lapthorne concludes that “there is no obvious long only factor strategy in the US that stands out as attractive.”
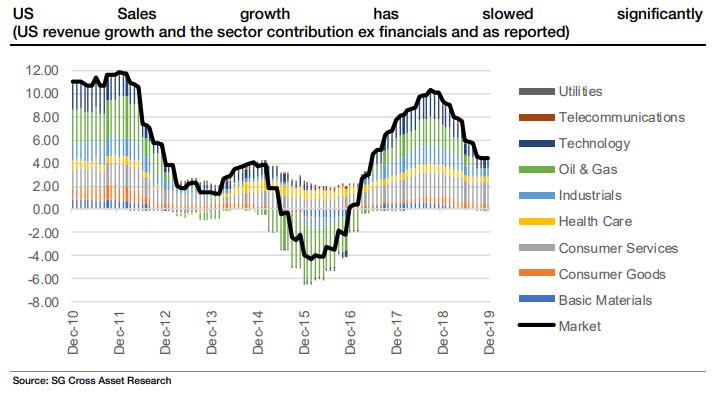
Is this price surge justified by anything other than central bank easing and stock buybacks? Why, of course not, and here are the facts: both revenues (which as SocGen points out peaked and started to slump around the time equity prices dropped in 2018, and while stocks later rebounded in 2019, sales growth has continued its decline)…
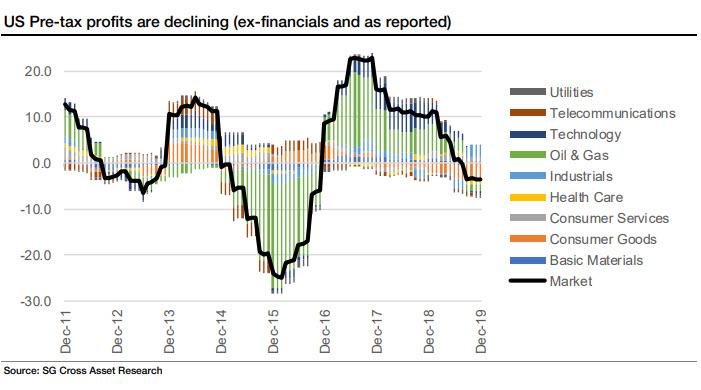
… and pre-tax profits have been declining for the past several years, and while revenues still are fractionally in the green, profits are now declining year over year.
Commenting on these deteriorating trends, Lapthorne writes that “profits are declining and non-financial sales growth has fallen from 10%+ territory to around 4% per annum in the US. With costs rising faster than sales, margins are under pressure. Either sales growth must pick up or costs need to be cut to avoid negative.“
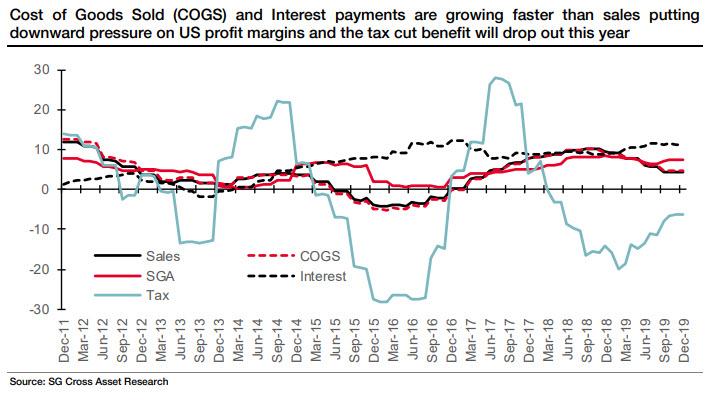
What is even scarier, and is why investors are paying particularly close attention to Q4 earnings season, is that a breakdown of US P&L shows interest costs and SGA expenses rising quicker than sales growth, putting downward pressure on margins. Meanwhile, the Trump tax benefit tailwind is likely to disappear this year, putting even more pressure on net income.
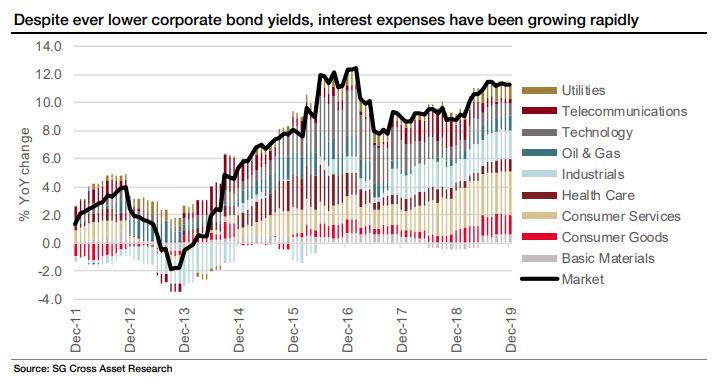
Scariest of all, however, is that despite near-record low interest rates, corporate interest expense has been rising steadily (as a result of the record stock of corporate debt), and any sudden spike in interest rate would quickly lead to a cash flow crisis as a disproportionately higher amount of cash from operations would go to paying down interest expense.
Which brings us to SocGen’s own take on “the other one percent” problem.
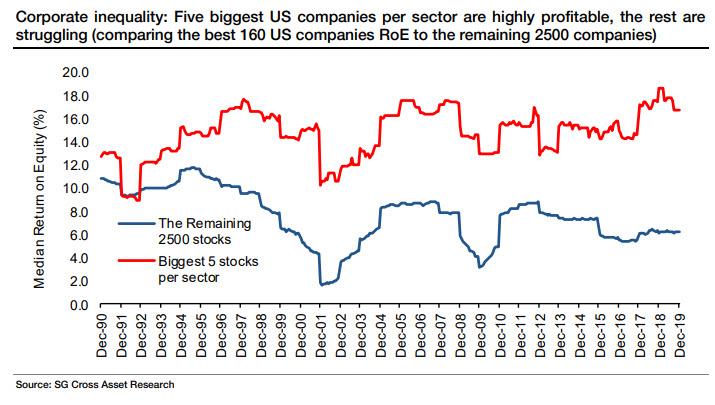
First, here is a chart measuring the biggest 160 US companies (top 5 in each sector by sales) versus all other stocks in the US. The gap between the biggest and the rest has never been bigger. Or, as SocGen puts it, “the five biggest US companies per sector are highly profitable, the rest are struggling (comparing the best 160 US companies RoE to the remaining 2500 companies).“
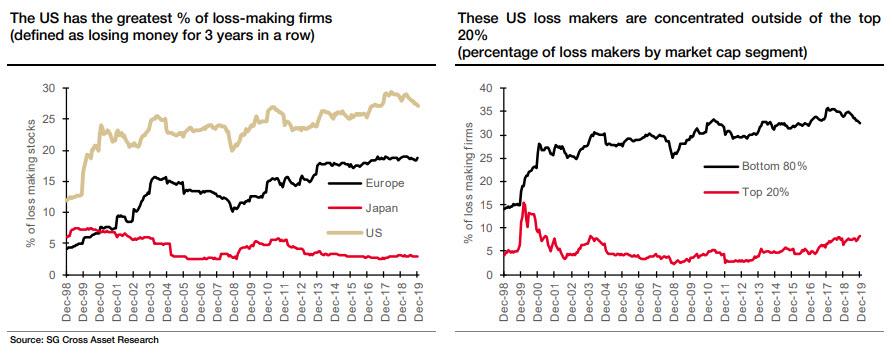
Curiously, this problem is especially acute in the US, which not only has the greatest percentage of loss making firms, but as one would expect, the bulk of the money-losing companies are concentrated outside the top 20%.
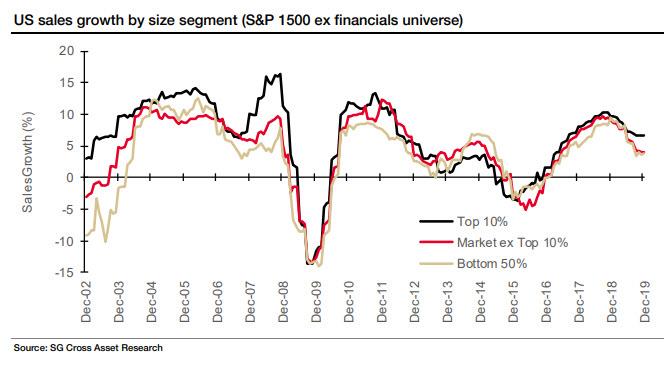
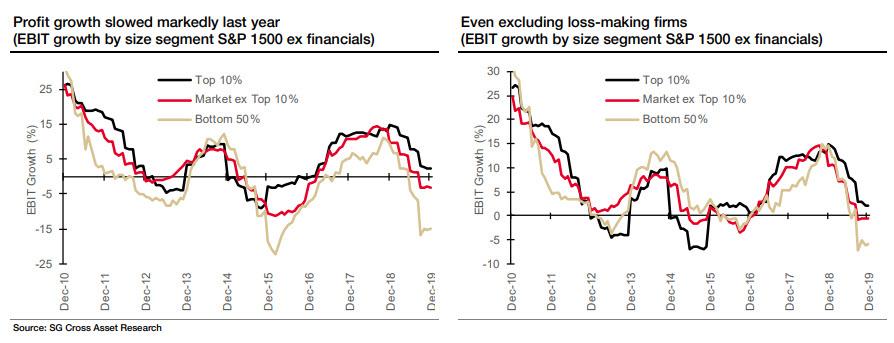
Surprisingly, this divergence is not so much a function of revenue growth or lack thereof, but an inability to absorb surging costs. As the next chart show, revenue growth is relatively stable for all corporate size groupings, which suggests that depressed profits are mostly a function of rising costs and SG&A, which smaller companies are unable to pass on to customers.
Sure enough, extending this analysis to the bottom line shows that EBIT for the bottom 50% of the S&P1500 (ex fins) is now the most negative it has been since the financial crisis!
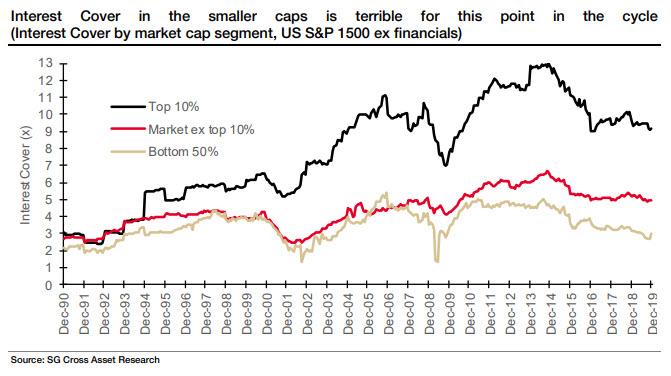
Naturally, with reduced (or negative) profitability comes, lower (or negative) cash flow, and the result is that while the biggest companies enjoy a generous interest coverage cushion (EBITDA/Interest expense), coverage for the bottom 50% of all US companies in the S&P1500 ex fins is “terrible“, according to Lapthorne, who adds that “Either a rise in interest rates or a fall in profits will be damaging from here for the smaller half of the US market.”
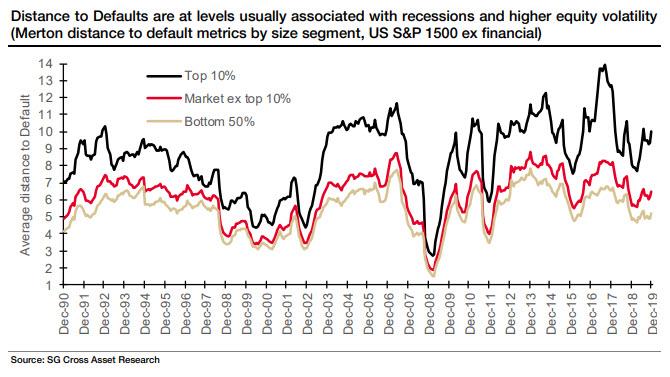
The bottom line is simple: sliding revenues, an inability to pass on costs for more than half the stocks in the market, resulting in negative profits and sliding interest coverage, means that, as SocGen warns, the Merton “Distance to Default” is now at levels usually associated with recessions and much higher equity volatility. And as Lapthorne cautions in his parting words, “to see distance to default at recessionary levels, despite high equity prices and subdued equity volatility, leaves little room for either a rise in volatility or a fall in equity prices as investors found out in Q4 2018.“
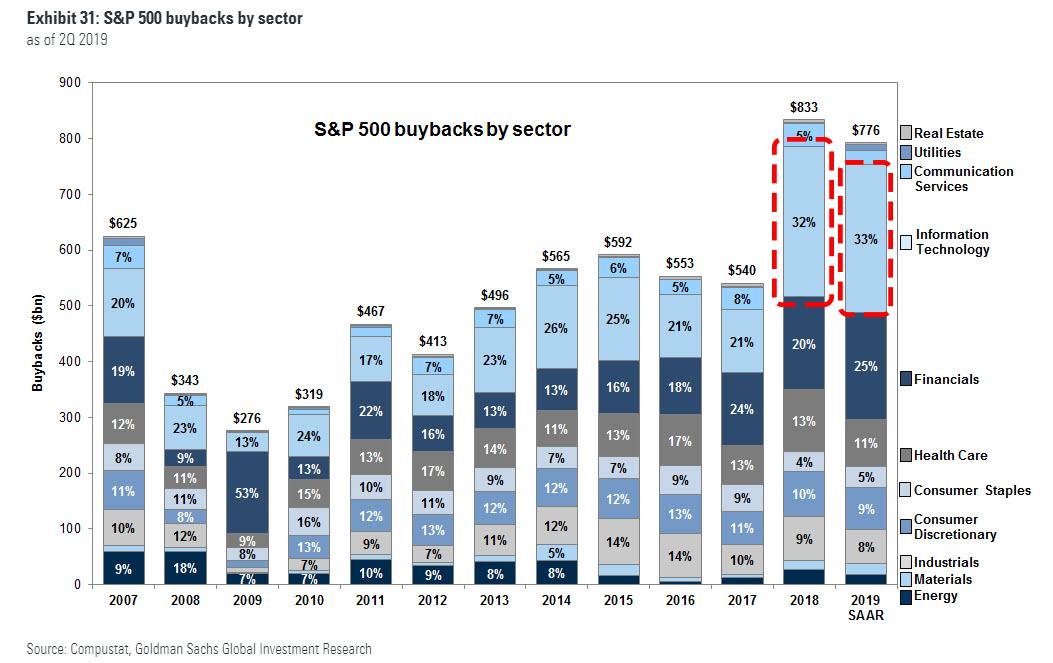
Between Morgan Stanley and SocGen’s analysis on “corporate inequality” and “the other one percent“, the conclusion is that the entire S&P500 is now increasingly a reflection of the fundamentals and returns of a handful of gigantic tech companies, which have been ravenously repurchasing their shares for the past two years courtesy of Trump’s tax reform which allowed them to repatriate over a trillion in cash and use it to fund stock buybacks, and whose growth has attracted the bulk of new outside capital over the past year creating a virtuous loop.
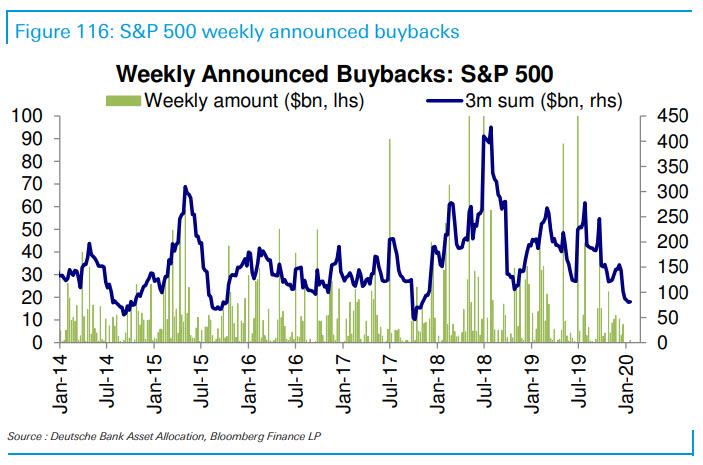
Yet even as the market melts up and giddy investors go all in, seemingly without a care in the world, the biggest buyer of stocks in the past decade, corporations themselves, has quietly stepped back from its furious pace of stock buybacks, and as we showed yesterday, weekly announced buybacks are now running at the lowest in almost three years.
Is the party almost over?
Tyler Durden
Mon, 01/20/2020 – 17:10
via ZeroHedge News https://ift.tt/2G6V3AZ Tyler Durden
