Morgan Stanley: Positioning Is In The “Bad” Camp And Drifting Towards “Ugly”
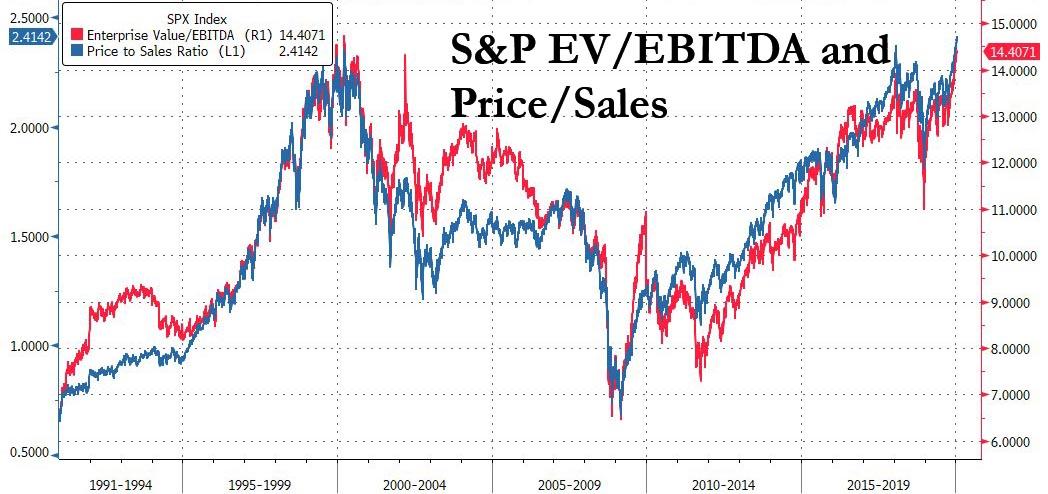
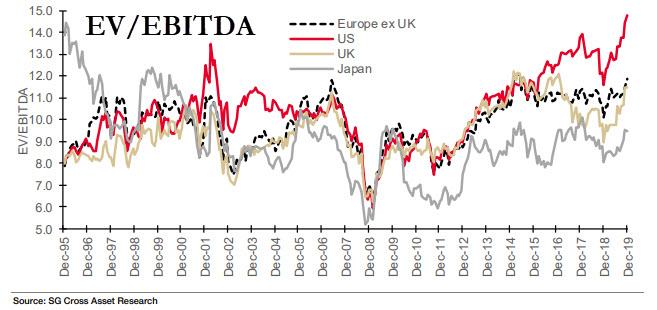
As we have remarked again and again over the past two weeks, and again today, investors are so “all in” stocks that some have suggested the unidirectional positioning could soon become a systemic risk, because not only are assets the most overvalued in history…
… surpassing even the dot com bubble on an EV/EBITDA basis.
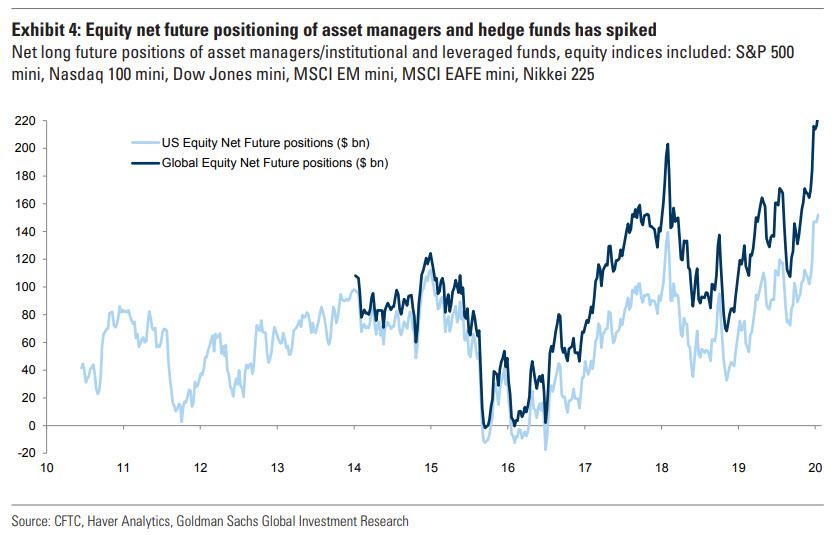
… but with everyone on the same side of the trade at near record leverage…
… a sell-off catalyst could result in an unprecedented forced liqudation, one that would be worse than the one experienced in January 2018. In fact, as Morgan Stanley’s head of Quant and Derivative Strategies (QDS), Chris Metli, writes today “positioning is definitely in the ‘Bad’ camp and drifting towards ‘Ugly’.”
So, in addition to our numerous posts on the topic, below is a list of the things that QDS is watching, and as the Morgan Stanley director adds, “there is a decidedly negative bias to the list.”
First, as Metli points out, for the list of datapoints below to matter, there has to be a catalyst. As Mike Wilson said in his latest note Weekly Warm Up, “this is unsustainable, but in the absence of a meaningful catalyst, it can also continue which is how liquidity driven bull markets often trade – they go on for longer and further than most expect.”
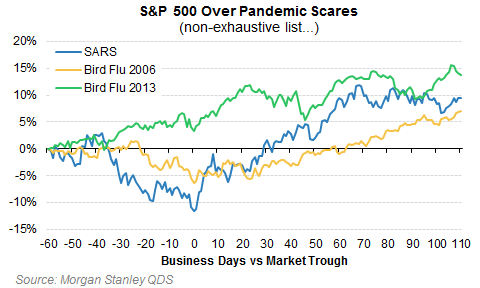
So maybe coronavirus is that catalyst?
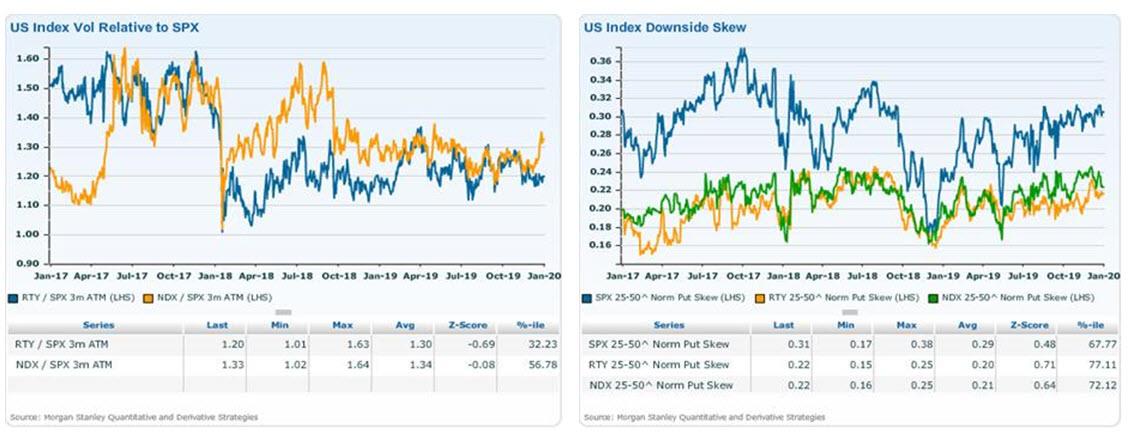
As Morgan Stanley points out, SARS and Bird Flu had only temporary equity market impacts in the past, and the market may need something a little more fundamental (or the impact to get much worse) to get scared. But with positioning where it is, the downside momentum can be sharp if sentiment changes. As hedges here QDS likes IWM put spreads and QQQ put spread collars given relatively cheaper vol in small caps but richening vol on NDX.
And while the experts are still out on whether or not China has triggered a real-life episode of “Outbreak”, here are the datapoints QDS is watching:
The single-name options market is looking a little frothy as investors increasingly position for upside – the spread between premium spent on calls and puts over the last month reached levels last seen in early Feb 2018 and late Sept 2018 – dates that preceded sharp market pullbacks. It also means that the VIX is now rising because of call buying!
For S&P 500 options the dynamics are also becoming increasingly worrisome. The correlation between the S&P 500 price and implied volatility is rising, which typically occurs during strong melt-ups and can be a negative sign for future returns. Current correlation levels are in the ~85th %ile, which typically precedes below-average but not outright negative returns. And looking at option prices directly, upside skew has fallen to the 40th %ile (flatter skew = more demand for calls) but this is still a far cry from January 2018 flatness.
Option expiry just passed last Friday, and overwriters had to roll up and out calls they had previously sold, which typically creates delta to buy in an up market. Any demand that may have generated over the past week will be not be material for another few weeks.
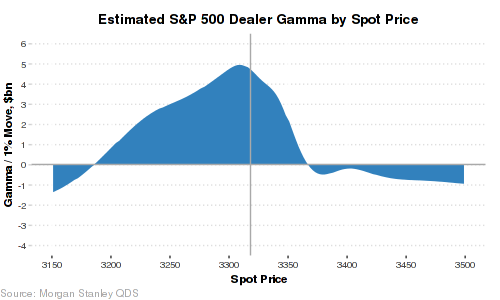
- Dealers are long gamma, providing significant downside support of several billion of demand per 1% selloff.
- Systematic leverage is high – Vol Target Fund leverage is in the 81st %ile and equity CTA leverage is in the 78th %ile. On a down 5% move in the S&P 500 these investors would have to sell $110bn of equity over the subsequent week – approaching the $125 to $145bn in supply that such a shock would have generated in Jan and September 2018 (the previous leverage peaks).
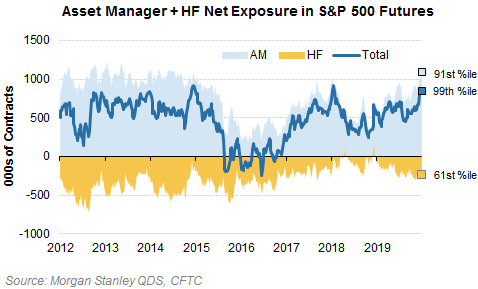
Asset manager futures positioning is extreme – while some of this incorporates the systematic strategies above, it likely also reflects discretionary investors adding to equity exposures.
HF grosses are at the highest since at least 2010 per the Morgan Stanley Prime Broker team. If there is an unwind, the risks to the most crowded names (MSXXCRWD Index on Bloomberg) are elevated.
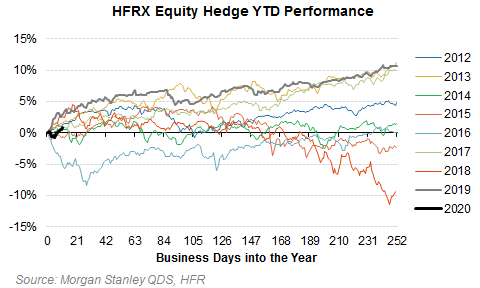
On the other hand, hedge funds are coming off a great year and off to a strong start, so are unlikely to be forced sellers at least initially. HF Net Leverage is in the 42nd %ile per the MS PB Content team.
Downside imbalances in the S&P 500 options market remain – dealers are short vega in a selloff, and while this is not new, retail is long VIX futures via ETPs versus short institutions on the other side, although less so than just a few weeks ago.
…
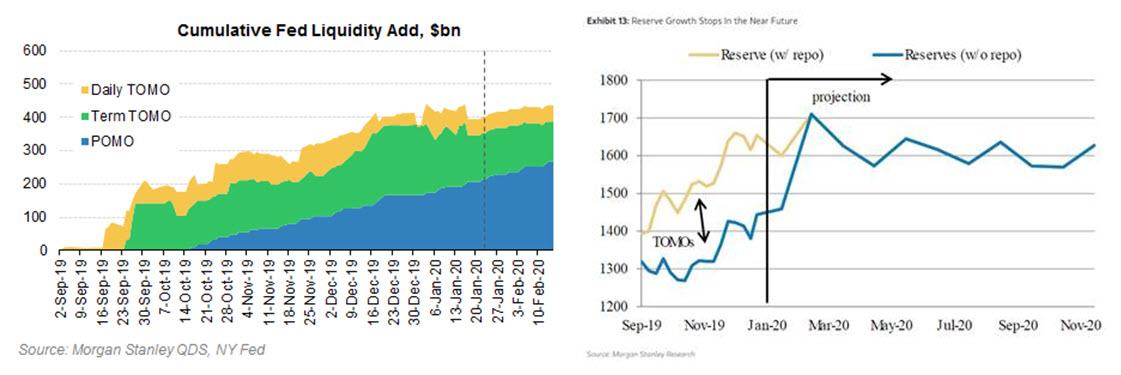
And in the other corner, weighing in at 850 pounds, is the Fed, although here too some dark clouds are gathering. Some of the year-end term repo rolled off last week, leaving the Fed’s balance sheet slightly smaller in the near-term. But POMOs are running at $60BN/month, while announced tapering of TOMOs is $5BN for each 2-week operation come February. At that rate of growth (assuming no increase in daily repo) the balance sheet would return to today’s level on Feb 13th. The question then is what the Fed does – and MS Research forecasts suggest that reserve growth stops in the near future.
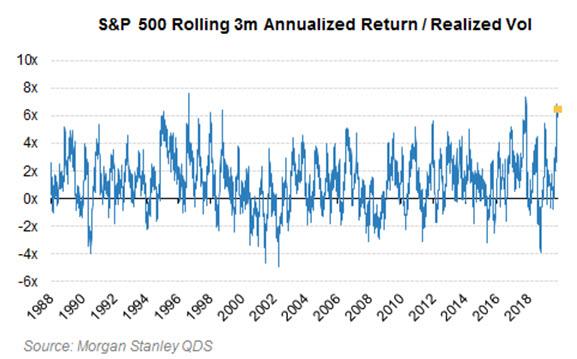
History suggests there are often near-term pull backs after rallies like we’ve just had (big move up on low volatility = historically high risk-adjusted returns) – although looking out beyond 3-months if anything this is a positive signal on average.
Implied vol generally is low enough to make buying options not prohibitively expensive, but it’s still not screamingly cheap. QDS instead prefers using spreads to hedge – put spreads in IWM and put spread collars in QQQs.
- IWM Feb 30/15^put spreads cost ~50 bps and offer 5x risk reward. Russell/IWM implied vol is cheap relative to the S&P 500 while skew is steeper (relative to its own history).
- QQQ Feb 30/15^ put spreads can nearly be fully funded by selling 20^ calls. NDX/QQQ implied vol has become elevated over the last few weeks, and with grosses already high it is getting harder for many funds to continue to add to areas (like Tech) that are already overowned.
d
dsd
d
Tyler Durden
Wed, 01/22/2020 – 14:10
via ZeroHedge News https://ift.tt/38u89nT Tyler Durden
