“The Biggest Decline Ever”: Goldman Now Sees US GDP Crashing 34% In Q2
Just over a week ago, when we reported on the ongoing feud between Goldman and JPM to come up with the most terrifying GDP forecast for the US, and when we asked if a Second Great Depression has begun after Goldman’s chief economist Jan Hatzius slashed his Q2 GDP forecast from -5% to -24%, we said “we expect Goldman to take the machete to this analysis as well in the coming days, because if the US economy is indeed paralyzed for at least one quarter, then all of GDP could be lost.”
We were right, because early on Monday morning Goldman’s Haztius did just that, and in a report titled “The Sudden Stop: A Deeper Trough, A Bigger Rebound”, he writes that he is “making further significant adjustments to our GDP and employment estimates. We now forecast real GDP growth of -9% in Q1 and -34% in Q2 in qoq annualized terms (vs. -6% and -24% previously) and see the unemployment rate rising to 15% by midyear (vs. 9% previously).”
Yes, the Q1 GDP drop is stunning…
… but it is the Q2 collapse which wipes out more than a third of the US economy that is truly jawdropping because as Hatzius admits, “it would represent a decline that is more than three times larger than the previous low in the history of the modern US GDP statistics.”
Detailing the assumptions behind his latest revision, Hatzius explains that he has increased his estimates of the peak hit to services consumption, manufacturing activity, and construction, “in light of new evidence on the severity of the hit across the different sectors” and now expects the level of GDP in April to be 13% below the January/February trend, as shown in Exhibit 1. “We assume that this drag then fades gradually by 10% each month in the services industry and by 12.5% in the manufacturing and construction industries.”

Behind the core of the drop Goldman sees a 19% annualized drag from services consumption on Q2 growth, on top of a 3pp drag on Q1 growth. as shown in the next chart.

Ok but why do the reputable epidemiologists at Goldman believe the pandemic will fade in coming weeks? Here’s why (and yes, warm weather makes an appearance):
While the exact timing of the medical and economic recovery is highly uncertain and relapses are plausible, our assumption is that stronger lockdown and social distancing measures and perhaps some weather effects reduce new infections sharply over the next month. Combined with potential medical breakthroughs or adaptation by firms and consumers, this slowdown in new infections is likely to lead to a gradual economic recovery. The slow pace of recovery in our forecast even in 2021 allows for longer-lasting scarring effects on businesses and workers
And at the risk of repeating ourselves too, we will say that within a week, Goldman will cut its forecast again this time to -50% as we approach the moment when even banks admit the entire US economy has ground to a halt.
In any case, as Goldman explains further, its latest apocalyptic forecast reflects the net effect of two directionally offsetting changes:
- On the one hand, the anecdotal evidence and the sky-high jobless claims numbers show an even bigger output and (especially) labor market collapse than it had anticipated. This not only means deeper negatives in the very near term but also raises the specter of more adverse second-round effects on income and spending a bit further down the road.
- On the other hand, both monetary and fiscal policy are easing dramatically further, which will tend to contain these second-round effects and add to growth down the road. The Phase 3 fiscal package was much bigger than we had expected, we now anticipate a Phase 4 package focused on state fiscal aid, and the Fed is likely to use the $454bn addition to the Treasury’s Exchange Stabilization Fund aggressively to sustain the flow of credit to private-sector and municipal borrowers.
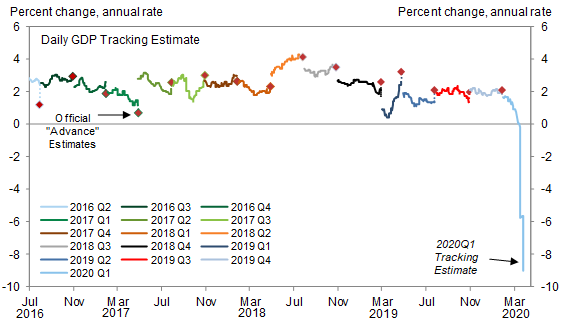
The chart below translates the monthly path of the level of GDP shown in Exhibit 1 into a quarterly path of GDP growth, adding the impact of what Goldman believes will be second round effects and the fiscal impulse. For the first half of 2020, the bank now look for real GDP growth of -9% in Q1 and -34% in Q2, versus -6.3% and -24% previously. As Hatzius admits, the “Q2 forecast would represent a decline that is more than three times larger than the previous low in the history of the modern US GDP statistics (-10% in 1958 Q1).” Subsequently, the bank’s assumptions about the gradual fading of the virus drag imply a growth pace of just over 15% in the second half of 2020. In conclusion, Goldman’s forecast of full-year 2020 growth is now -6.2% on an annual average basis and -5.4% on a Q4/Q4 basis.

In other words, to preserve its traditional cheerful aura – even as it now forecasts a depression in the second quarter, Goldman has offset its future forecast with an even more vicious V-shaped recovery, and has upgraded its expectations for the recovery after midyear, now expecting a hilarious 19% annualized GDP gain in Q3 (vs. 12% previously), with the bank’s estimates implying that a bit more than half of the near-term output decline is made up by year-end and that real GDP falls 6.2% in 2020 on an annual-average basis (vs. 3.7% in our previous forecast).
Good luck with that.
Finally, turning away from GDP, Goldman’s unemployment outlook is just as dire, admitting that the surge in layoffs has “already outpaced our expectations.” Jobless claims rose about twelve-fold over the week of March 15-21 to 3.28mn, nearly five times the previous historical high for a single week, with Goldman noting that jobless claims are likely to rise further during the week of March 22-28.
Press reports citing state officials indicate that claims rose dramatically from March 15-21 to 22-28 in California and Texas. Our analysis of anecdotal press reports for the 15 most populated states suggests a significant increase in total claims during March 22-28, in part because many states experienced application bottlenecks in the first week and in part because stay-at-home orders likely had a greater effect in the second week.
As a result, Goldman now estimates that the level of jobless claims rose by more than 2mn to about 5.5mn during March 22-28. A less conservative extrapolation of the estimated ratio of week 2 to week 1 claims in these states would imply an even higher national total. It then expects even higher numbers in the coming weeks:
We expect claims to remain very elevated—likely over 2mn—for at least another week (March 29-April 4) and somewhat elevated after that. Widespread reports of application bottlenecks suggest that many laid off workers have yet to file. Some employers, especially in the retail sector, are taking a staggered approach to layoffs. And many business owners and workers are just beginning to learn about the more generous unemployment insurance benefits—which will exceed normal wages for many workers—and the expansion of coverage included in the Phase 3 legislation. In total, we expect over 11mn claims to be filed in the first three weeks of the coronacrisis and at least a couple million more in the rest of April.
What do soaring claims mean for the unemployment rate?In short, Goldman now sproject a nearly 12% increase in the unemployment rate to a peak rate of 15%.

Finally, just like JPM, Goldman admits it really has neither the visibility nor the proper models to predict what happens next as the US economy slides into a depression:
Using the labor market data in this fashion requires an estimate of “Okun’s law”, the relationship between the change in the unemployment rate and the change in real GDP (relative to trend). Normally, the coefficient for Okun’s law is thought to be about 2, meaning that a 1pp rise in the unemployment corresponds to a 2% hit to real GDP. During this crisis, however, a more appropriate Okun’s law coefficient is likely to be closer to 1.
Our current estimate of a roughly 12pp increase in the unemployment rate implies a roughly 12% peak decline in the level of GDP, which is broadly consistent with the estimates in Exhibits 1 and 2. Going forward, we plan to use this relationship and its industry-level counterparts aggressively to keep our GDP estimates up to date in coming months as more timely labor market data become available. This could well imply further substantial revisions to our real GDP estimates—in either direction—as the scale of the labor market downturn comes into fuller view in coming weeks and months.
This means that as we enter the cruelest month in the history of the US economy, when GDP may plunge double digits in April alone, brace for even more cuts from Goldman which will forecast a -50% GDP print before it’s all said and done.
Tyler Durden
Tue, 03/31/2020 – 08:29
via ZeroHedge News https://ift.tt/39CPmY1 Tyler Durden