Here’s Where Friday’s Employment Report Could Really Disappoint
Authored by Bryce Coward via Knowledge Leaders Capital blog,
Given the surge in unemployment claims over the last month the US unemployment rate is expected to rise to 16% in April from just 4.4% in March. Shocking as that number is, we have no problem with that forecast.
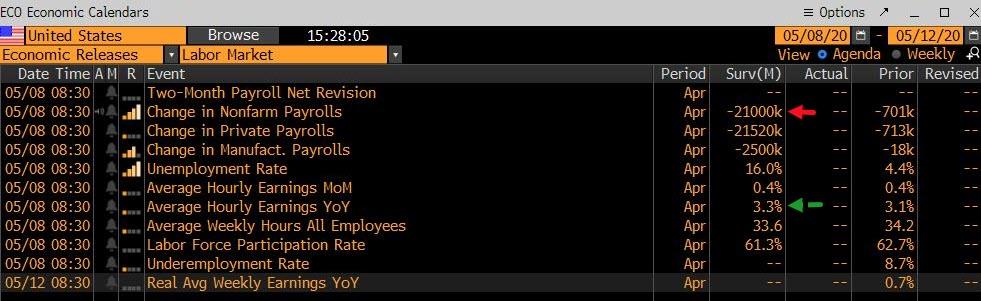
But for some reason economists surveyed by Bloomberg expect average hourly earnings to grow at +3.3% year-over-year in April compared to 3.1% in March, and they expect average weekly hours of 33.6 in April compared to 34.2 in March.
I do wonder how it can be that the unemployment rate will shoot up to a post-war high and yet those employees who were not furloughed or laid off will, in aggregate, have the near the same level of hours and earnings as before. After all, Google search trends for the terms “pay cut” and “hours cut” have reached an all-time high in recent weeks.


Moreover, the idea that average hourly earnings will actually increase sequentially in April for those employees who did keep their jobs is wholly inconsistent with consumer survey data.
For example, when I compare University of Michigan Consumer Expectations to average hourly earnings then it looks like we should be expecting something closer to just 2.5% year-over-year growth.
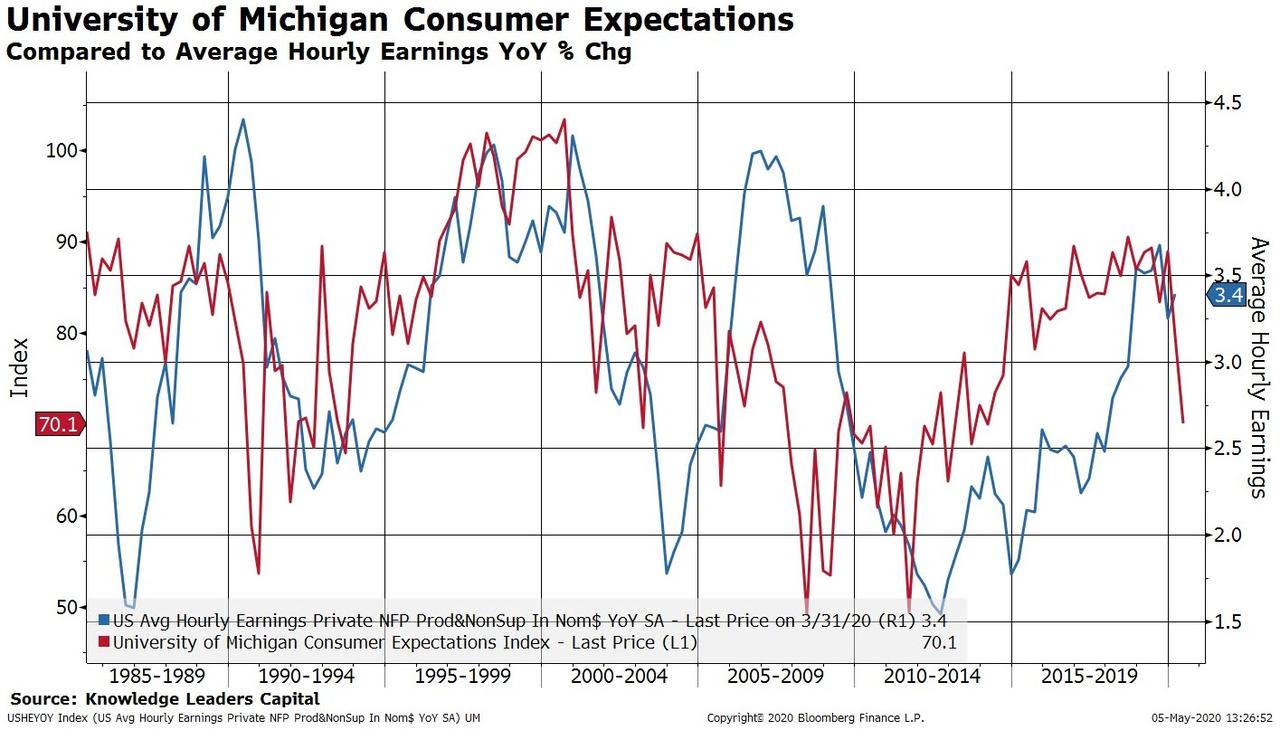
2.5% year-over-year growth would equate to a month-over-month decline of -0.78%.

That would be the largest month-over-month decline on record…by a mile..and I suspect there is even downside to that figure as well given Google search trends.
Now, in fairness, the University of Michigan consumer survey appears to be more in line with the estimated decline in average weekly hours.
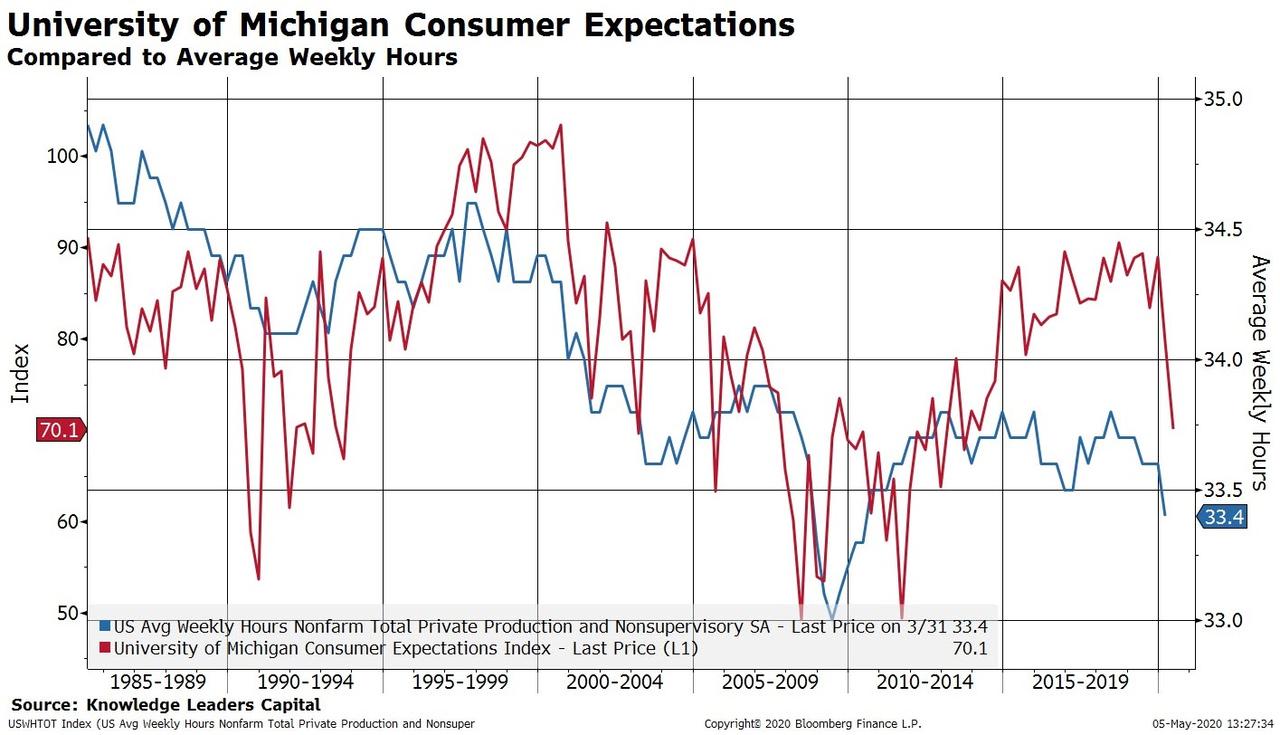
But the Google search trends shown above still suggests a rather large decline in hours worked.

Putting these items together – overall employment times wages times and hours worked – the nominal income generated from employment in April is likely to be fully 14% lower than year ago levels… nearly 3 orders of magnitude worse than the worst readings of 2009.
Aside from the collapse in earnings which everyone seems to be ignoring, Goldman estimates nonfarm payrolls declined by 24 million in April (vs. consensus of -21.7mn), reflecting a surge in business closures and temporary layoffs related to the coronavirus. Additionally, Goldman notes that alternative data sources such as Google Mobility, Homebase, and Nielsen all indicate job losses of 24 million or more.
Arguing for a weaker report:
-
Big Data. As shown in Exhibit 1, four timely employment measures all indicate an unprecedented scale of monthly job loss. For example, an online survey by University of Chicago economists using the Nielsen Homescan panel found that 24 million people had lost their job by early April. With the exception of ADP (-20.2mn private payrolls, mom sa), these data all point to worse-than-consensus jobs number in tomorrow’s report. Relatedly, early April job losses in Canada exceeding 4mn would imply a US payroll decline on the order of 40mn in tomorrow’s report (simply based on the relative size of the two economies). By industry, these data suggest that job loss has been particularly pronounced in the food services, accommodation, recreation services, social assistance, and temporary help sub-industries.
Exhibit 1: Alternative Data Indicates April Job Losses of 24 Million or More
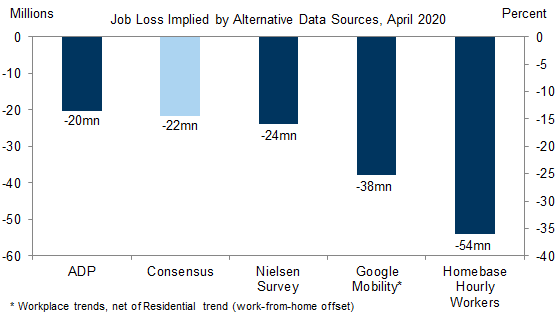
Source: Bureau of Labor Statistics, Bloomberg LP, Haver Analytics, Department of Commerce, Goldman Sachs Global Investment Research, University of Chicago, ADP, Google, Homebase, Nielsen
-
Jobless claims. Continuing claims rose by 16.2mn from survey week to survey week (sa), and 23.4 million more initial jobless claims were filed during the April payroll month than a year ago (nsa). Given widespread filing and processing delays, we place more weight on the former measure. Relatedly, we also note that some of the 6.3mn initial claims filings during the subsequent two weeks reflected layoff activity during the April payroll month.
-
Business Closures. We believe the BLS is likely to impute zero employment for many of the “non-essential” businesses that were unable to complete the survey this month—echoing the approach adopted in the aftermath of Hurricane Katrina.
-
Employer surveys. Business activity surveys declined in April, and the employment components of our survey trackers plummeted (non-manufacturing -14.1 to 33.7, all-time low; manufacturing -12.4 to 34.2, low since April 2009).
-
Job cuts. Announced layoffs reported by Challenger, Gray & Christmas jumped by 262% in April to 652k (mom, sa by GS) on top of its 298% increase in March.
Arguing for a stronger report:
-
Census hiring. In one of the few sub-industries with positive gains, Census temporary workers are set to rise by roughly 4k.
Neutral factors:
-
Job availability. The Conference Board labor differential—the difference between the percent of respondents saying jobs are plentiful and those saying jobs are hard to get—plummeted from 29.5 to -13.6, though it remains well above its Financial Crisis levels (-42.1 in 2009).
-
ADP. The payroll-processing firm ADP reported a 20.2mn drop in April private employment. While this would imply a better-than-consensus reading for private payrolls tomorrow, ADP noted that the report “does not reflect the full impact” of the coronavirus, and we place little weigh on the measure this month.
While declining self-employment due to the virus suggests an even larger drop in the household measure of employment (than the 24mn we expect for nonfarm payrolls), we expect some individuals to classify themselves as “employed but not at work.” We also expect the participation rate to decline several points on account of the virus, which should also limit the magnitude of the increase in the jobless rate. Taken together, we estimate the unemployment rate rose almost 10 points to 14%.
In interpreting tomorrow’s report, we will pay special attention to the composition of the household survey, specifically the number of unemployed workers on furlough or temporary layoff (which spiked to 1,848k in March, see left panel of Exhibit 2).
Exhibit 2: Temporary Layoffs May Be Key to Avoiding a Prolonged Downturn
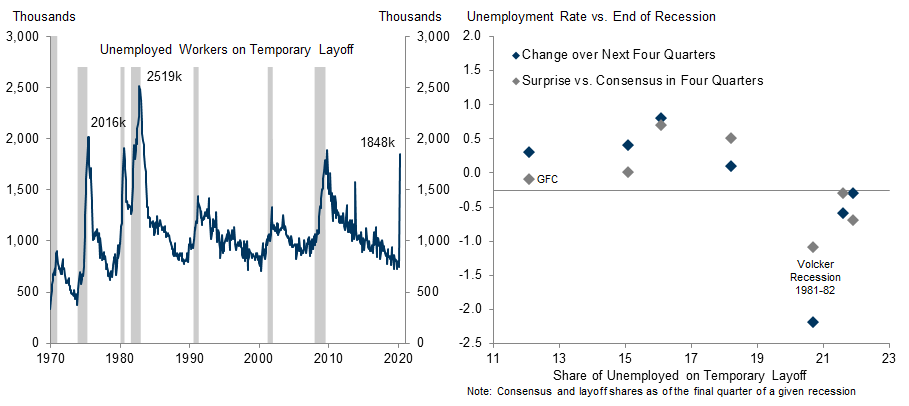
Over the last 50 years, the three recessions with the highest share of temporary layoffs were followed by the fastest labor market recoveries (both absolutely and relative to consensus forecasts at the time, see right panel above).
Tyler Durden
Thu, 05/07/2020 – 19:05
via ZeroHedge News https://ift.tt/35ERpdq Tyler Durden