This Is The Most Important Number For Wall Street For The Next Few Months
With the market now ignoring the latest economic data and corporate earnings outright, having put – for better or worse – the coronavirus lockdown in the rearview mirror while ignoring the latest profit data (which it believes is meaningless) and instead looking ahead to the gradual reopening of the US economy, the only thing traders care about is how far the US economy is from a return to normalcy. To answer their question, Goldman has put together a real-time reopening scale which, since no fundamental or economic data matter, will soon become the top market-moving indicator for the US stock market.
* * *
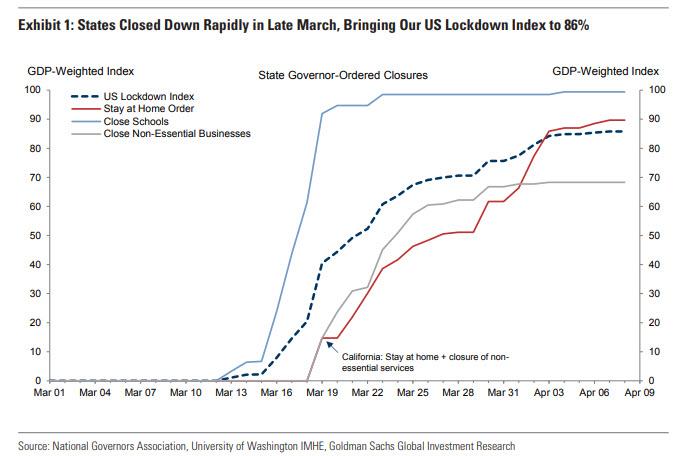
One month ago, when most of the US was still behind the curve on the first wave of the corona pandemic, Goldman published a “lockdown index” to keep track of where on the spectrum, so to speak, various US states and country in general were to be found.
One month later, the usefulness of this index appears to have peaked as markets now only care about the “reopening” – at least until the second coronavirus infection wave hits – and as cities and states across the U.S. begin to reverse lockdown measures at different paces and with different processes in place, Goldman has introduced a new index and weekly series that will measure the pace this reopening is happening by looking at a wide range of data from “Stay at Home” (food delivery, eCommerce, streaming media, grocery sales, etc.) to “Back to Normal” (commuting, box office, travel, etc.) and business activity (freight, housing, equipment sales, etc).
While Goldman uses economic data for this purpose, the bank also looks to a broader set of coincident, high-frequency sources (app downloads, point of sale, restaurant reservations, etc).
Aggregating this data, Goldman has created the Reopening Scale, an attempt to quantify where the balance of the scale sits between “Stay at Home”, the state we currently find ourselves in, and “Back to Normal”, relative to a benchmark (in this case Feb 3rd).
To determine the position of the scale (1-10) Goldman calculates growth or decline in each category relative to pre-Crisis levels, and equal-weight each category into its new Composite Scale.
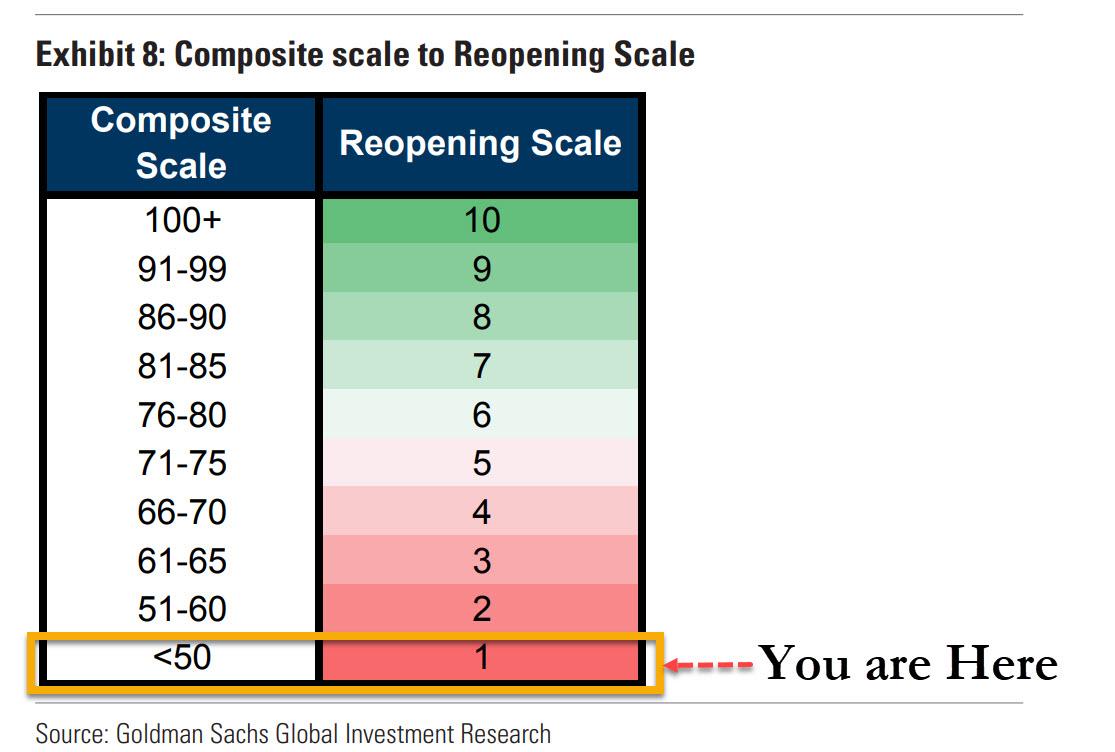
From there, Goldman assigns a Reopening score reflecting these quantitative inputs.
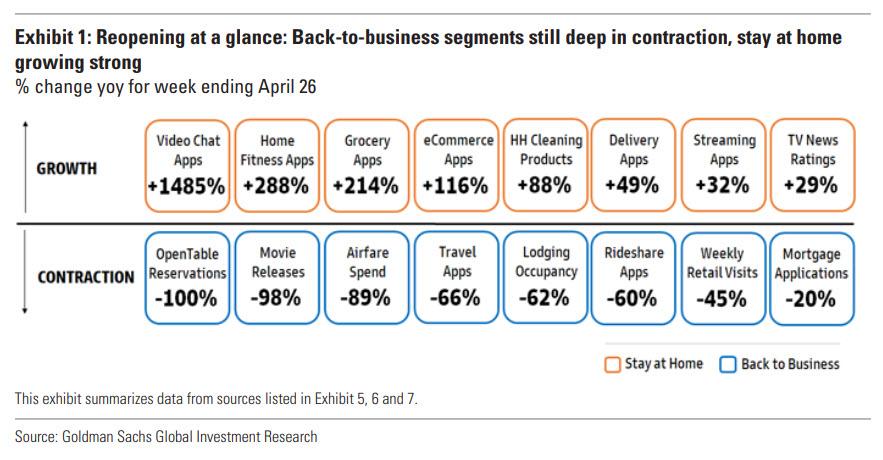
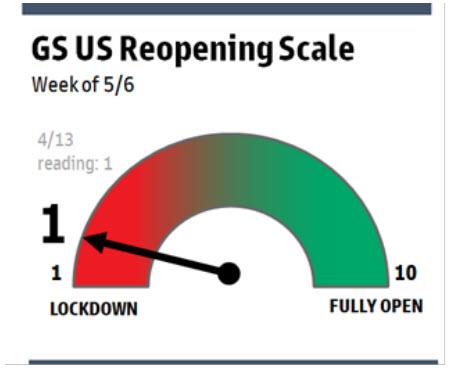
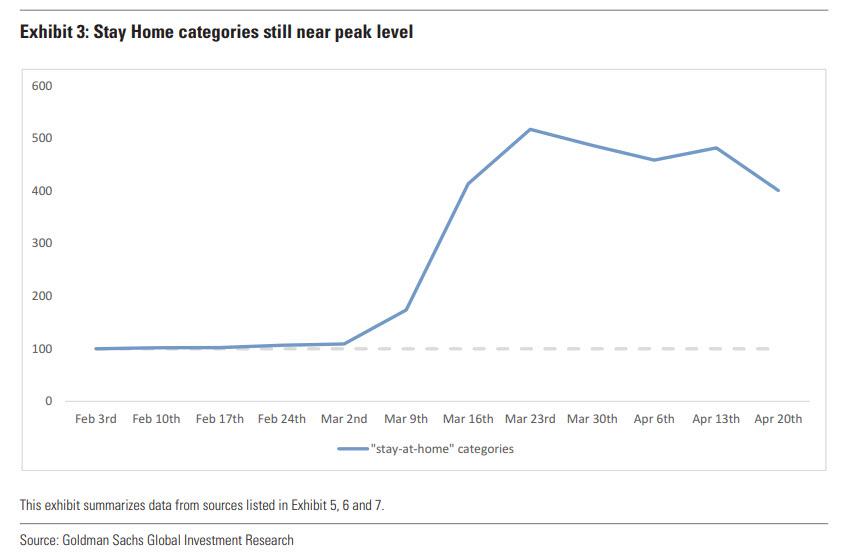
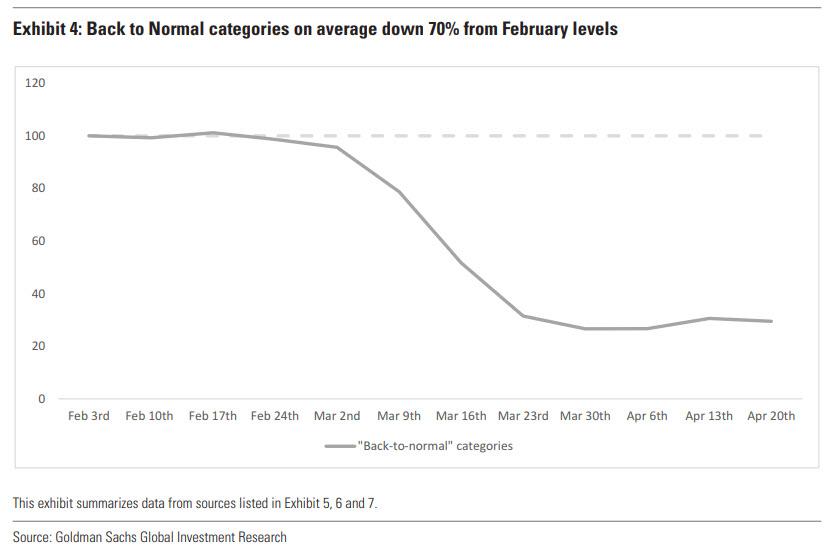
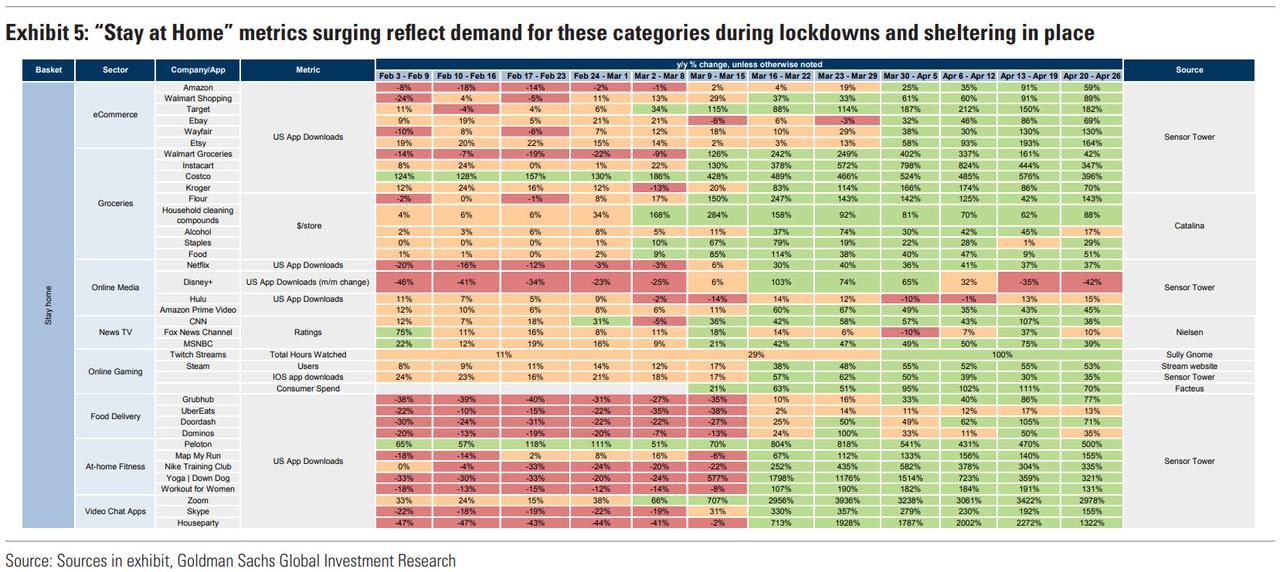
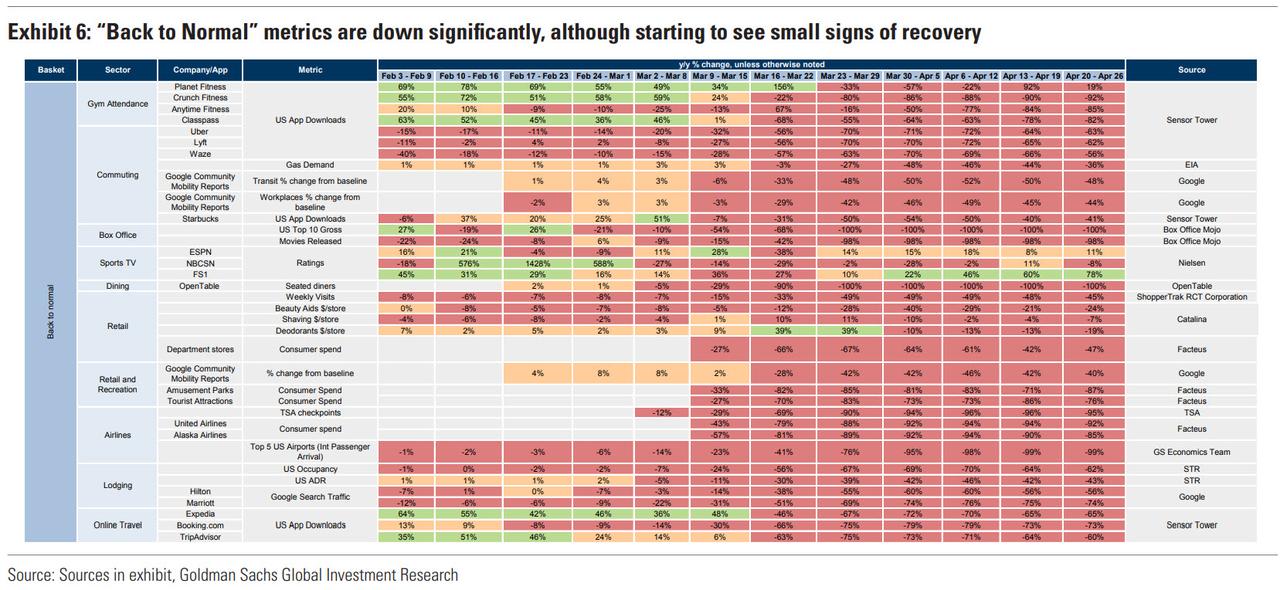
No surprise, the scale currently reads “1”, as all of the “Stay at Home” categories (Exhibit 5) have increased dramatically over recent weeks and “Back to Normal” categories (Exhibit 6) have declined materially, with many down 90%+.
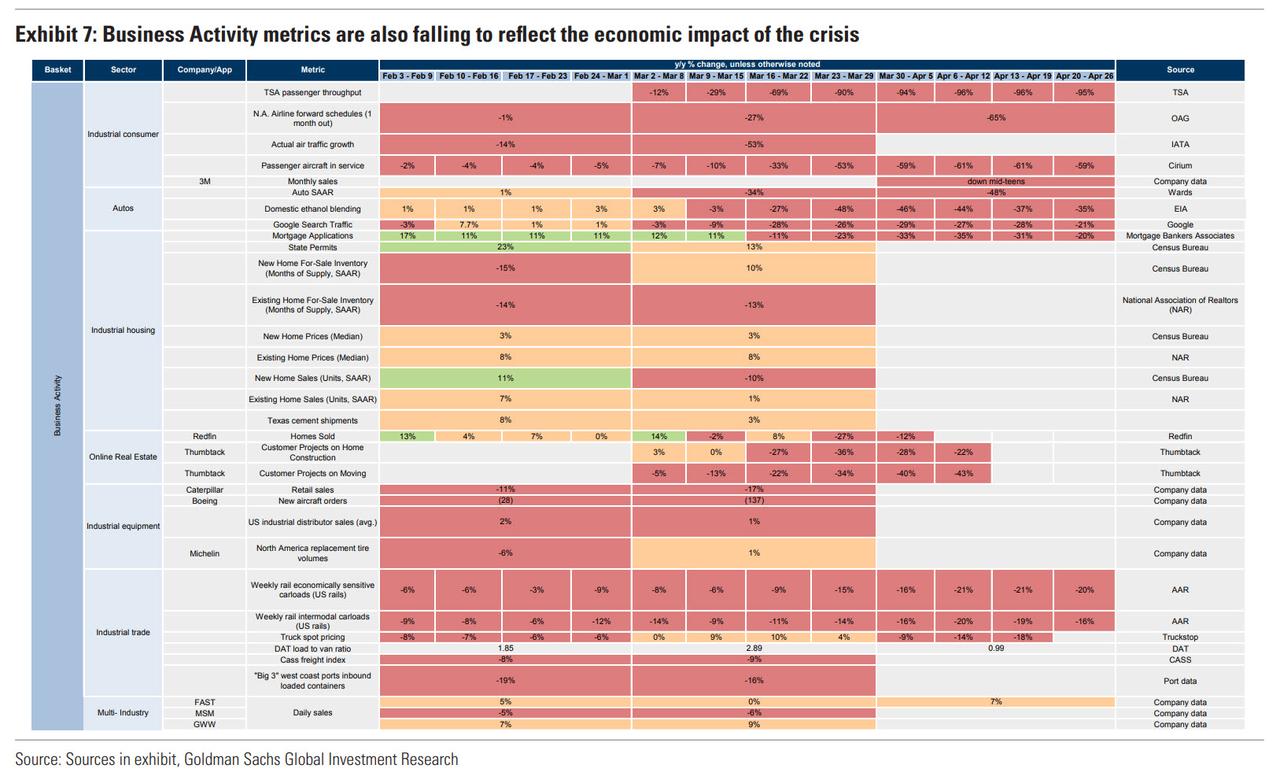
Similarly, many of the business activity categories (Exhibit 7), which are somewhat independent of the other two categories given businesses’ ability to adapt, are currently mostly lower. As progress toward reopening begins, that should show up in the Reopening Scale moving higher and plan to monitor that progress here.
[most important index to watch ]
The key findings from Goldman’s reopening index
The initial read across these data sources describe a quasi-apocalyptic landscape we’re all very familiar with: lots of eCommerce deliveries, streaming media, and video chats taking the place of commuting, travel, and trips to the store. While that picture is still very one sided in the data, with cities and states beginning to look for ways to reopen, Goldman expects to see the scale shifting higher over time, showing less “Stay at Home”…
…. activity and more signs of “Back to Normal.”
Highlights:
- eCommerce adoption is accelerating through the end of April after averaging >65% y/y growth in app downloads for each week in the month. Companies including Amazon, Walmart, Target, Ebay, Wayfair and Etsy represent this category, although there are many others also benefiting from higher demand. This adoption is significant and sustainable: Wayfair saw 90% growth in April accelerating through the period as people focus on home decoration and improvement while relying on the convenience of having bulky furniture shipped to the door.
- The grocery category is up broadly but split between products that are benefiting in this environment (flour, cleaning products, alcohol) versus those that are not (beauty aids, shaving, deodorant). The $ spend per store on flour peaked at +250% y/y at the end of March when people stocked up in anticipation of a lockdown, while deodorant spending was down 20% last week as nobody seems to care if they stink any more since most are working out of their pajamas in their bedroom. At some point these categories will trend back towards normal levels as businesses reopen and people begin spend more time outside of the household. The question is when.
- Within Industrials, Goldman is keeping an eye on (1) the Industrial consumer: where we monitor air travel, auto sales and ethanol blending which is a measure of gas consumption; (2) Industrial housing: where we follow mortgage applications, new & existing home sales and prices, state permitting activity and cement shipments, all of which should indicate house shopping and construction activity; (3) Industrial equipment: including Boeing aircraft orders, CAT retail sales and industrial distributor sales; and (4) Industrial trade: including what is carried by rail and truck and what is coming through major ports. Across all four categories, including across nearly each singular metric, the data has deteriorated sequentially each month through the year thus far, with no major positive second derivatives yet. The consumer and housing related data could improve first, as stay-at-home orders are lifted; while equipment and trade could recover after consumer and housing, given the longer cycle nature of the economic activity.
- Travel is clearly one of the most heavily impacted sectors, and the focus is on the most representative companies in airlines, lodging and OTAs. Air travel domestically, as represented by TSA checkpoint passengers, was down 95% y/y last week and international passenger arrival from the top 5 US airports was down 99% this past week. Notably, extended stay companies, which we did not include in our lodging data, actually saw growth during this period as an option for people sheltering in place.
- On the other hand there are some small, early signs that life is resuming some form of normalcy. While all commuting metrics have fallen since February, including gas demand declining ~50% in the latter half of March and first week of April, and Starbucks app downloads trending similarly, gas demand has improved this past week to -36% from a trough of -48% y/y. Google Community Mobility Reports are also showing workplace and transit movements down roughly 50% at the trough, although there are small upticks in the most recent weeks, indicating an increase in general mobility as some states begin to reopen.
- Restaurant traffic, as measured by the number of seated diners on OpenTable, is slowly picking back up in recent days from -100% since the end of March. Overall dollar sales at restaurants, meanwhile, have improved from a -60%+ run rate in late March to -40% in early May as take-out and delivery orders increase in the wake of stimulus check disbursement. Similarly, there has been a tick-up across retail concepts that remain open (e.g., discount stores, wholesales clubs, etc.). These small signs of recovery will continue as the country gradually reopens and consumers resume their daily activities.
Stay Home
In Goldman’s “Stay at Home” scale, demand surges are most prominent for Video chat apps with weekly downloads growth up ~1700% y/y on average in April. Grocery apps including Walmart Grocery, Kroger and Instacart have seen 314% y/y app download growth in the same period of time, while dollars per store spent on flour, household cleaning compounds and alcohol grew 50% y/y on average. At the same time, online gaming engagement continues to increase, with the number of hours of Twitch streams doubling in April y/y to reach ~1.8bn.
Many of these categories saw the highest growth rates in the second half of March/first half of April when lockdowns in the US began, including news TV such as CNBC which saw ratings grow 60-70% y/y in the latter half of March as people tuned in to hear daily updates on COVID-19. We expect elevated demand into the summer months for this basket of “Stay at Home” metrics, although many of them are already seeing more moderated growth in the most recent 2 weeks.
Stay Home Category Updates
- Verizon management noted that their Consumer segment saw some change in activity over the last two weeks as government stimulus checks came in, including a greater inflow of payments and some early signs of increased retail volumes (gross adds and upgrades).
- Target management suggested that there was a significant pick up in the home category in the beginning of April as people adjusted to more home cooked meals.
- PayPal saw a 135% y/y increase in net new active accounts as holdouts in the digitization of money were forced to find alternatives to cash.
Back to Normal
The “Back to Normal” category includes some of the most heavily impacted consumer segments, including commuting, dining and all aspects of travel. The Google Global mobility report suggests that both transit and workplace movement trends are down roughly 50% from the baseline (roughly similar to the 40%+ decline in gasoline demand), while most box office and dining metrics are down 100%, since movie theaters and restaurants were some of the first places to be shut down. Beauty product sales are also suffering sharp declines and sales of deodorants at grocery stores have now fallen double-digits for four consecutive weeks as people shelter at home. On the travel side, TSA checkpoint passenger count has been down >90% y/y since the second half of March, with the number of passengers in the US falling to 750K in the week of April 20, 2020, compared to >16 million in the same week in 2019. US occupancy rates continue to be down 62% y/y in the week of April 20th, though rates are off lows of -70% in the first week of April
Back to normal category updates
- Some of the most anticipated movies are expected to release later in the year, with the exception of Mulan: Wonder Woman (8/12 release), Black Widow (11/6), Top Gun Maverick (12/23), Mulan (7/24), No Time to Die (Bond) (11/25).
- While Opentable data indicates reservations are down 100% y/y for the country, early restaurant reopenings in select cities like Atlanta, Tampa and Dallas show diner declines of 80-97% y/y versus 100% in the rest of the country. Restaurants are reopening with modified hours and with significantly lower density than before, seating 25%-50% of the tables with many keeping bars closed to allow for social distancing.
- United Airlines noted that searches for spring break 2021 exceeded searches for spring break 2020 at this time last year, indicating pent-up demand, although they do not expect many of those to turn into real bookings until the virus is sufficiently contained
Business Activities
Business activities have also been heavily impacted by COVID-19, including real estate and industrial trade. Mortgage applications were down over 30% y/y for the first three weeks of April as real estate transactions and home constructions also slow. Homebuilders reported an approximate 50% decline in order rates for April, with local economies that are more reliant on travel and tourism (i.e. Las Vegas) down 60+% while areas of the Southeast and Texas are off ~25%. Encouragingly, activity at the end of April had more than doubled off the lows seen earlier in the month as consumers look to take advantage of historically low mortgage rates. As peoples’ mobility continues to be restricted across a number of states, auto sales and ethanol blending are both down y/y, though we expect these activities to resume fairly quickly as restrictions begin to be lifted and consumer demand recovers. On the equipment side, there has been no recovery yet in Boeing aircraft orders or CAT retail sales, though we expect both could start to move off the bottom over the next few months
Business activity category updates
- Some recent rail carload data, while still sharply negative, is perhaps stabilizing. Other data including Economically Sensitive Rail Carloads is also assessed to evaluate the industrial economy, rail intermodal and West Coast Port data to get a sense for both global trade and the consumer economy and the Cass Shipment Index, DAT Load to Van Ratio, and Truckstop Spot Prices to ascertain general freight demand.
- Facebook noted on their Q1 earnings call that after an initial steep decrease in ad revenue in March, they have seen signs of stability reflected in the first three weeks of April.
- Building product companies saw sales off 30-35% YOY in April, as the strength seen in housing earlier this year comes through. With people staying home, Whirlpool reported April sales off 20-25%, with demand for secondary fridges and freezers (for home food storage) as well as small countertop appliances (i.e. stand mixers) rising, as people are increasingly cooking and baking at home.
Which brings us to the most important number on Wall Street for the next several months: The GS Reopening Scale
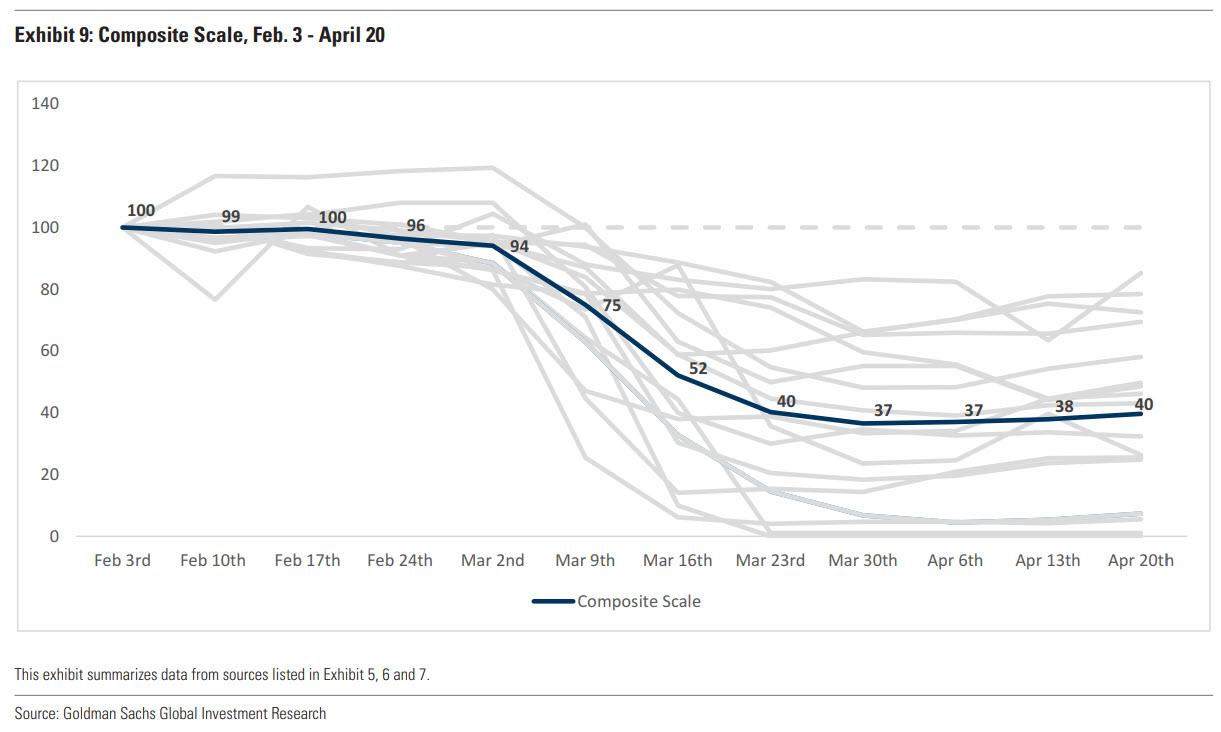
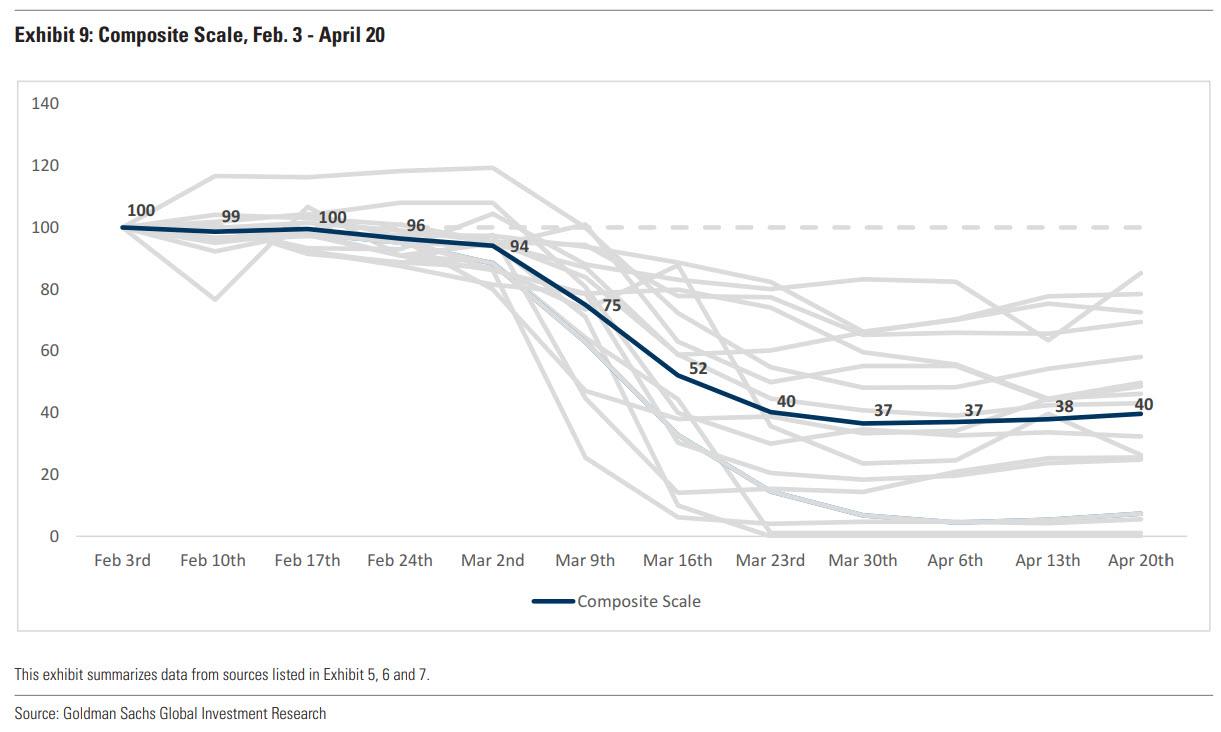
To look at all these metrics in aggregate and quantify where consumers are on the path to economic recovery, Goldman created a composite scale that is based on the inverse average of growth in all the sectors within “Stay at Home” categories and the normal average of “Back to Normal” categories relative to the week of February 3rd, reflecting where the consumer is between the two categories.
We are confident that in mere days this scale will immediately become one of the biggest – if not the top – market-moving indicators for a world desperate to learn how far away for normalcy we are; any uptick in the scale will lead to a sharp bounce in risk assets and vice versa, which means that once again Goldman will be able to manipulate the market with a data set that belongs exclusively to the bank, and which can be adjusted a critical inflection points.
Goldman indexes a value of 100 to consumer activity in the week of February 3rd, before the impact of COVID-19 in the US, and the minimum value that the composite scale has reached is 37. The composite scale is then translated onto a GS reopening scale of 1-10, where values below 50 represent a 1 and a return to Feb 3rd levels would represent a 10.
The GS reopening scale, based on the trajectory of the Composite Scale, first reached 1 in the week of March 23rd, where it has remained for the 5 weeks since, indicating that consumers are still at the trough of impacts from COVID-19.
The bank expects that as states begin to reopen for business, these metrics will slowly begin to recover, bringing to scale back up. However, Goldman’s economists expect the recovery to a 10 to take at least a number of months during which period the “Stay at Home” category will show significantly slower growth, while the “Back to Normal” category will likely moderate declines as people resume daily activities of dining, commuting and travel, among others. Goldman will refine this data weekly as a tool to measure the pace of reopening, measure consumer behavior and highlight sectors and companies that may be benefiting or disproportionately impacted from the shape of that process.
Tyler Durden
Sat, 05/09/2020 – 14:25
via ZeroHedge News https://ift.tt/3ck6fc0 Tyler Durden
