Amazon Surprises Market With Monster Bond Offering Just As Morgan Stanley Hikes Price Target To $2,800
Tyler Durden
Mon, 06/01/2020 – 10:34
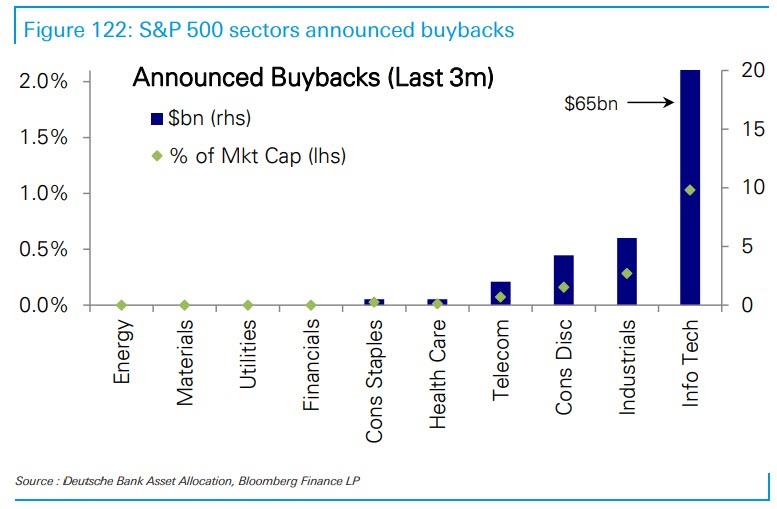
Yesterday we showed that in a world where most companies have mothballed buybacks until they get a sense of what cashflows will look like in the new post-corona abnormal, the tech sector remains a beacon for hope for those who demand to frontrun a management team buying back its own shares.
Getting a head start on even more buyback announcements, online retailing monopoly Amazon – which as a reminder disappointed investors with a surprise $4 billion in coronavirus-linked expenses – surprised markets when the A2/AA- rated issuer announced a monster USD bond issuance in 6 parts: 3yr, 5yr, 7yr, 10yr, 30yr and 40yr. The initial price talk according to Bloomberg was as follows:
- USD 3Y: +40 Area
- USD 5Y: +65 Area
- USD 7Y: +85 Area
- USD 10Y: +105 Area
- USD 30Y: +130 Area
- USD 40Y: +150 Area
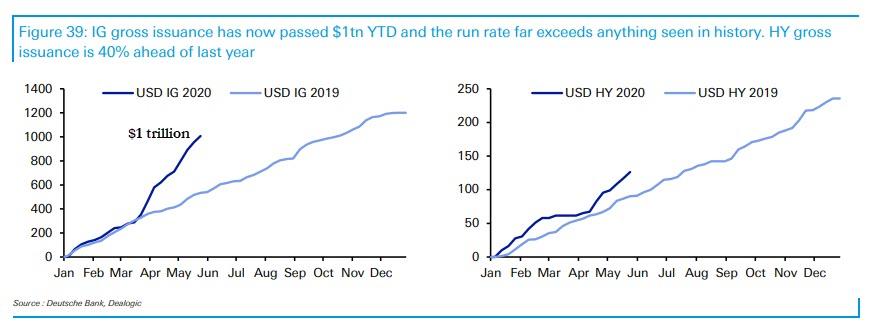
As a reminder, last week we first pointed out that less than 5 full months into the year, IG issuance had surpassed a record $1 trillion, a number which AMZN will push well toward $1.1 trillion after the offering closes today.
The news of the massive issuance was enough to spook Treasurys, and in an immediate reaction we saw Treasury Sep 20 futures fell from 138-31+ to 138.26+, and the 10Y yield was last trading at session highs above 0.68%.
Perhaps tied to Amazon’s buyback-boosting bond offering, Amazon quickly upgraded its price target to $2,800, just one month after it hiked the PT to $2,600. This is how analyst Brian Nowak justified his latest upgrade:
- E-commerce: Shelter-In Hobby #1: 2020 is setting up to be an e-commerce inflection year as the combination of shelter-in place, lower spend on experiences (dining out, bars, travel, etc) and gov’t stimulus have driven dollars online. Trends have accelerated monthly as shoppers have moved from stocking up (March), to buying more essentials and home items (March/April), to broad-based larger, more frequent buying (April to now) as our bottom-up e-commerce model leads us to estimated 58% Y/Y e-commerce growth in April (~4X faster than 1Q:20 and 2019). As in other online behaviors, we think part of this acceleration is structural, with more shoppers, spend and categories per shopper (namely grocery) moving online faster…but how durable is this growth?
- How Shifting Consumer Dollars Are (In Part) Driving E-commerce… It seems pretty durable. Our analysis of shifting consumer spend shows why the accelerating e-commerce trends aren’t surprising…as the dollars available to capture were much larger. That is, we estimate that e-commerce only captured ~12% of the incremental $170bn of April consumer dollars up for grabs from lost retail sales (stores closed/shelter-in), lower spend on bars/restaurants, and travel (see Exhibit 2). As detailed in the appendix, the estimated ~$60bn spent by consumers from their stimulus checks has also been a tailwind. While the world is now re-opening, we expect these buckets of available dollars (and the structural e-commerce behavior changes above) to remain e-commerce tailwinds…as we expect adjusted retail and travel spend to decline an aggregate of 18% in 2H:20…and for 3,000+ retail stores to close this year. Increased store closures alone could be a powerful driver to faster multi-year e-commerce growth.
- …As We Now See E-commerce Growing ~25% in 2020…Even if the Consumer Weakens in 2H: We believe this impact of behavioral change and more consumer dollars to be grabbed is large…as consider that even if e-commerce captures only 4% of these foregone consumer dollars in 2H (down from 12% in April from an assumed weaker consumer, no stimulus checks, and gradual reopenings) it would imply e-commerce still grows 21% in 2H and 25% in 2020. This is in-line with our new e-commerce base case. The extent to which consumers continue to spend more aggressively through the downturn could lead to even faster e-commerce growth…as every 1% of the 2H incremental available wallet up for grabs that e-commerce captures adds ~120bp to 2020 e-commerce growth. Stepping back, we think ‘20 will be a year in which we pulled forward ~2 years of e-commerce penetration (see Exhibit 7) Looking into ’21, our base case expects e-commerce growth to slow from these elevated levels (tough comps and an assumed weaker consumer ) but in aggregate our ’21 e-commerce estimate is ~10% higher than previously modeled.
As a result, Nowak raises his Amazon growth estimates and boosts the PT to $2,800:
Remains Top Pick: We expect AMZN to continue to drive and benefit from these inflecting e-commerce trends, as we raise our ’20/’21 AMZN revenue by 4%/5%…now expecting ’20/’21 US GMV (ex Whole Foods) to grow by 34%/18% Y/Y. This larger top-line drives up our forward profit estimates…and our PT to $2,800 as AMZN remains our top pick. We see faster top-line/share gains and a larger than expected profit snapback in ’21 ahead (lapping ’20 Covid investments and 2 years of 1-day investments) and think the street is still under-appreciating these trends, with AMZN currently trading at ~17X our ’21 EBITDA (a ~15% discount to the historical NTM average).
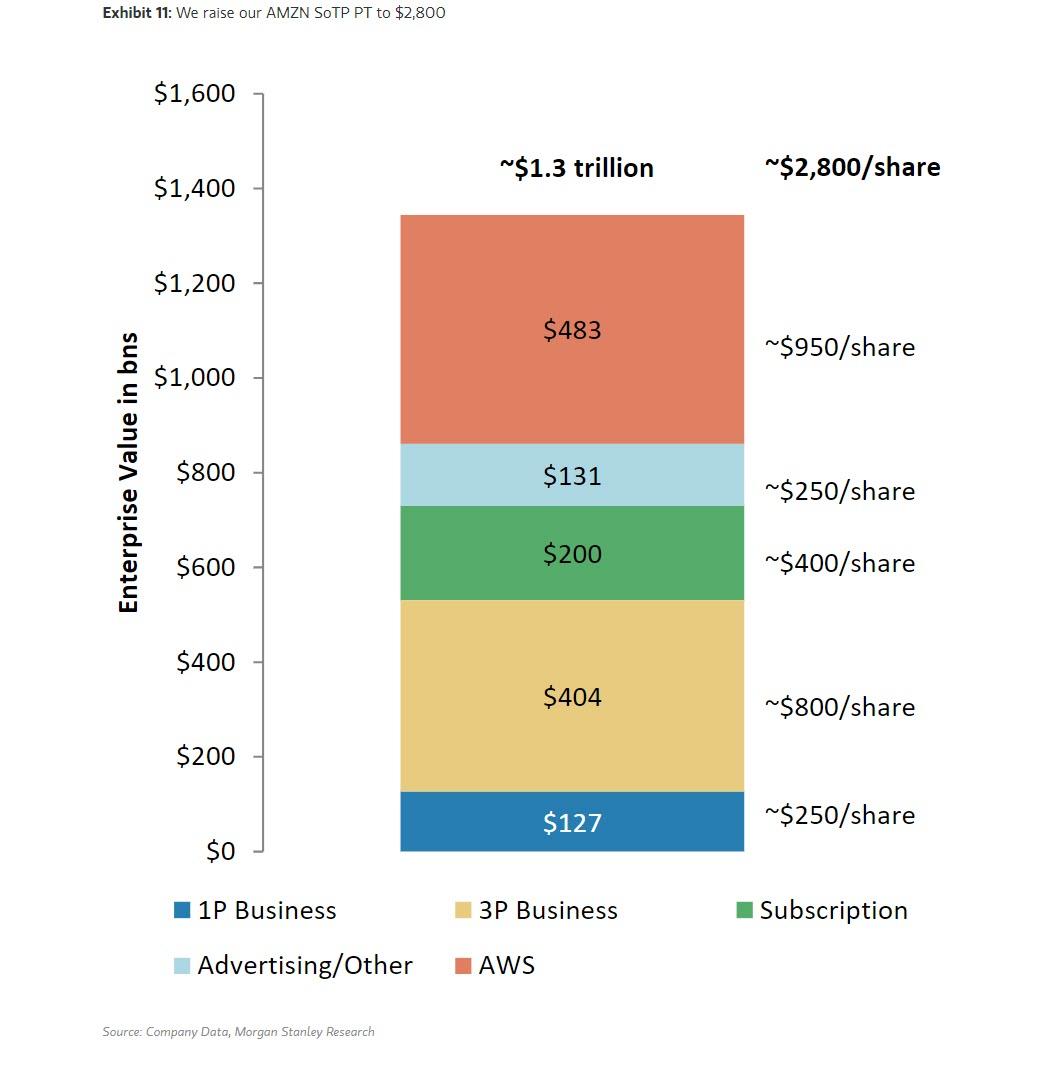
Visually, this is how the $2,800 price target is hit on a sum of the parts basis:
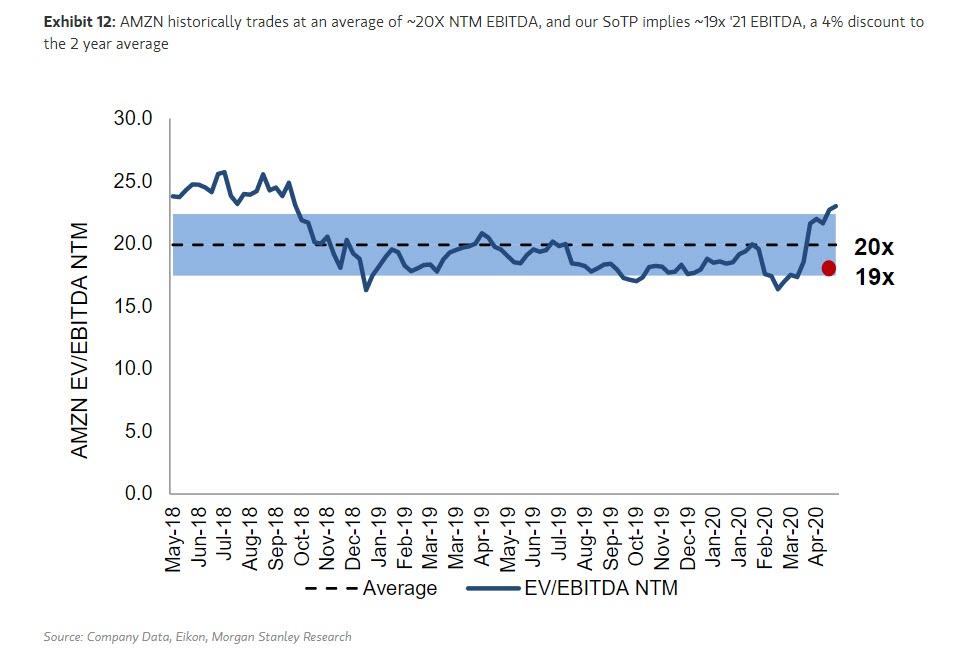
And the resulting valuation: AMZN historically trades at an average of ~20X NTM EBITDA, and MS’ SoTP implies ~19x ’21 EBITDA, a 4% discount to the 2 year average.
via ZeroHedge News https://ift.tt/2XNzuxH Tyler Durden


