Platts: 5 Commodity Charts To Watch This Week
Tyler Durden
Mon, 08/03/2020 – 14:20
Via S&P Global Platts Insight blog,
Shifting oil demand forecasts are in the spotlight this week as the coronavirus pandemic continues to curb economic activity in major economies. Plus, China’s crude overhang, and trends in power, gas and LNG.
1. Mobility data dampens oil demand outlook
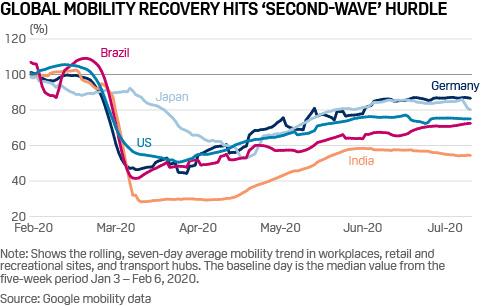
What’s happening? Mobility indicators, a key proxy for oil demand, are flatlining or falling in some of the world’s biggest oil-consuming countries amid growing fears over a resurgence in COVID-19 cases. In the US, the nation worst hit by the pandemic, Google data shows evidence of a July slowdown in economic mobility, which dipped to 25% below pre-crisis levels in the week to July 26.
What’s next? Rising coronavirus infection rates have already prompted some oil market analysts to cut their demand forecasts, most of which had previously predicted that oil demand would recover from an April nadir of around 80 million b/d sometime during 2021. A softer demand outlook, together with 2 million b/d of supply that was due to return to the market from OPEC+ from August 1, is also weakening the near-term market balance and capping oil price gains.
2. China’s oil import bonanza runs out of steam
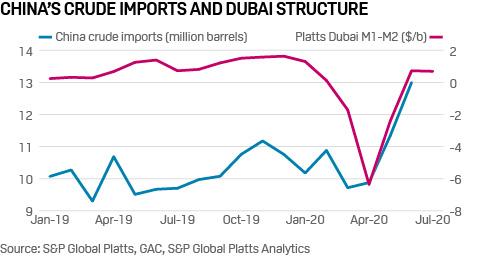
What’s happening? Low prices in the first quarter saw Chinese oil buyers go mad with the credit card, meaning that in the second quarter China’s crude imports have been roofing. Imports reached 13,000 barrels a day in July. But stockpiles have also reached record highs. Refiners are struggling to digest all that crude as domestic consumption has been slowing amid widespread flooding, in what has been one of China’s wettest months on record.
Whats next? Time to take a breather. China’s dampened demand for crude is reflected in the M1 – M2 price structure of S&P Global Platts benchmark Dubai easing from 72 cents/b in June to 69 cents/b in July. With such a large crude overhang and many oil cargoes idling in Chinese waters waiting to discharge, don’t expect China to return to the market and support crude prices anytime soon.
3. Italian industrial activity could support power prices in August
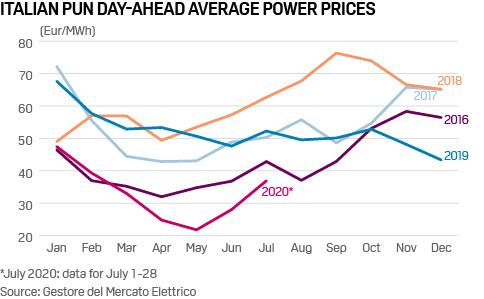
What’s happening? Power demand has recovered from lockdown lows in Southern Europe, but remains below norms in Germany and the UK. Spot prices reflect the recovery, with Italy’s national day-ahead power price, known as the PUN, averaging over Eur37.30/MWh in July, the highest monthly average since February according to market operator GME. The price jumped as high as Eur51.73/MWh July 28 and Eur49.05/MWh July 29 on a combination of higher temperatures and lower renewable energy generation.
What’s next? While traders expect a dip in electricity demand in August, it might not be as much as usual because of COVID-19. Many Italian factories are expected to remain open through the holiday month, having endured months of restrictions. A continuation of the dip in hydro and low wind output seen in July would sustain gas-fired generation, serving to support spot prices. Forecasts of a hot first two weeks of August saw the front month August contract on EEX rise 10% in the last few days of July to Eur37.59/MWh. The longer market view, meanwhile, reflects Italy’s enduring premium over its neighbors. Despite recent weakness on the curve, dominant utility Enel was still able July 30 to report 100% hedging of its 2020 Italian generation at Eur56.90/MWh, and 67% of 2021 output at Eur52.20/MWh.
4. Oil-indexed Algerian gas back in the money for southern Europe
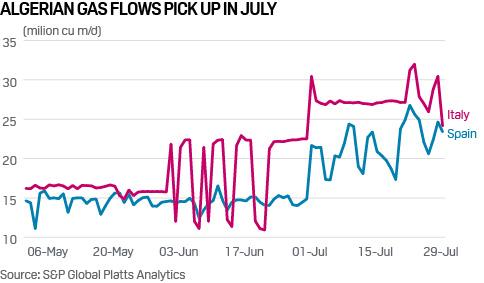
What’s happening? Algerian natural gas pipeline imports to southern Europe have risen sharply in July as oil-indexed contracts have moved back into the money. Algerian flows fell on an annual basis early this year, as they became uneconomical due to strong oil prices. However, the collapse in oil prices caused by coronavirus-driven demand destruction brought Algerian imports back in the money in July.
What’s next? S&P Global Platts Analytics expects Spanish imports from Algeria to start picking up this quarter to average around 24 million cu m/d, and to increase further in the fourth quarter. Trading sources expect Algerian gas to play the leading role in Spain’s supply. Italian imports from Algeria are due to rise further and average about 27 million cu/d over the next two months in order to meet the contractual take-or-pay levels for this Gas Year of about 9.7 Bcm/year.
5. US LNG exporters eye Europe for late September loadings
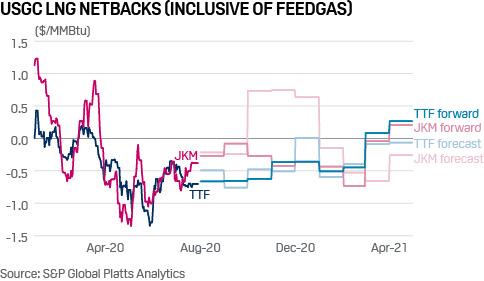
What’s happening? Outright buying appetite from North Asian LNG end-users has been muted, amid comfortable inventories and relatively mild weather in the region. But Europe may provide an opportunity for US LNG exporters as they eye the potential to ramp up from recent lows. A steep contango for the third and fourth quarter periods on the Dutch TTF forward curve signals that LNG cargoes loading from the Gulf Coast are again viable.
What’s next? Late September volumes are expected to be loaded and floated into the early November period, where they would capture the most value in the European grid, based on S&P Global Platts Analytics data. At least 26 LNG cargoes scheduled to be loaded in the US in September were said to have been canceled, a sharply lower number than for August.
via ZeroHedge News https://ift.tt/3i7XxQF Tyler Durden