The Earnings Gap: Why The S&P 500 Is Against The Clock
Tyler Durden
Wed, 08/19/2020 – 11:05
Authored by Eric Basmajian via EPB Macro Research,
-
Expectations for S&P 500 EPS are about 26% below the peak estimate from February 2020.
-
In the past two recessions, a substantial reduction in effective tax rates contributed to closing the EPS gap faster than the gap seen in aggregate corporate profits.
-
The earnings gap is not evenly distributed. Technology has virtually closed the gap in a matter of months, while cyclicals are slower to recover.
-
The S&P 500 is trading at over 19x the peak in EPS estimates, which leaves little margin for error or lag in closing the aggregate EPS gap.
-
Without the lever of substantially reducing effective tax rates, closing the EPS gap will be more challenging and perhaps create a path that delivers high volatility and weaker risk-adjusted returns.
Over the past decade, the heavy hand of central banks and the ubiquitous coverage of Fedspeak has formed a compelling narrative surrounding the deviation of stock prices from fundamentals. Despite this ingrained justification for rising share prices, a historical analysis of the data argues that stock prices are still closely associated with fundamentals, namely earnings per share “EPS.”
The confusion and the detachment from the underlying economy stem from the translation from true, underlying economic profits into “per share” earnings, which are heavily influenced by share buybacks and changes in effective tax rates.
Below we’ll take a look at the decline in EPS expectations and measure if the rise in share prices is unreasonable or justified.
In this note, we look at Bloomberg consensus EPS estimates for the year ahead as well as pre-tax corporate profits reported in the National Income and Product Accounts “NIPA.”
Profits from the NIPA are a better gauge of corporate profits across the entire economy rather than a select group of elite public corporations, and are not impacted by changes in tax rates nor share buybacks.
Thus, we’ll compare the earnings gap between EPS estimates and true corporate profits from the NIPA to judge how quickly profits generally recover from a recession and how much of the recovery is influenced by changes in effective tax rates, share buybacks, and general financial engineering.
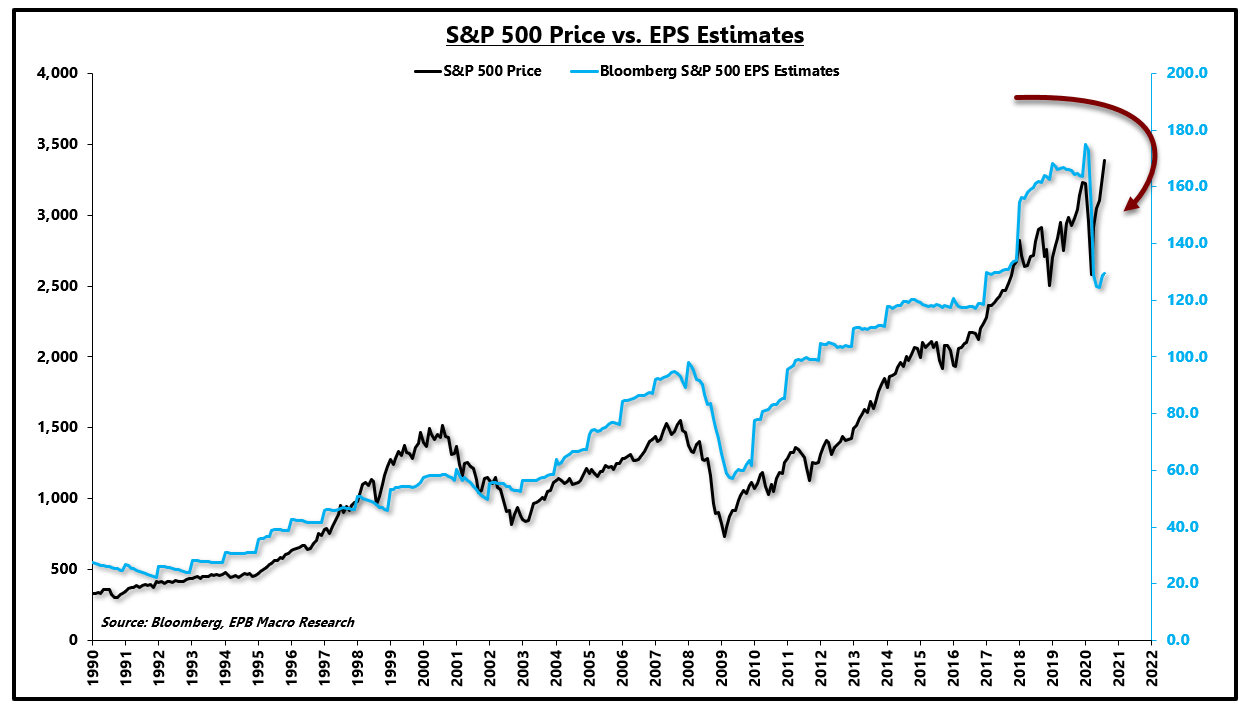
The chart below, despite popular opinion, clearly suggests that stocks track EPS over the long-run. Month to month or quarter to quarter, stock prices can deviate from EPS, and the resulting rising or shrinking PE ratio or multiple is generally mean-reverting.
The current gap between the price of the S&P 500 and earnings estimates is quite large as EPS have fallen sharply during the COVID lockdown, and the S&P 500 has seemingly ignored worse profitability.
S&P 500 Price vs. EPS Estimates:
Source: Bloomberg, EPB Macro Research
Measuring the PE ratio from trough recessionary earnings is typically an imperfect valuation gauge, which is why alternative measures such as the Shiller PE or “CAPE” ratio have emerged to correct for recessionary distortions in EPS.
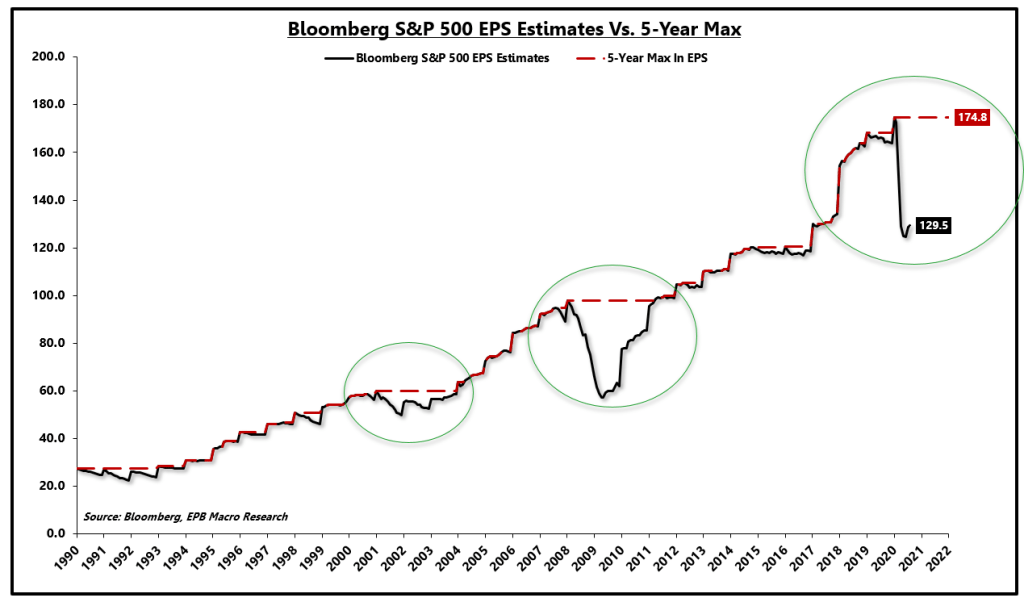
The chart below shows consensus forward EPS (in black) and the 5-year max in EPS estimates (in red).
As the chart shows, EPS fall during recessions but over time, return to the peak level of EPS and continue higher.
Thus, valuing the market based on peak EPS is reasonable, assuming some widow of time for earnings to return to a new high.
S&P 500 EPS Estimates Vs. 5-Year Max:
Source: Bloomberg, EPB Macro Research
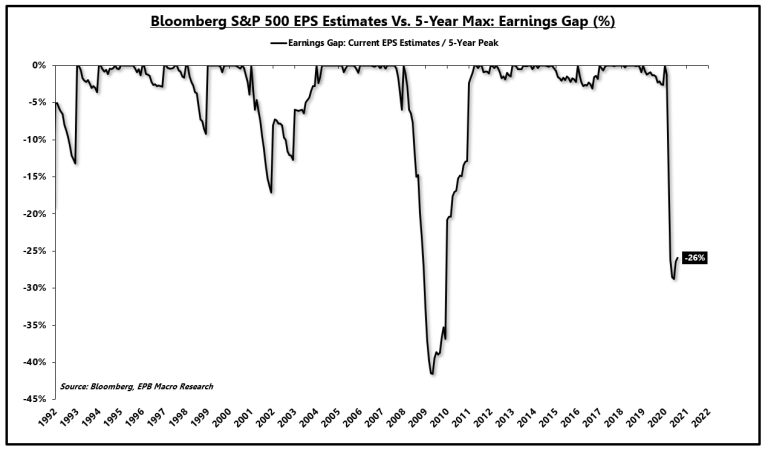
The chart below shows what I call the earnings gap or the difference between current EPS estimates and peak EPS estimates.
Currently, EPS expectations are 26% lower than peak EPS expectations from February 2020.
In 2008-2009, expectations for EPS fell over 40% from the peak in 2007.
After the Dot-Com bubble, the EPS gap was slightly more than 15%.
In each instance, it took roughly three years for EPS estimates to return to the peak level.
The three-year estimate will become important in a few paragraphs.
S&P 500 EPS Estimates Vs. 5-Year Max: Earnings Gap (%)
Source: Bloomberg, EPB Macro Research
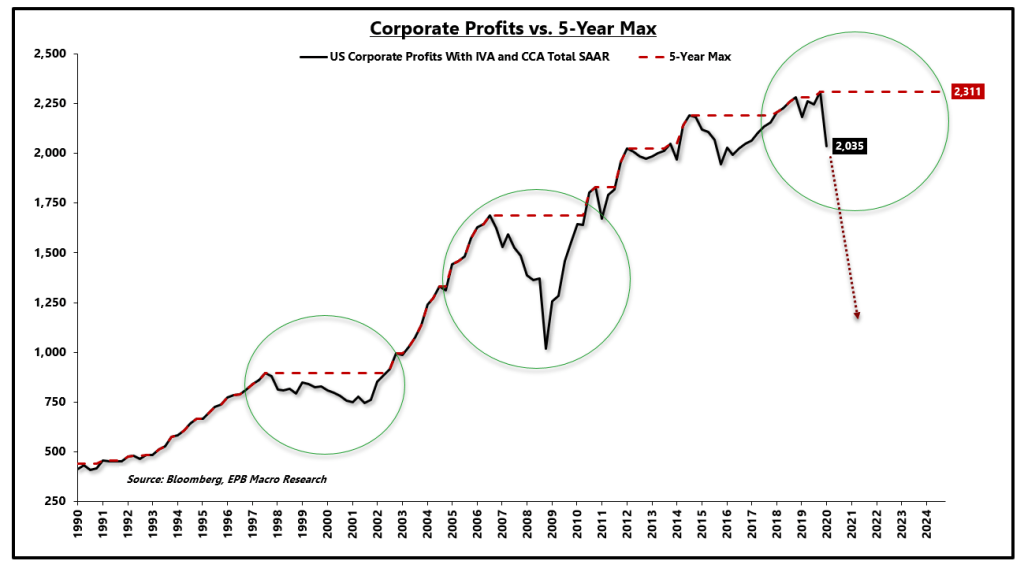
As mentioned at the start of this note, in addition to looking at EPS, we also look at pre-tax corporate profits for the entire economy, outlined in the NIPA. Pre-tax corporate profits are critical as a comparison to EPS as we can determine how much of the recovery in EPS was related to changes in taxes, share buybacks and other financial engineering methods as opposed to true profit growth reported in the real economy.
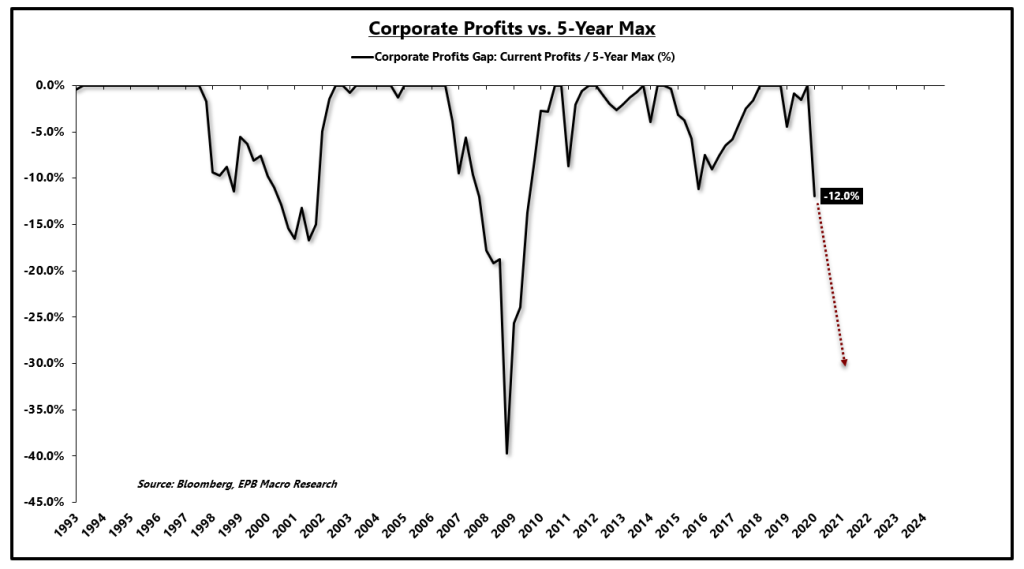
The chart below shows pre-tax corporate profits (in black) and the 5-year max of pre-tax corporate profits (in red). The chart ends as of Q1 2020, so the Q2 figures, updated in the next GDP report, will show a significant decline and a more considerable earnings gap.
Corporate Profits vs. 5-Year Max:
Source: Bloomberg, EPB Macro Research
Using the same method above to calculate the earnings gap, we can see both recessions, 2000 and 2008 caused a ~15% and ~40% drop in pre-tax corporate profits, respectively.
In 2015-2016, the US economy experienced a significant slowdown in economic growth, nearing recessionary territory, and economy-wide profits declined by about 10%, which came with a 20% decline for the S&P 500.
Corporate Profits vs. 5-Year Max: Corporate Profits Gap (%)
Source: Bloomberg, EPB Macro Research
The average recovery for pre-tax corporate profits from the three declines in profits mentioned above (2000, 2008, 2016) was roughly 4.25 years, about 50% longer than the same three periods measured via EPS (2.75 years).
As a result, we can conclude that EPS recovered faster than economy-wide corporate profits due to share buybacks, changes in tax rates, and other financial engineering games.
Let’s have a look at taxes below.
The chart below shows the effective tax rates paid by corporations, graphed with data from the NIPA. We plot taxes paid on corporate income divided by pre-tax corporate profits with data straight from the GDP report published by the BEA.
It’s alarmingly clear that effective tax rates have been plummeting over the last 30 years, helping boost EPS or after-tax profits in relation to the actual profit growth generated from top-line economic activity.
Profit Lever: Lower Effective Tax Rates (%)
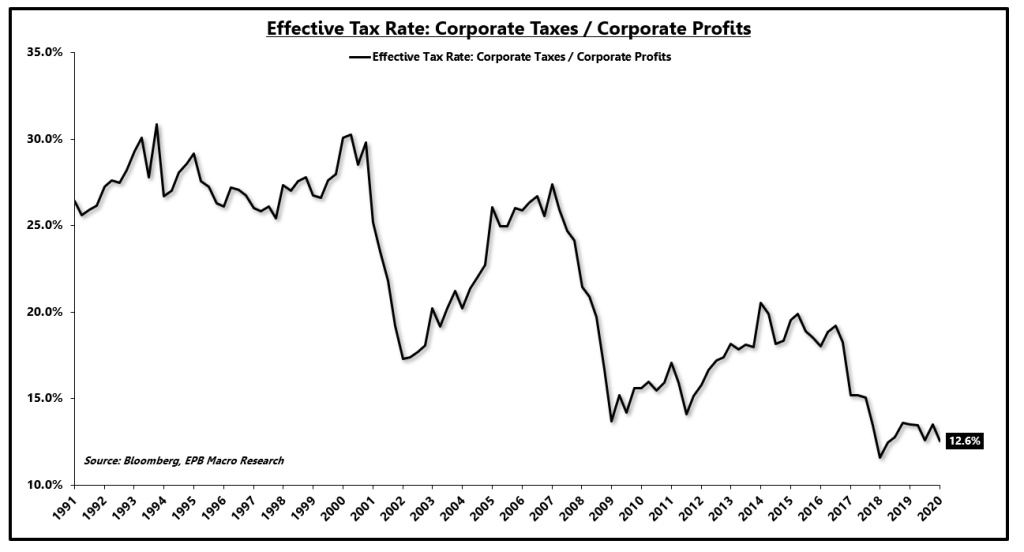
Source: Bloomberg, EPB Macro Research
Lower effective tax rates have been a significant profit lever, particularly around recessionary periods.
Taxes fell from nearly 30% at the end of 2000 to 20% at the start of 2004, helping close the EPS gap.
At the end of 2007, effective corporate tax rates registered 24% compared to 17% at the start of 2011.
Even after the quasi recession of 2016, tax rates fell to help close the EPS gap.
Effective tax rates declined from 18% at the end of 2014 to 15% by the start of 2017.
In other words, after the three largest declines in EPS over the last two decades, tax rates fell by an average of ~7%, which helped close the EPS gap in less time than it took for profits to recover in the broader economy.
With effective tax rates starting at ~13%, it will be much harder to pull this profit lever and close the EPS gap faster than broader economic profits, which took over 4.25 years on average in the prior three instances.
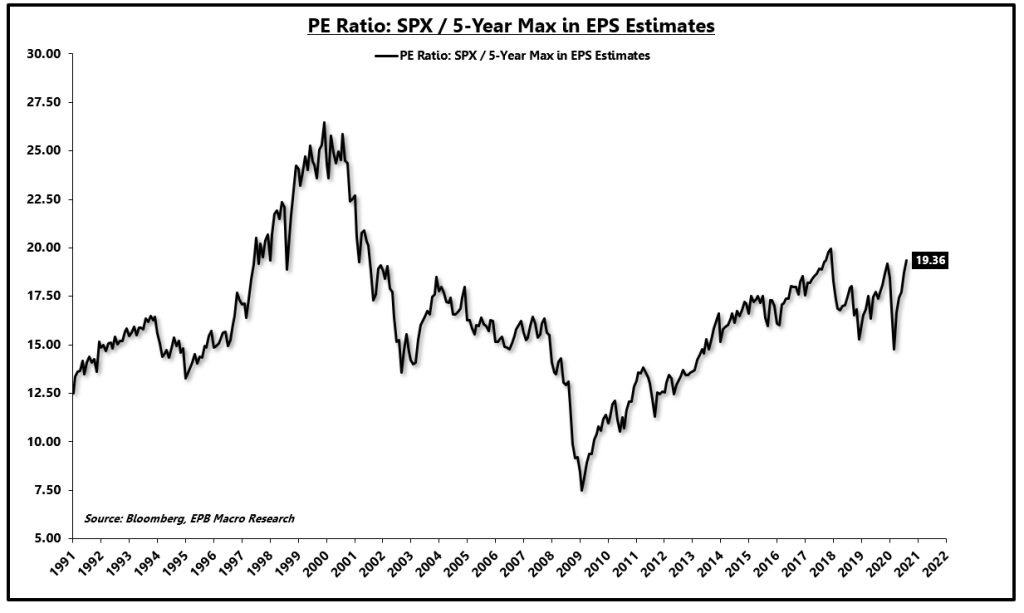
The chart below shows the PE ratio of the S&P 500, but using the 5-year max in EPS as the denominator as opposed to current EPS expectations.
At 19.36x, the S&P 500 is trading at more than a 20% premium to the long-term average of 16x based on this metric below.
PE Ratio: SPX / 5-Year Max in EPS Estimates
Source: Bloomberg, EPB Macro Research
Given that the market is trading at a substantial premium to the long-term average, it is fair to assume that the market is expecting the earnings gap to close in a timely fashion, similar to the ~2.5 year time table outlined in the prior three profit recessions.
Without the ability to pull the tax lever as significantly, this pushes the probably in the direction of the 4.25 year time table to close the earnings gap, outlined by pre-tax corporate profits.
One more consideration.
The earnings gap varies wildly based on the sector.
Technology has carried the S&P 500 higher and is responsible for the increase in earnings multiple while industrials, financials, and your common “cyclical” sectors have lower PE ratios.
The technology sector has earnings estimates that are only 4% below the all-time peak, while industrials are -57% and financials are -38%.
Earnings Gap: Technology, Industrials, Financials

Source: Bloomberg, EPB Macro Research
Technology may close the earnings gap within a year, while other cyclical sectors may lag behind. This phenomenon helps explain why technology is dominating the market gains, and cyclicals have underperformed, among other reasons outlined here.
The S&P 500 is against the clock. Overall, the market needs to close the earnings gap in a timely fashion to justify the current multiple. If EPS estimates reach the February 2020 peak within two years, the current rise makes sense as overlooking the COVID panic will have proved wise.
However, if corporations are unable to pull profit levers like the past, particularly tax rates, and there is permanent damage to the economy resulting in an earnings gap that takes closer to four years to close, then the market multiple is unjustified.
Technology is responsible for most of the market gains and the expansion of the average multiple. Cyclicals have been underperformers as the time it takes for them to close the earnings gap may well exceed the ~2.5-year typical recessionary time table.
The S&P 500 is against the clock and needs to deliver EPS improvements, moving closer to the $175 figure posted at the start of 2020.
A lot of things have to go right with the current valuation leaving an extremely small margin of safety.
I recently outlined my long-term expectations for S&P 500 returns in a note to subscribers of EPB Macro Research. While stocks still have a positive return expectation, the range of outcomes has shifted considerably below the historical average and thus, are not likely to adequately compensate you for the level of drawdown risk.
Equities are an essential part of a balanced portfolio and remain a holding of mine, sized according to the deteriorating expected risk-reward profile.
If cyclical earnings cannot recover, technology has a lot of heavy lifting left to do.
* * *
EPB Macro Research provides macroeconomic analysis on the most significant long-term and short-term economic trends, as well as the impact on various asset prices, including stocks, bonds, gold, and commodities. EPB Macro Research provides a low volatility monthly asset allocation model that translates the economic research into an actionable portfolio of ETFs. If you understand the economic cycle, you can profit from the opportunities that emerge from its ebb and flow. Click this link for a 14-day FREE TRIAL
via ZeroHedge News https://ift.tt/2CHv6tN Tyler Durden