A $1.1 Trillion Boost: Why JPM Sees Stocks Rising As Much As 25% Next Year
Tyler Durden
Wed, 12/09/2020 – 19:25
Back in July we showed that in the most typical of Wall Street CYA positions, JPMorgan was bullish, bearish and neutral on stocks all at the same time. This appears to have continued into year end because just last week, JPMorgan’s chief equity strategist Mislav Matejka cut his view of US stocks, downgrading the US to neutral (while upgrading Europe to Overweight). This was around the time JPM also unveiled its 2021 year-end price target for the S&P at 4,400, but came just as stocks swooned lower for a few hours perhaps explaining the sudden onset of bearishness.
In short, anyone trying to figure out what JPM really thinks may want to take a deep breath, and simply look at what the market is doing any any given moment to decipher what JPMorgan thinks.
In any case, with the S&P hitting an all time high above 3,700 on Tuesday (ahead of today’s sharp correction, which may lead to an entirely different hot take from JPMorgan’s crack strategist) one would be correct in assuming that any research reports out of JPMorgan published yesterday would be super bullish (after all, JPM has to convince as many clients as possible to buy whatever JPMorgan’s prop desk has to sell to them), and sure enough in the latest note from JPMorgan’s Nick Panigirtzoglou the bulls got yet another “justification” to keep buying stocks at all time highs. The reason: according to the JPM quant, 2021 will see a net improvement in stock demand/supply to the tune of $1.1 trillion, which of course should – in theory – lead to higher prices.
According to his goalseeked analysis, Panigirtzoglou writes that “for 2021 we see an overall improvement in equity demand of around $600bn relative to this year.” This projected improvement will be driven by incremental demand from retail investors as well as Sovereign Wealth Funds and Risk Parity funds. At the same time, JPMorgan also expects that “global net equity supply will return next year to the very low levels of 2016-2018, i.e. a decline of $500bn relative to this year, as share buyback/LBO activities normalize and the need for equity raising subsides.”
Here is the detailed breakdown of how he gets these numbers:
-
Retail investors demand will normalize next year to around $500bn from a negative -$50bn YTD. Why? Because as JPM explains, “first it is unusual for retail investors to be selling equity funds for two consecutive years. Second, the evidence from November is that the older cohorts of retail investors are abandoning their previous cautious stance, as, in November, they turned net buyers of equity funds delivering the first monthly inflow for the year. It is unlikely that the November pace of more than $100bn of equity fund buying will be sustained going forward, but we envisage just above $40bn per month for 2021, which is close to historical averages. So for the 2021 as a whole we anticipate around $500bn of equity fund buying, which would represent a sequential improvement of $550bn vs. this year flow.”
-
Institutional investors are seen as having “some room” to further lift stocks next year but more limited than retail investors especially since “certain institutional investors appear to have increased their equity betas in recent weeks, thus finishing the year with elevated equity positioning.” Therefore, JPM envisages rather limited sequential equity flow impulse between 2020 and 2021 for momentum traders, such as CTAs, Equity Long/Short hedge funds and Balanced Mutual funds. Of the $1.2TN in CTA assets, JPM assumes that a quarter is allocated to equities, and with a net $600BN flow to stocks in recent months, JPM believes that the equity positions by momentum traders or CTAs have very little room to increase from here in 2021, “and we are looking for at least modest negative flow impulse by them between 2021 and 2020.”
-
Equity Long/Short hedge funds are the biggest equity hedge fund sector with an AUM of $900bn and a typical leverage of around x2. JPM finds that their beta to stocks also rose sharply in November, and the elevated beta currently leaves room for a further bullish shift in 2020. For example, a beta change from 0.70 currently to a bit more bullish stance of 0.75, implies an equity flow of around $114bn for 2021 (after multiplying this beta change by their AUM x2 leverage). In terms of changes, i.e. compared to 2020, this represents a small flow deterioration of $114bn-$137bn=-$23b.
-
Risk Parity funds saw their beta to stocks fall from 0.59 in December 2019 to around 0.40 currently: “Multiplying this beta change
-
by their AUM x2 leverage implies a negative equity flow of around $60bn this year.” Looking into next year, JPM sees room for a reversal of the decline in the equity exposure of Risk Parity funds, pointing to positive flow of round $60bn in 2021. In terms of changes, i.e. compared to 2020, this represents a flow improvement of +$60bn-(-$60bn) = +$120bn
-
Balanced Mutual Funds, a $7tr universe of assets, has seen little market beta change for 2020, with a modest increase from 0.63 in December 2019 to 0.64 currently, implying very modest equity buying of around $50bn. Looking into next year, JPM sees little room for the equity exposure of Balanced funds to increase, pointing to another year of modestly only positive flow of around $85bn during 2020. In terms of changes, i.e. compared to 2020, this represents little flow improvement of +$85bn-$50bn=+$35bn.
-
Pension funds have been typically sellers of equities in the past years due to their structural shift away from equities and towards fixed income. 2002 has seen an interruption in that flow. For 2020 JPM expects net flows to have been effectively flat. Next year, JPM expects them to shift to a more typical stance of equity selling in 2021 of around half of its average since 2013 of $300bn per year, or a decline of around $150bn vs. the 2020 flat flow.
Meanwhile on the supply side, one way to gauge net equity supply is to look at the change in the free float of the global equity universe as captured by tradable indices such as the MSCI AC World index. Adjusted for price and fx changes, this change in the free float should capture the increase or decrease in the quantity of shares available to market participants in each period.
This proxy of net equity supply, shown in Figure 6, suggests that global equity supply had been most of the time positive in the past, as equity issuance and dilution activities tended to outweigh equity withdrawal activities at a global level. But this had not been the case between 2016 and 2018, as global equity supply had been close to zero or negative. In other words, between 2016 and 2018, there was a three years in a row of unprecedentedly low global equity supply. This was due to weak IPO and equity offering activity, coupled with stronger buyback activity, especially during the repatriation episode of 2018. During 2019 there was a big increase in equity supply due to an improvement in equity offerings including IPOs, but also a significant downshifting in share buyback activity in the US from the strong pace of 2018.
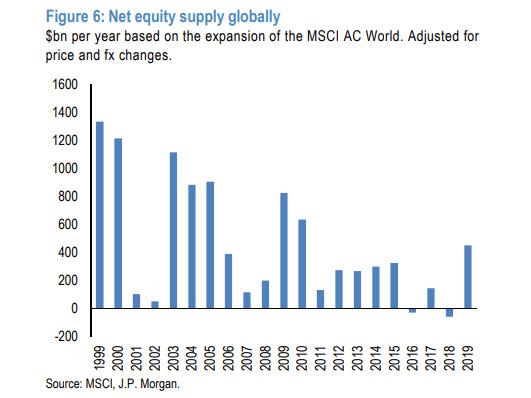
According to JPM calculations, this year global net equity supply has been close to $500bn, only slightly above last year’s supply and half of what the bank had previously projected for this year. This year’s overall equity withdrawal has held up much better than we had previously expected, as a sharper decline in announced share buybacks was more than offset by stronger than expected M&A and LBO activity. And while announced buybacks have declined, companies in strong financial condition, such as those in the tech sector, have continued to execute on previously announced buybacks to perhaps take advantage of lower equity prices during the first half of the year. In addition, the swing in equity dilution activities such as the exchange of common stock for debentures and conversion of preferred stock or convertible securities could have created a more benign equity issuance backdrop than that suggested by elevated announced equity offerings. In 2021, JPM expects further normalization in share buyback/LBO activity which, along with reduced need for equity offerings should help global net equity supply to return to the very low levels of 2016-2018. This view implies a large reduction in equity supply of around $500bn from this year’s pace.
So where does this leave us for next year in terms of the overall equity demand/supply balance?
Adding up all the demand flow changes between 2021 and 2020 and subtracting the supply change, JPM comes up with Equity Demand/Supply improvement of around $1.1 trillion in 2021 relative to 2020.
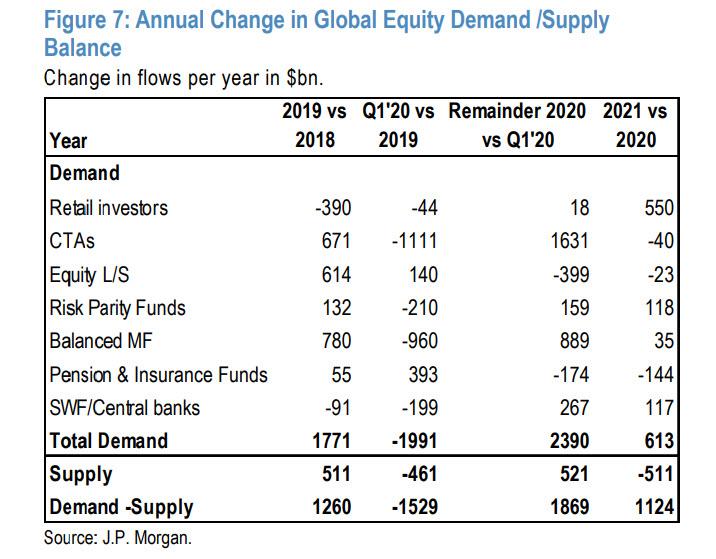
Why is this notable? Because this is similar to the equivalent Equity Demand/Supply improvement in 2019 relative to 2018, which at the time had seen global equities rising by around 25%.
via ZeroHedge News https://ift.tt/3gxxAu4 Tyler Durden