Record Hedge Fund Alpha Hit Was Followed By… Largest Ever Inflows To Silver, Tech Stocks
While stocks have clearly moved on from the short squeeze fireworks of the past two weeks, with the S&P trading at all time highs and the Nasdaq up 5% this week alone, the flows beneath the market’s surface were anything but calm at a time when we saw unprecedented hedge fund degrossing (or deleveraging) and subsequent releveraging.
According to Bank of America’s Michael Hartnett, who went through the latest EPFR data, equities saw a total of $9.1bn in inflows (broken down between $3.7bn into ETFs and $5.4bn into mutual funds), however not in the US, which saw $7.3 bilion in outflows, the most in 6 weeks. Other asset classes were also volatile with bonds enjoying $21.2BN in inflows, the largest in 17 weeks; precious metals saw the 6th largest inflow ever at $3.1BN, while the source of cash for all these new purchases were money markets: another $36.0Bn was pulled out of cash.
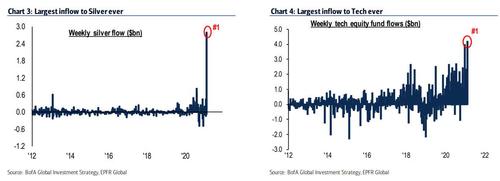
And while impressive, the most remarkable flows were the record $2.8BN inflow into silver, as well as the record $4.2BN into tech stocks “with big clients buying FAANMG underperformance”; EM debt also got some love with $3.7BN in inflows – the 4th largest ever.
Some more flow details, first looking at regional equity flows:
- European equities got small inflows at $0.1b
- U.S. stocks saw the largest outflows in 6 weeks at $7.3b
- Japan got inflows for the past 5 weeks with $0.8b
- EM equities got large inflows in past 19 of 20 weeks at $5.7b
By sector, it was mostly all inflows: tech saw $4.2BN, financials $1.3BN, real estate $1BN, energy $0.8BN; Only Communication services saw a tiney $0.2BN outflow.
Finally, by style among US investors, it was all outflows: value $0.2BN outflows, small caps $1.9BN, large caps $7.6BN, U.S. growth got $2.1BN.
In retrospect, and excluding the massive inflows into silver and tech, one can argue that the flows could have been even more volatile, considering the gigantic shifts in hedge fund portfolios experienced over the past two weeks, summarizes by Morgan Stanley:
- Performance – The average global fund ended Jan down ~70bps and the average US L/S fund was down -2.3%, but all strategies have been able to post gains thus far in Feb, led by US L/S funds who are up +2.9%
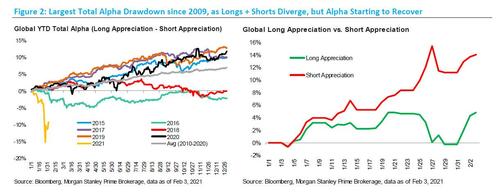
- Alpha – HFs have been able to generate ~6% of positive total alpha since Wed, from both the longs and shorts working; however, the spread between global longs and shorts remains at -9.4% YTD
- Crowding – Like alpha, the spread between the crowded longs and shorts has also rebounded
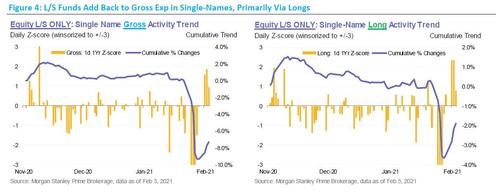
- De-grossing trend – The de-grossing began to slow last Thurs, and at the start of this week, HFs began to add back to gross, particularly on the long side
- Leverage – In line with the long adds, Morgan Stanley has seen a recent uptick in US L/S nets to 63% (highs since 2010), while gross has been more stable at 198%
Drilling down a bit more into some of these, we find that after a record hedge fund alpha drawdown, total alpha has made a strong recovery following last Wednesday, with the spread between longs and shorts at +5.9% over the five day stretch through Wednesday. Thursday was the best day for total alpha over the past decade, with shorts having a very strong day – total alpha on the day was +4.6%.
According to Morgan Stanley, longs have been the main driver of the recovery since Wed, as they are up +4.7% vs. the MSCI up +1.6%. Long side performance remains particularly important to HF performance given net leverage is above the 90th percentile for Equity L/S funds. Shorts have also contributed to the positive alpha since Wed, as they are down ~1.2%. And yet despite the recent recovery, total alpha is still off to its worst start in a decade at -9.3%.
Digging down some more into HF performance, MS calculates that performance recovered in the early days of Feb, led by US equity L/S funds; Of course January was worse and through the end of the month, average performance across most strategies was negative, led by US L/S funds who were down ~2.3%, which compared to the S&P 500 down -1.0%. At their worst, the average fund was down closer to ~2.8% through Wed (1/27), so they were able to make back a little at the end of last week, despite the S&P tracking lower over the two final days of the month.
Since then, HFs have been off to a strong start to the month of Feb, with the average Global fund posting gains of +2.0%, while the average US L/S fund has led at +2.9%. All strategies have posted gains MTD, with the average Europe-based fund up +1.7% and the average Asia-based fund up +3.1%.
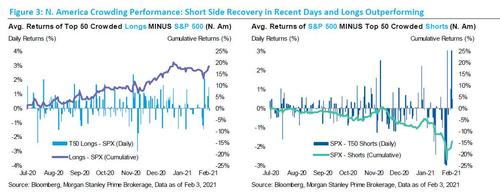
In line with the performance recovery across Global L/S positions, the crowded stocks in N. America have performed well since Wednesday as the top 50 crowded longs are up ~6.7% while the crowded shorts are down ~7.9%. Much of this came on Thursday, with the +8.0% spread between the top 50 crowded longs and shorts being the largest spread seen since MS began tracking the data in 2010.
What about terms of leverage and exposure? Well, the de-grossing that took place at the start of last week seemingly began to slow on Thursday, before flipping back to gross additions at the start of this week. While the recent gross additions have done little to offset all that was taken off last week, there has been a notable shift in trend on both the long and short side. The gross additions this week have come primarily on the long side, with L/S funds responsible for the majority of the activity. Shorts have also been added over the past three days, just in smaller magnitudes. In terms of where the long additions have come at the sector level, the majority have been added in TMT-related industries, though L/S funds have also added to Financials and Industrials longs this week. As for the short additions, they have been spread across most sectors, though it’s worth noting, that HFs have been covering ETF shorts this week.
Tyler Durden
Fri, 02/05/2021 – 15:00
via ZeroHedge News https://ift.tt/3pT65PB Tyler Durden


