Are Yields About To Blast-Off: Here Are The 3 Things To Watch
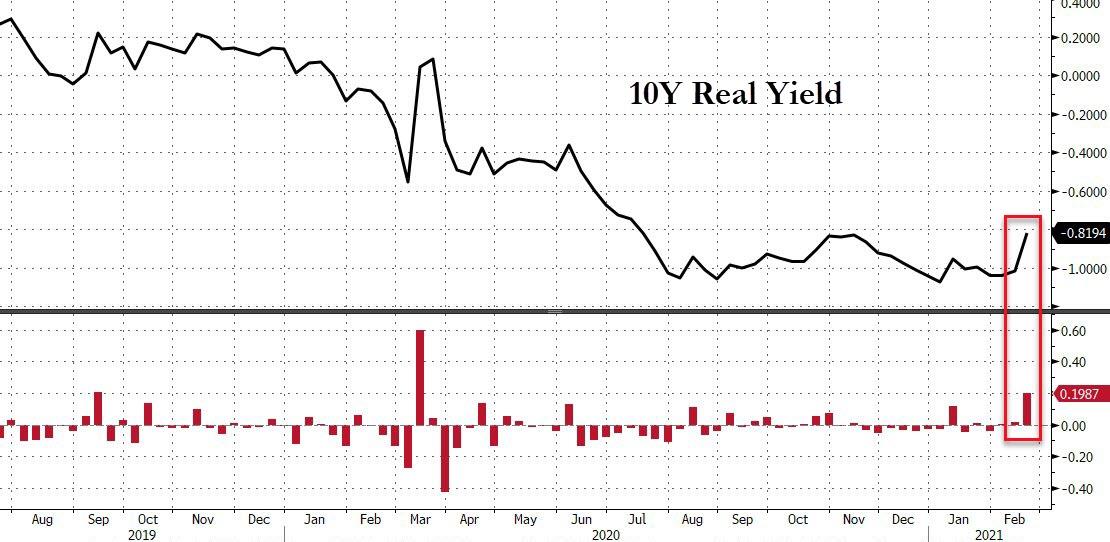
For many months, traders and strategists have been warning – and dreading – a sharp spike higher in both nominal yields and real rates, and last week they finally got it with Real Yields finally surging the most since March…
… and joining the historic post-covid rally in Breakevens…
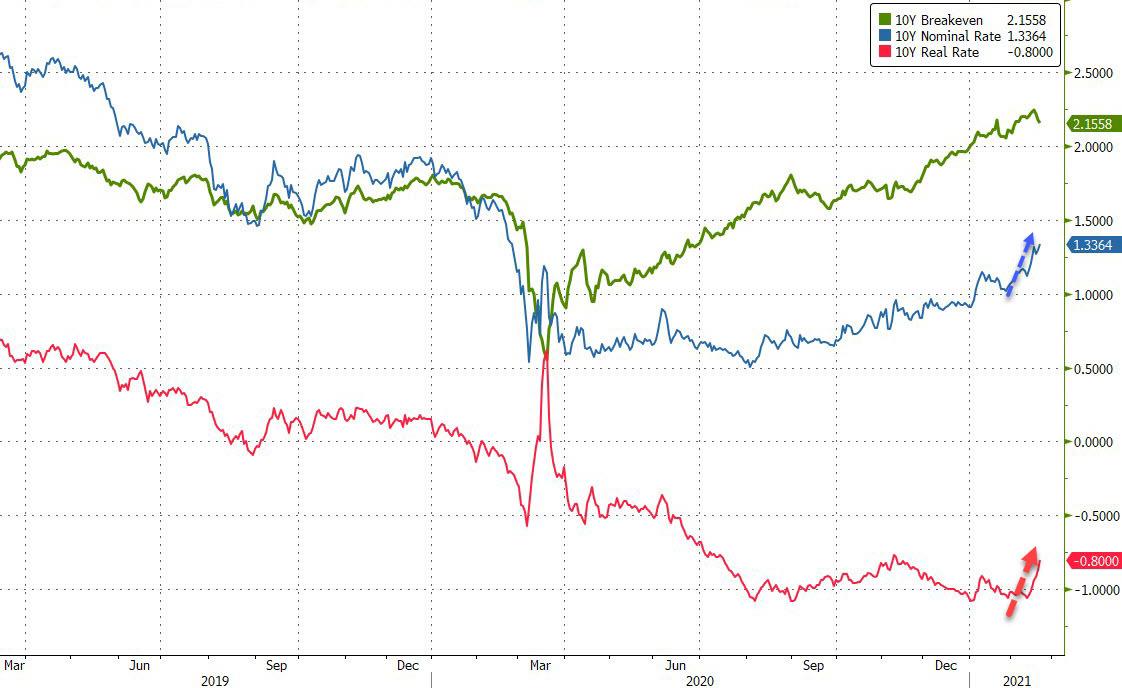
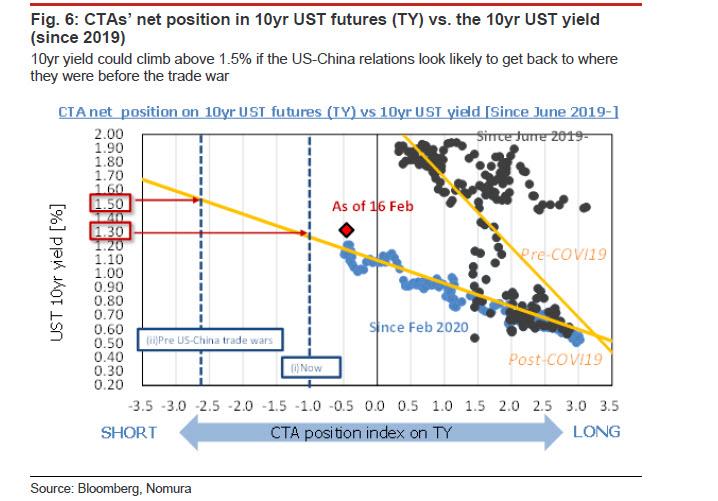
… sent 10Y yields to 1.36% the highest level since the pandemic and just 14bps away from the 1.50% level that Nomura predicted would hammer stocks as systematic, quant and CTA funds start actively shorting 10Y futures.
And, with Treasury yields finally busting out of long-held ranges to levels last seen in the early days of the pandemic Bloomberg writes today that “the obstacles to higher yields in the world’s biggest debt market are slowly melting away” a theme echoed by Morgan Stanley which writes in its Sunday Start that there are three catalysts for a reflationary overshoot loom over the next month: i) Falling COVID-19 cases/hospitalisations; ii) Passage of US fiscal stimulus; and iii) Accelerating global growth.
Of course, the question is how much higher, and will growth names in particular, or the broader market in general, get hammered?
“The threat of higher borrowing costs is already looming over risky assets, from U.S. shares to emerging-market securities. So far, the pace of increase doesn’t appear to be alarming Federal Reserve officials, but traders will be monitoring Chair Jerome Powell’s testimony to Congress next week for any sign that he’s troubled by steeper long-term borrowing costs. Barring any such hint, the market is left to ponder the extent to which the reflation trade will drive up yields.”
“Before the pandemic, the 10-year yield was trading at about 1.6%, and if we are going to get back to what the economic situation was – give or take – back then, then there’s no reason why yields should be lower than that,” said Stephen Stanley, chief economist at Amherst Pierpont Securities. Stanley, together with many of his peers, forecasts the 10-year yield will end the year at 2%, a level last seen in August 2019.
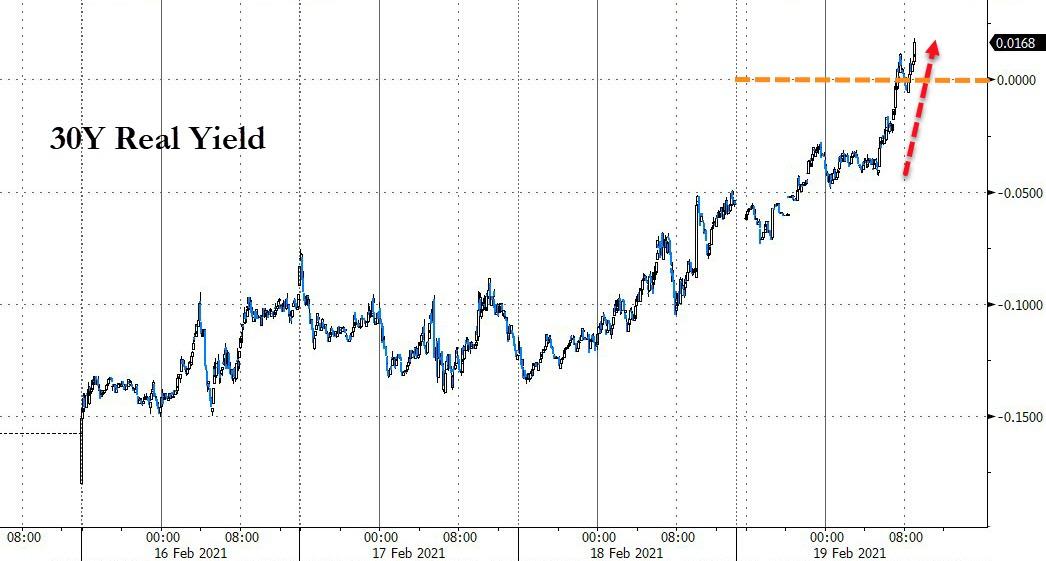
While the biggest driver of rising nominal yields in the past year has been the surge in breakevens – buoyed by rising commodity prices and, more recently, surging CPI, in the last week the market has also started watching real yields, which strip out inflation and are seen as a purer read on the growth outlook. As we showed on Friday, real rates reached an important milestone, with 30Y real yields rising above zero for the first time since June.
This, as Bloomberg’s Liz Capo McCormick writes, “is potentially an issue for risky assets as real rates are viewed as a gauge of companies’ capital costs.”
Putting the move in context, the median forecast in a Bloomberg survey is for 10-year Treasury yields to reach 1.45% in the fourth quarter (although the average is well higher due to several notably higher outlier predictions). Zachary Griffiths of Wells Fargo sees the rate between 1.3% and 1.5% by mid-year, with the low end possible if vaccine distribution falters or additional Covid-19 challenges surface.
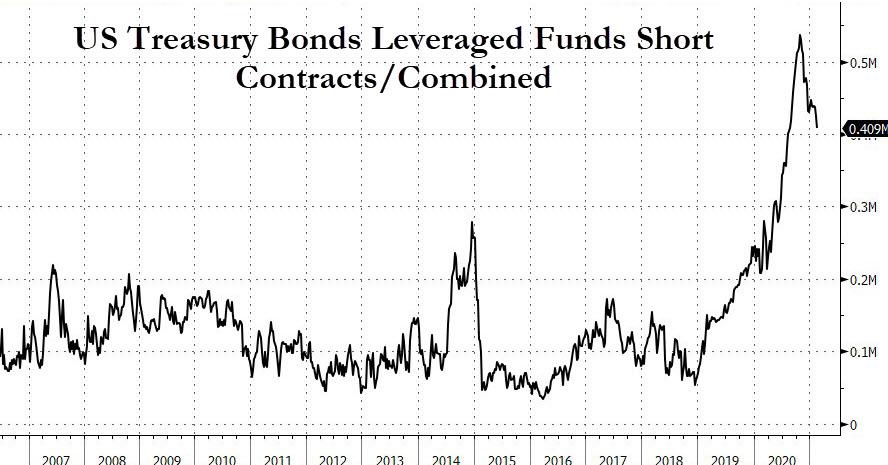
To be sure, not everyone believes that the surge in yields will be a one way street. In the past two months, the record net short interest in Treasury futures and options across the leverage fund community has fizzled somewhat…
… while several prominent big bond bulls still expecting lower yields. Robert Tipp, chief investment strategist at PGIM Fixed Income warns the 10-year yield could sink back to around 1% by year-end. He also said that inflation expectations have risen too far (although if we are indeed at the start of a commodity supercycle, inflation expectations will rise much, much higher) and markets may also be ignoring that the economic boost from government stimulus will eventually fade, he says.
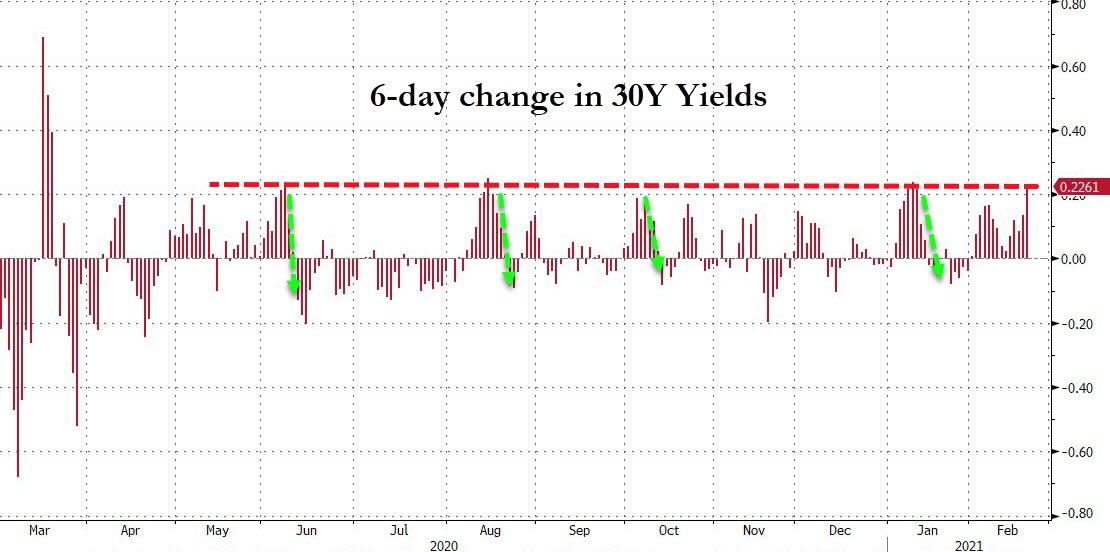
Here it is also worth pointing out that any time 30Y yields have sold off as aggressively as they did this week in the post-Covid era, they have always retraced much if not all of the move.
In any case, as Bloomberg further notes, bears have to watch various other bond market dynamics starting with international investors, who may step in to buy at some point, especially given currency-hedged returns have jumped, making it more attractive for Japanese investors to now buy US paper than, say, Italian debt. There is always the nuclear wildcard: any violent surge in long-term borrowing costs that tightens financial conditions or sparks illiquidity, would almost certainly see the Fed intervene and either boost asset purchases or implement Yield Curve Controls (which is essentially the same).
To be sure, so far there has been little hint of concern from the Fed (although the Fed is notorious at being dead wrong about everything, and then reacting to market moves long after they should have acted proactively). Take the always clueless New York Fed President John Williams who on Friday said rising yields show optimism toward the recovery.
Others echoed Williams’ view: “The reflation trade is going to stay,” said Chris McReynolds, head of U.S. inflation trading at Barclays Plc. “We’ll of course continue to see volatility around inflation expectations and actual inflation prints themselves. But you have to take the Fed completely at their word, that they are going to be behind the curve” in tightening policy even as the economy and inflation pick up.
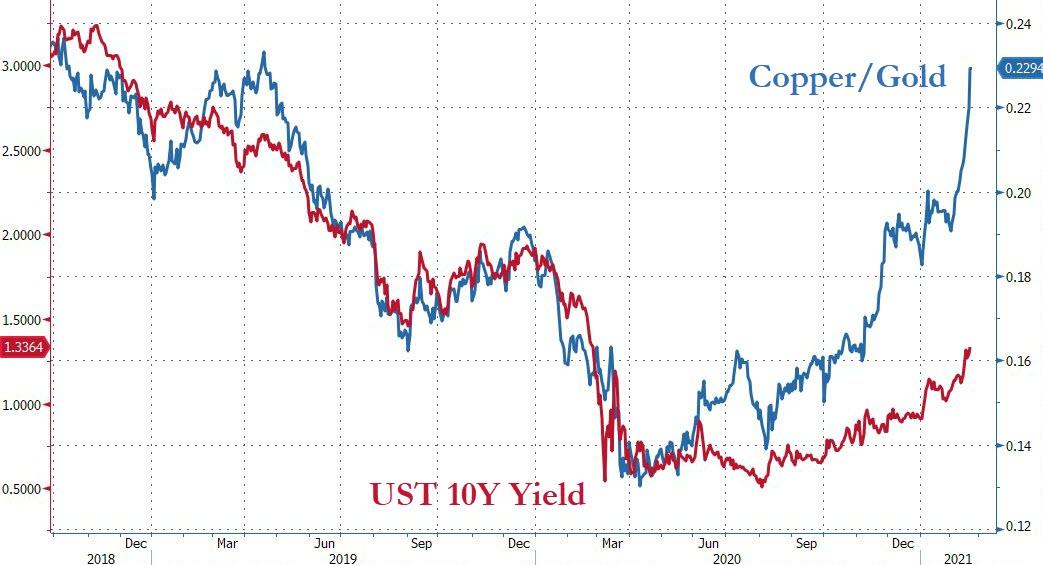
There’s a clear market signal backing the view that the Fed is ominously behind the curve: as Capo McCormick writes, the sharp rise in the ratio between the prices of copper and gold, which has a solid track record predicting yields. The relationship typically works because copper is a cyclical commodity, and gold is a haven that’s sensitive to inflation and rates. A quick look at the chart below suggests that 10Y yields should be at whopping 3.0%!
In a Friday note from Morgan Stanley’s Andrew Sheets, the cross-asset strategist writes that the debate of “how much of a risk are higher rates” has been at the top of investors’ minds, and will remain so, although he is not forecasting a major rate move because in falling back to a traditional Wall Street justification, Sheets writes that “higher yields and breakevens suggests better growth, providing a potential offset of a higher discount rate. In Gordon Growth Model terms, better growth can allow investors to imagine ‘g’ rising faster than ‘r’.”
It would be one thing if our global macro strategists thought that our above-consensus growth forecasts would lead to a major overshoot in yields. But they don’t. They forecast the US 10yr at 1.45% by year-end. That’s higher from current levels, but not wildly so, as they think that ample liquidity and ‘cash on the sidelines’ will pull in bond demand at (modestly) higher yields.
That sanguine outlook certainly looks out of step with the recent rise in market fears about higher yields as demonstrated by the spike in the MOVE bond volatility index, which after trading near all-time lows has broken out in the past week.
Amid all these conflicting signals for where bond yields go next, Morgan Stanley listed 5 signposts to follow that would provide some early indication if “a much larger move in yields or Fed policy was afoot.”
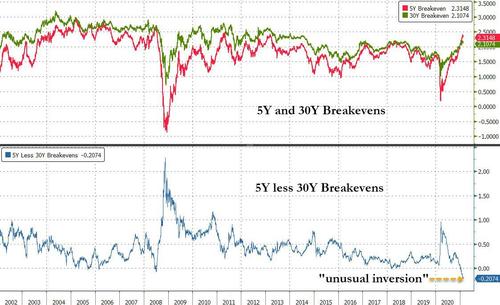
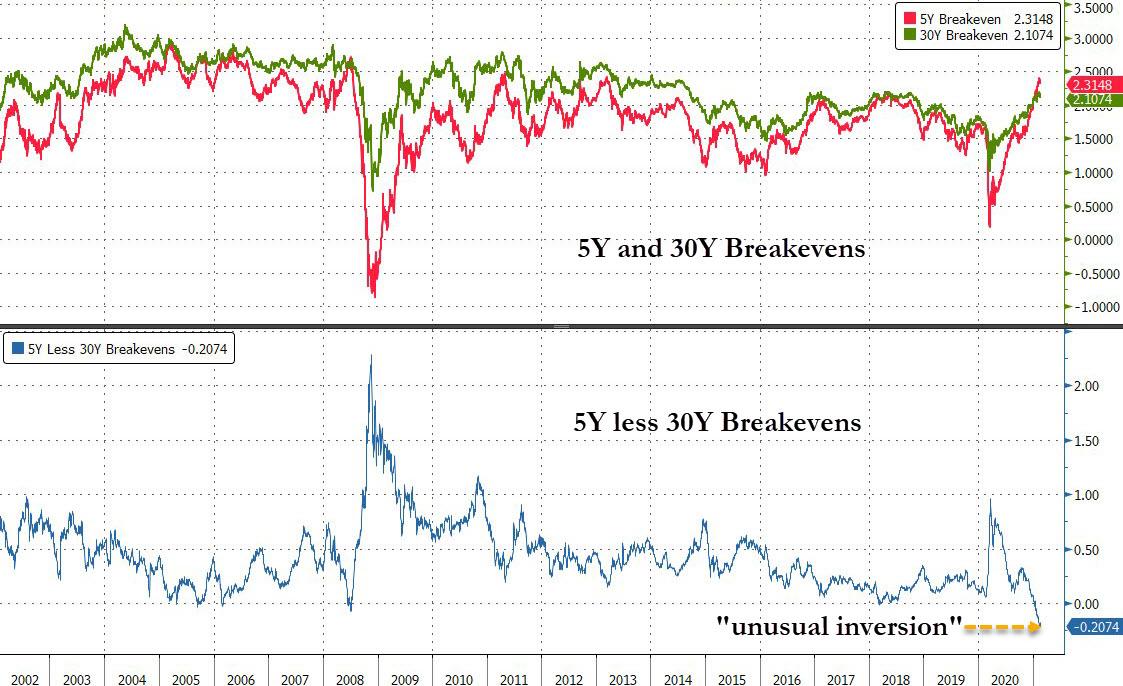
- The inflation curve: One catalyst for this could be a scenario where inflation rose in a larger, sustained way. At the moment, this is not what US inflation expectations suggest. Markets expect (CPI)inflation to run at ~2.3%Y for the next five years, but 2.1%Y for the next 30 years. This would seem ideal from the Fed’s perspective; inflation rising in the near term, and then moderating. It is the opposite of a scenario where inflation spins out of control. This inversion is ‘unusual’, i.e., it’s not simply a function of quirks in the usual market pricing.
- Rate volatility: Expected volatility in interest rate markets also remains historically low (even after the recent rise show above in the MOVE chart). For non-rates investors, two reasonable questions are “will inflation get out of hand?” and “will rates get unusually volatile?” For the time being, the answer to both appears to be “no.”
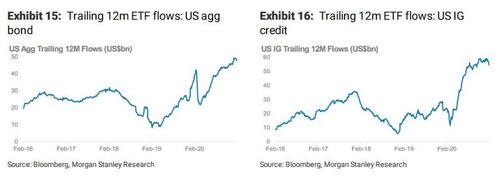
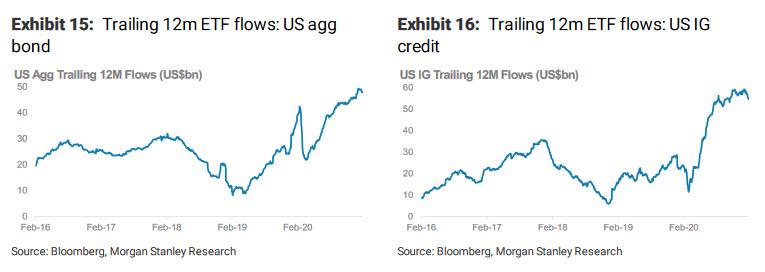
- Investor fund flows: A third channel of risk would be higher yields causing investors to sell fixed income holdings, driving a cycle where weakness brings more weakness. So far, however, ETF fund flow data suggest little such activity. Focusing on US aggregate bond and US investment grade bond ETFs, cumulative flows remain near the highs.
Of the three list above, the first and last are slow-moving indicator, leaving the aptly named MOVE index as the best real-time measure of potential runaway yields.
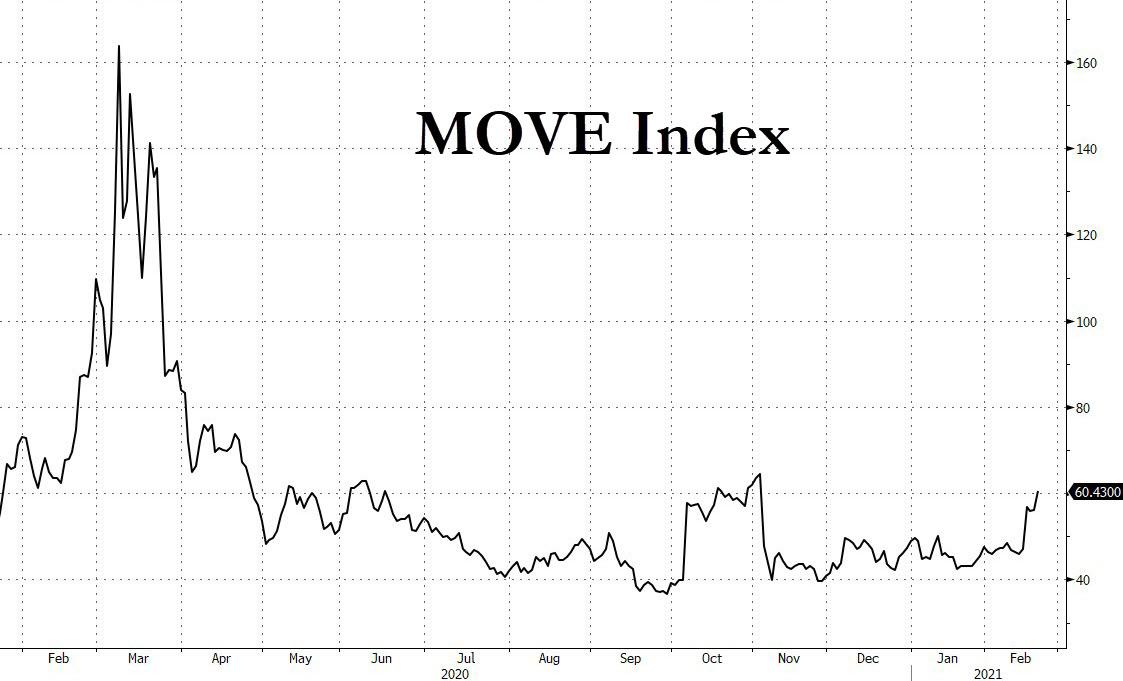
So for all those concerned about a liquidation keep a close eye on the MOVE: should the current spike accelerate higher, not only are even higher yields coming, but should the 1.50% barrier be breached, the selloff will then quickly shift over into stocks.
Tyler Durden
Sun, 02/21/2021 – 17:45
via ZeroHedge News https://ift.tt/3usVmhF Tyler Durden