Why Have Bond Yields Gone Nowhere In The Past Month Despite Blowout Macro Data: Here Is Goldman’s Answer
After a turbulent start to the year for the treasury market, which posted its worst quarterly total return since 1980 as 10y Treasury yields rose more than 80bp, leaving markets to consider just how much further yields might move once the expected economic acceleration went from forecast to fact, Treasuries have found themselves stuck in a very narrow range, gripped by an eerie calm even as the US economy continues to power ahead and is on pace for the strongest expansion in GDP since the record Q3 of last year.
However, hile one can analyze CTA flows, extrapolate Japanese pension positioning and even speculate about stealth central bank intervention in seeking an answer for the recent bond market calm, there may be a far simpler reason why bond moves have fizzled out even as economic surprises continue coming hot and heavy: as Goldman’s William Marshall writes, yield sensitivity to data surprises tends to decline at higher levels of forecast uncertainty – a key feature of the macro environment since the onset of the pandemic. As a result, until there is some convergence in projections, “yield responses to data releases may remain muted by historical standards.”
Let’s back up.
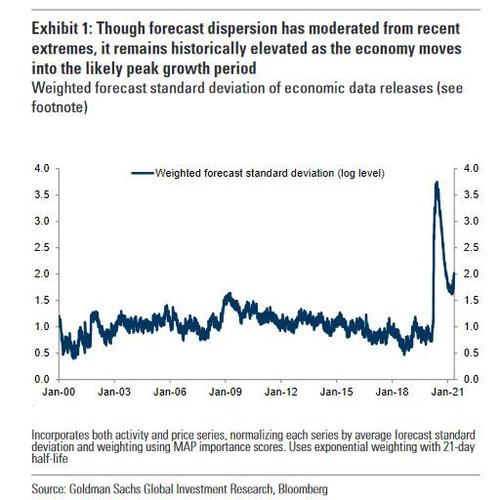
As Marshall notes, after a torrid first three months of 2021, and despite a continuation of positive surprises across a range of significant releases last month – including payrolls, CPI, and retail sales – US yields finished the month lower on net, with yield responses to the data surprises ranging from muted to puzzling. A feature of data releases since the COVID shock has been and remains the high degree of forecast dispersion, which at this point likely reflects the range of views on both timing and magnitude of the acceleration.
This week brings the first look at April data, with economists projecting even stronger job gains (consensus is now just around 1 million new jobs) Goldman takes a look at the likely responsiveness of US rates to data surprises in this environment.
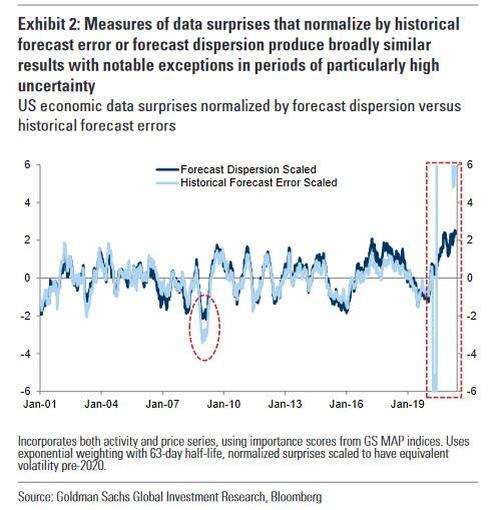
In tracking the evolution of data surprises, the standard approach is to normalize individual releases by some measure of historical forecast error. This approach helps in providing historical grounding for the magnitude of a given surprise. However, in periods where data is somewhat more volatile than normal — such as at present —using realized forecast errors may significantly under-represent the degree of uncertainty around individual releases. For markets, identifying the level of perceived noise around economic data is useful in gauging how much of a signal a given data point can provide. To this end, using forecast dispersion to normalize data surprises(rather than historical forecast errors) may provide a better picture of the information content in a particular release for markets by directly capturing the level of uncertainty surrounding the print. In general, both approaches (the more standard normalization by historical errors or normalizing each surprise by Bloomberg forecast standard deviation) produce highly correlated results until 2020; however, the last year or so and to a lesser extent the period around the GFC stand out as notable exceptions as shown in the chart below.
Intuitively this makes sense: if the underlying data volatility is orders of magnitude higher than some “calm” baseline, the information value of every outlier print is reduced exponentially as the very next month we may see a sharp reversal.
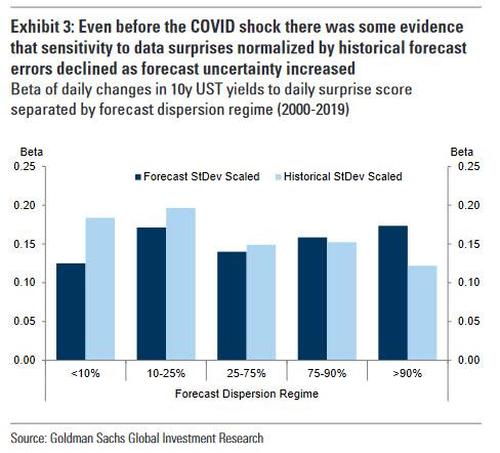
To gauge how markets respond to data surprises in different forecast uncertainty regimes, Goldman regressed daily yield changes on daily surprise scores, splitting the sample into regimes of forecast dispersion using the series shown in Chart 1. Pre-COVID (2000-2019) evidence suggests that when forecast dispersion is relatively high, the beta of yields to data surprises normalized by historical forecast errors is somewhat lower than in periods where forecast dispersion is low.
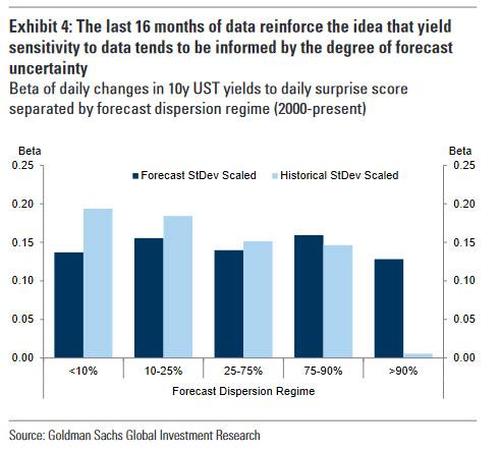
Meanwhile, the relationship between yield sensitivity to surprises and the level of forecast uncertainty is less apparent when scaling surprises by forecast dispersion. An interpretation of this initial observation is that periods of higher forecast uncertainty tend to be associated with lower sensitivity of yields to data by historical standards. Expanding the sample to include the last year firmly reinforces this pattern.
So what does this mean? Here is some more analysis from Goldman guaranteed to make your brian bleed as it tries to put in scientific terms what is ultimately a very simple concept:
There is a clearer negative relationship between forecast uncertainty yield sensitivity to data surprises normalized by historical standard errors, particularly when forecast dispersion is in the top decile. Normalizing by forecast standard deviation, meanwhile, generates somewhat more stable sensitivities across forecast dispersion regimes, suggesting that the impact of a given data surprise on yields is more reliably informed by the level of uncertainty around any given release — what may be a market-movingsurprise in the context of low levels of dispersion among forecasters is little more than noise when said dispersion is high.
Got all that – it certainly is a smarter way to say that data no longer matters…
Anyway, the simple implication of all this is that for now – until the data volatility returns to normal – it’s likely that yield sensitivity to data will be muted by historical standards, owing to the wide range of expectations (e.g., the standard deviations of forecasts for April non-farm payrolls is more than 3x its historical average).
That is not to say that data won’t matter — US rates rallied on the back of the softer than expected ISM manufacturing earlier this week, and in the accumulation of better than consensus data will take yields higher into mid-year (and vice versa). However, it likely means that more historically “normal” yield responses to data will require some amount of convergence among forecasters, instead of the prevailing “throw a dart at the wall” chaos.
It’s reasonable to expect that convergence to occur later this year, though that may take place in the context of less volatility in the data itself. In other words, don’t be surprised if we get an absolute blowout beat (or miss) tomorrow, and the 10Y does… nothing.
Tyler Durden
Thu, 05/06/2021 – 19:50
via ZeroHedge News https://ift.tt/3b85Fj2 Tyler Durden


