We Are Now Deep “Mid Cycle”: What Does That Mean For Markets
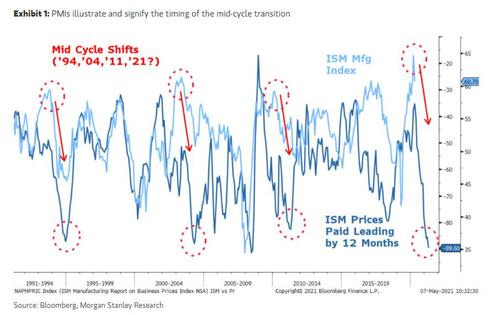
Just days after Morgan Stanley said that it “rather than getting excited about the reopening, we are getting more concerned” pointing to the infamously volatile mid-cycle transition, when the the peak rate of change reverses and execution risk jumps as visualized by the following chart showing headline Manufacturing Purchasing Managers Index and Prices Paid component…
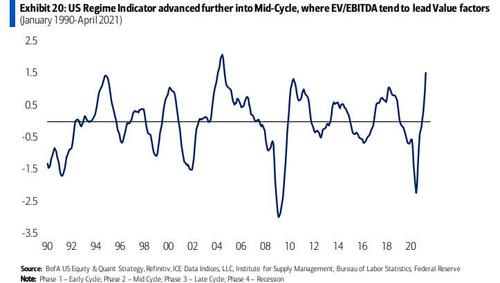
… BofA has jumped on board the mid-cycle bandwagon, and in a note from the bank’s chief quant, Savita Subramanian, she writes that the bank’s regime Indicator rose to highs seen only once before in the last 30+ years: in Feb. 2004, after which Mid-Cycle continued for four more months.
Does this mean that the end-cycle – which is quickly followed by recession – is imminent?
According to the BofA quant, “historically Mid-Cycle has lasted for 12 months, but today we are just four months in. Thus, the current phase could extend at least through summer and potentially beyond.”
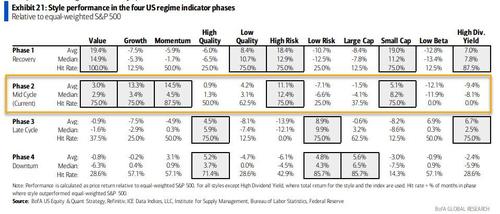
What does this mean for investing? Mid-Cycle is usually accompanied by rising interest rates and capex: thus valuation metrics which account for the firm value to incorporate more expensive debt, and profitability that reflects capex are important. P/E and Price to Book are less effective, but EV/EBITDA has outperformed the index 75% of the time in this phase (and today EV/EBITDA positioning is close to a record underweight.) Additionally, “quality value” tends to outperform “deep value” in this phase. And if we have reached peak stimulus, quality should outperform from here to the detriment of other factors.
Picking up on this, Leuthold Group’s Jim Paulsen, who has analyzed bull cycles of the past 40 years, notes that while every bull market is different, “the pattern they follow is usually the same: a strong run at the start of the cycle, a period of hesitancy that lasts a year or more, then the resumption of the advance”, or a crash, of course, assuming no Fed bailouts. While we don’t know what the endgame is, we agree with Bloomberg that are now “at the pause stage of the current cycle right now.”
In any case, describing the Mid-Cycle, or as he calls it the Revaluation phase, Paulson notes that’s when corporate performance continues to improve but valuations get stretched and the pressure of rising yields intensifies. That’s when stocks go nowhere for a year at best or decline by low-double digits at worst. And sure enough, as Bloomberg notes, the checklist of signals that led to prior swoon periods is here: rising valuations that have almost doubled from a trough, improving corporate performance and yields.
Some examples:
- In 1982, the stock market posted a sharp rally as profits and bond yields continued to decline. A 15% correction into mid-1984 followed, leaving the S&P 500 essentially flat for that year. The next year, earnings started to recover and bond yields went up.
- In 1992, earnings and yields declined heading into the 1994 mid-cycle, when the S&P fell by nearly 10% in early 1994 and stayed flat until 1995.
- A similar pattern occurred in 2004, when the S&P 500’s multiple declined from 22 times earnings in late 2003, to less than 17 times by late 2004.
- After an initial recovery in the spring of 2009, the S&P 500 stumbled as stocks underwent a 15% correction in the second quarter of 2010.
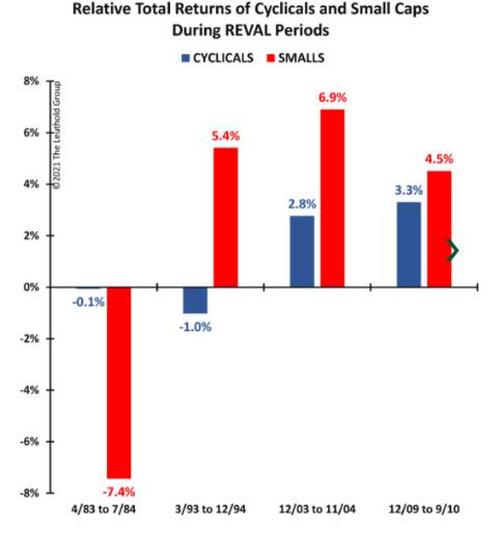
Finally, how did economically-sensitive sectors fare during the revaluation period? As Bloomberg notes, small-cap stocks gained in three out of four pause stages, adding on average 5.6%, after falling more than 7% during a pause period between the spring of 1983 and summer of 1984. Cyclicals gained in two out of four instances — in 2004 and 2010, when they posted a modest advance that exceeded the broader peers.
Tyler Durden
Wed, 05/12/2021 – 12:55
via ZeroHedge News https://ift.tt/3o8XQyT Tyler Durden


