$15 Billion In Inflows Every Single Day: Goldman Bets It All On A Meteoric Year-End Meltup
Markets are having a bad day, with yields and the dollar surging, long-duration and tech names crumbling and cryptos in freefall. But according to Goldman trading desk, today is just a minor blip against what is likely to be a meteoric meltup in the year’s remaining 28.5 trading days.
As Goldman’s flows guru Scott Rubner – who works in the Global Markets Division and whose work does not reach the bank’s institutional clients (at least not directly) – writes over the weekend, the melt-up which he correctly predicted on four previous occasions (here, here, here and here) will continue due to several secondary reasons and one giant one:
We are entering the best seasonal trading period of the year heading into Thanksgiving, weakness into OpEx expiry is nearly behind us, long gamma $4700 pin rolls off on Friday and GS corporate buyback desk execution flow accelerated +40% w/w. Fund flows are roaring and not slowing. $2.4 Trillion worth of option notional rolled off Friday. The market can (now) trade freely next week, especially to the upside.
And the punchline: all this “is in addition to >$15B worth of non-fundamental equity demand every day VWAP from 9:30am to 4pm.“
Rubner then notes that the #1 question to hit his inbox this week is “what happens if there are no outflows in 2022 and global equity inflows continue? The #1 question that happens at Thanksgiving dinner from the retail traders. What yolo call options have you bought for me lately?”
And yes, Monday’s selling is unpleasant (for the bulls) but consider the context – the S&P 500 (and NDX) closed at a new all-time high last Thursday and blasted off to tip a fresh ATH on Monday morning before reversing. This means that the S&P 500 has made 66 new all-time highs this year or 1 new ATH for every 3.37 trading days. This is on pace for the second best year on record, only after 77 ATH in 1995.
With that in mind, here is the latest thread from Rubner explaining why today’s action will be promptly forgotten in the coming days as the year-end meltup takes over:
- 1. There are 28.5 trading days left in 2021 and the S&P is up +25.15% YTD.
- 2. Thanksgiving is this Thursday. This is a big vacation week for clients. I expect volumes to be robust on Monday and Tuesday and then drop-off materially given holiday schedule.
- 3. By my count, this is the least number of market holidays that we can have during December and January. (ie there are no half days in December and there is no exchange holiday for new year’s day).
- 4. I expect more and more clients to take off the last two weeks of the year given how the holiday falls vs. just the last week of the year in normal years. Many investors haven’t taken a vacation in 1+ year.
- 5. Friday December 30th is the last day of the year for 2021 and the following Monday January 3rd, the scoreboard gets reset to zero zero. This will happen quickly from here.
The January Inflow “wall of money” is the most important dynamic that I am tracking in the market right now
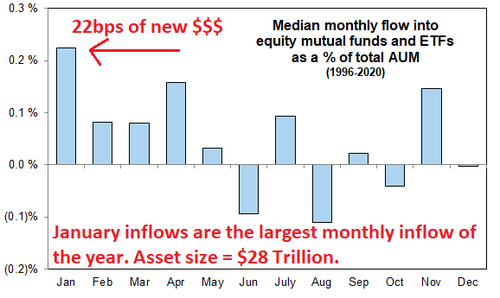
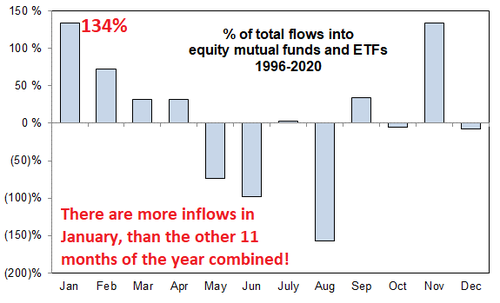
- 6. January typically 134% of the yearly flows. The #JanuaryEffect will be important.
- 7. 22bps of new money (not including money leaving bonds or cash) comes into the market every January. This is $62 Billion of new money.
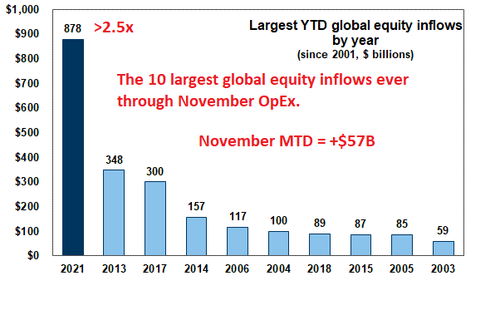
- 8. 2021 has averaged roughly doubled the 25 year average, or $125 Billion.
- 9. Core thesis is that money will come out of negative real yielding cash and out of bonds aggressively and early in 2022 following December board room asset allocation meetings.
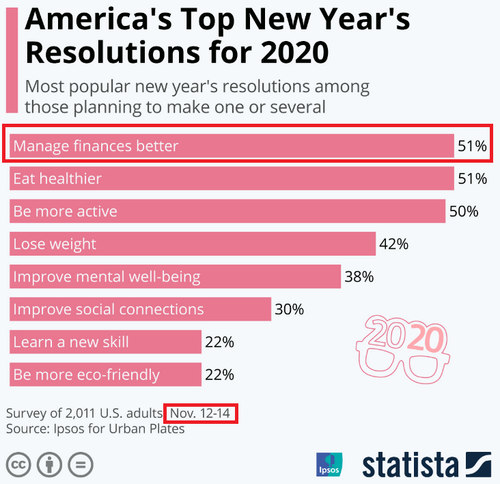
What is the #1 Top New Year’s Resolution? “Manage Finances Better” When does that happen? January. How often does it happen? Usually 1x time.
10. From 1996 to 2020 (25 year period), January has seen +$239 Billion worth of inflows cumulatively over the 25-year period. See below.
11. From 1996 to 2020 (25 year period), all other months (the next 11 months) have seen -$60 Billion worth of outflows cumulatively over the 25-year period.
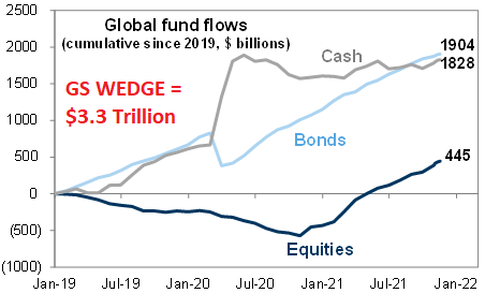
12. Global Equities logged $1.1 Trillion inflows in the past 53 weeks and have doubled forecasted flows in each out of the past 10 months.
13. GS Wedge Tracking Tool = >$3.3 Trillion favoring huge cash on the sidelines.
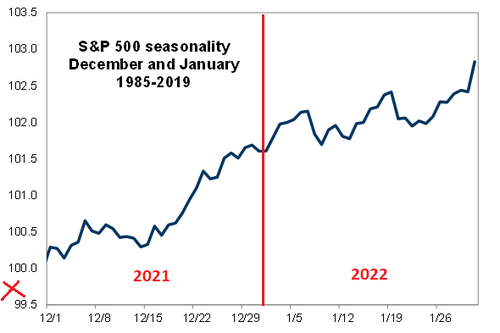
January S&P performance is very strong following a year of very strong gains.
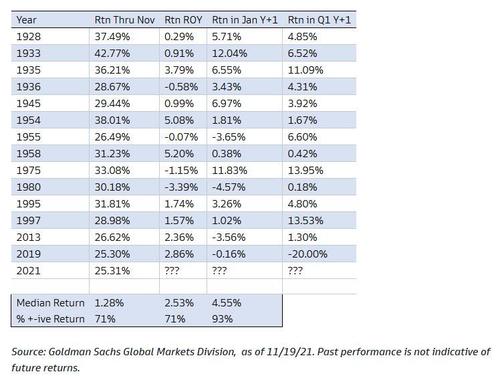
- 14. Since 1928, there have been 14 instances where the S&P 500 is up >25% or more, through November. 2021 may be the 15th.
- 15. The median return for December is +128bps with a 71% hit rate (ie strong gains continue).
- 16. More importantly, the median return for Q1 of the following year of those 14 instances was +455bps with a 93% hit ratio. (2020 pandemic was the only Q1 down year).
- 17. The month of January of the following year is +253bps with a 71% hit ratio. Gains are big and early.
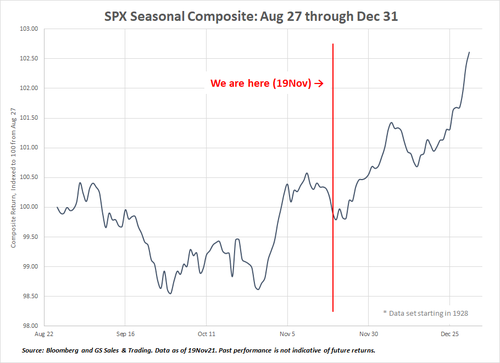
You are here. We are entering another 3-week window of upside here before a record December Expiration (already at $3.5 Trillion).
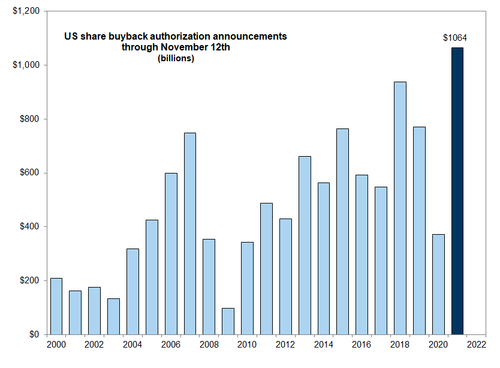
US corporates have authorized $1.064 Trillion worth of stock. This will be the largest year on record. GS buyback desk execution flow was up +40% week on week this week.
Tyler Durden
Mon, 11/22/2021 – 15:47
via ZeroHedge News https://ift.tt/30SL14j Tyler Durden
