An Oregon-based metals manufacturer faked test results and provided faulty materials to NASA, which the agency says caused over $700 million in losses and two failed satellite launches, according to the results of an internal investigation.
Hydro Extrusion Portland, Inc. – formerly known as Sapa Profiles, Inc., (SPI) falsified thousands of certifications for aluminum components over a 19-year period for hundreds of customers, including NASA.
When the launch of NASA’s Orbiting Carbon Observatory and Glory missions failed in 2009 and 2011, the agency said it was because their launch vehicle malfunctioned. The clamshell structure (called fairing) encapsulating the satellites as they traveled aboard Orbital ATK’s Taurus XL rocket failed to separate on command. Now, a NASA Launch Services Program (LSP) investigation has revealed that the malfunction was caused by faulty aluminum materials. –Engadget
SPI would generally alter the tests in one of two ways. Between 1996 and 2006, an SPI plant manager “led a scheme to make thousands of handwritten alterations to failing test results by changing failing numbers that fell below the minimum required test results to appear to be passing,” according to the Justice Department. Then, from around 2002 through 2015, SPI testing lab supervisor Dennis Balius “led a scheme to alter tests within SPI’s computerized systems and provide false certifications with the altered results to customers.” He also instructed employees to routinely violate other testing standards, such as increasing the speed of the testing machines or cutting samples in a way that did not meet testing standards.
Balius was sentenced to three years in prison and ordered to pay more than $170,000 in restitution.
“When testing results are altered and certifications are provided falsely, missions fail,” said NASA’s Director for launch services, Jim Norman, who added that years of scientific work were lost because of the fraud.
The Oregon company has agreed to pay $46 million for the fraud, including $34.1 million in combined restitution to NASA, the Department of Defense’s Missile Defense Agency (MDA), and commercial customers. They will also forfeit $1.8 million in ill-gotten gains.
“Corporate and personal greed perpetuated this fraud against the government and other private customers, and this resolution holds these companies accountable for the harm caused by their scheme,” said Brian Benczkowski, assistant attorney general of the criminal division at the Department of Justice, in an April 23 statement reported by Bloomberg.
A Norsk Hydro spokesman said that the case was settled, and that it had invested “significant time and resources to completely overhaul our quality and compliance organizations.”
via ZeroHedge News http://bit.ly/2vBeWe6 Tyler Durden
Fed cuts IOER but it likely will not fix the “issue”
Signaling from the IOER cut important – builds the case for the steepener and zero bound ED calls
Powell’s Q&A comments misguided – PMI’s + Core inflation tell the real story
The three doves tomorrow makes chasing the selloff dangerous
Obviously the big news from yesterday was the IOER cut that then turned into a substantial reversal. Let’s tackle both of those…
With regards to the IOER cut, it was surprising because it is extremely unclear if it will bring down Fed Funds with it, but it was the quick, easy thing for the Fed to try. I would argue it was a hasty, risky move because what happens if FF does not follow IOER lower? The Fed just put its credibility on the line and if FF does not come down, calls that the Fed has “lost control” will increase.
To be succinct, cutting IOER does not fix the issue because the whole FF/IOER problem stems from:
April 15 tax deadline MMF selling – I am struggling to find data on the amount people had to pay in taxes but the fund flows speaks of this and I can confirm taxpayers received less of a refund than previously
Increasing deficits that led to increased bill/UST supply
Therefore, does cutting IOER really help? No! You could argue it made the matter worse. If you are a FHLB with the choice of investing in repo (jostling between 2.50% and 2.60%) and FF (now 2.35%), what would you chose?? Of course you would show up in repo land and shun FF and the Fed just further incentivized you. In other words, the FHLB’s will not be present to provide liquidity (see chart from last week’s note). Day 1 post IOER cut, FF remains a “sticky” 2.45%. It likely comes in a bp or two, but until we get a repo facility or QT ends; it remains a problem for the Fed.
The signaling here is important. When you think about it, FF’s never went through their upper bound where you would certainly expect some action. So the fact the Fed took swift action like yesterday’s IOER cut reveals to us that higher rates are not happening – ie: there will be no more hikes.
That can be seen when FF’s first broke above IOER last week and Dollar shot higher, EM sold off, and risk assets turned irritable (like an old man trying to send back soup in a deli – for you Seinfeld fans). The US has reached its breaking point with higher rates and we saw that bigly in Q4, last week when FF broke IOER, and even yesterday on the reversal. Higher rates are a problem.
That tells me that the steepener is still the play despite the sharp reversal flatter yesterday (gonna happen given positioning). The IOER cut yesterday is a steepener because:
Lower front end rates at the end of a cycle are inherently a steepener
When you think about reasons why the curve flattened in the first place, besides Fed hikes which are now a thing of the past, it was front end supply. This FF/IOER problem is all about the supply glut. Therefore, yesterday’s action by the Fed will likely not be last (not only because it may not work). There will need to be either/and: a repo facility to allow for banks to build reserves again and take down future supply, or a more abrupt end to QT which will ultimately be the end of the Fed tightening cycle. Both will act to steepen the curve.
Therefore, this rinse out yesterday is giving you an entry point to initiate/add/reload.
Let me say this bluntly: the FF/IOER widening may seem micro, but it is a problem. Growth was accelerated last year due to fiscal stimulus that led to increased deficits. Increased deficits leads to increased treasury supply. Increased treasury supply led to FF/IOER widening. FF/IOER widening is the first sign of the pipes bursting as it led higher front end rates, a dollar breakout (only an EU growth surprise stopped it – for now), EM selloff, and then risk off. The Fed did not fix this with the IOER cut yesterday.
* * *
Moving on to the post-announcement/Q&A reversal. It came after Powell made some positive comments on growth and inflation. Now let me ask you something; does anyone expect the Fed Governor to walk up there and say “wow, inflation is really falling off a cliff!” Obviously no, he needs to maintain some positivity in order to keep inflation expectations anchored.
However, those comments triggered two things:
The account base that wants to fade the idea the Fed will cut soon sold – ie: sell “white” Eurodollars (very reasonable)
With most of the world on holiday (Asia and Europe), liquidity was poor and given how quickly the market reacted to those rather benign comments on growth/inflation; it stunk of algo’s.
If Powell really wasn’t concerned about inflation and thought it was going to return to 2% (standard CB rhetoric), why did the official statement downgrade inflation? Last month’s statement tried to blame lower energy prices on the “meh” inflation, but with energy firmer since then and inflation actually LOWER, they had to strike that reference to lower energy. Not only that, the Fed then downgraded inflation to “declined and running below” their mandate. Well that’s not very positive and does not jibe with Powell’s Q&A comments. Always follow the official communication.
So in some respects, the reversal is reasonable on the back of the idea the Fed is not ready to start the cutting cycle soon, but the selloff can only go so far – we know a cut is coming. Therefore you can price out some cuts in September (very reasonable), December (ehhh, getting dicey), and March (very risky, I wouldn’t touch it personally). Some follow through on that theme is entirely possible.
However, the idea the market sold off on some “positive” rhetoric from Powell in the Q&A is extremely dangerous to trade off of. Again, he is the Governor of the Fed. He has to maintain some positivity, but more importantly, let’s keep an eye on what really matters; the economic data.
All the regional PMI’s the past couple weeks have rolled over and the headline PMI yesterday confirmed the weakness. Why is this important? PMI have led rates since 2015. As you can see here, in 2016 post Brexit when everyone was worried about growth, PMI’s accelerated and eventually rates followed. Then last year, PMI’s rolled over in September and the rest is history…
Oh and we want to talk about inflation? Core PCE (black) vs. 5yr yields (purple)….
Therefore, it is extremely risky to follow the banter of the Fed chairman. Of course he has to say things are ok; the reality is different. The data is not only rolling over in the US, but China, who exports growth globally, is also….
So the risk is that Q1 was a blip in a larger downturn, and this downturn could be worse than previous cycles given the theory that Fed has over-tightened – or said more conservatively in economic terms; have overshot the neutral rate. It is therefore reasonable to expect PMI’s in the US to move into contraction this year.
* * *
Lastly, most of us can spin the Q&A as hawkish, or said more conservatively; not dovish enough to realize the easing priced into the front end. The market has sold off on the back of this.
Let me ask you one more question; do you want to be short in front of speeches from the three doves tomorrow? We have: Evans, he of “ought to communicate comfort with 2.5% core inflation” and “if inflation too low, may have to loosen policy,” and the “AIT” brothers Clarida and Williams. These three have all the cover they need to be dovish given core inflation and the PMI’s.
Bottom line: there may be some follow through to price out cuts in 2019 which is completely reasonable. However, you can’t trade off of Powell’s Q&A comments. The trajectory speaks of end of cycle and a Q1 blip, and that means steepeners remain the macro trade of choice.
The new idea is on this back up, consider the zero bound trades that are starting to gain notoriety. Meaning you can buy Eurodollar call structures that pay you 15-1ish if Fed returns to zero rates by 2021. This will work because:
The fiscal impulse runs out this quarter
The Fed has tightened the economy into a corner
The oft discussed long-term demographic issues kicks in around now (baby boomers retiring and entitlements become an issue)
2020 election cycle will be ugly
My theme of 2019: trade wars have languished too long and the damage done to the global economy is done
via ZeroHedge News http://bit.ly/2vAvzqg Tyler Durden
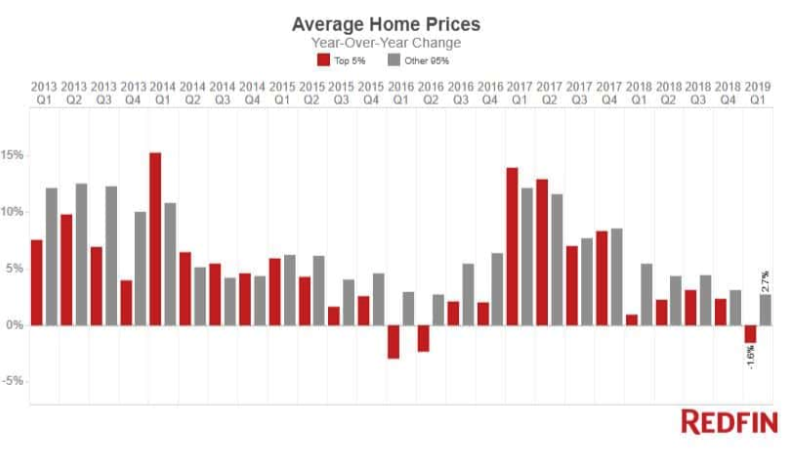
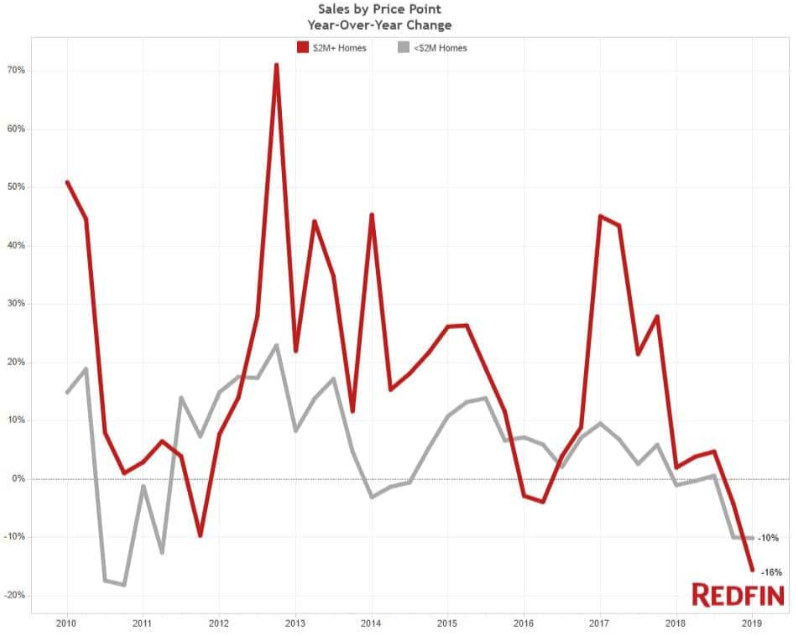
Demand for the nation’s most expensive properties collapsed in 1Q19.
Sales of homes listed above $2 million plunged 16% YoY last quarter, the most significant decline since 2010, according to Redfin. This comes at a time when sellers understand the cycle is turning, as they flood real estate markets across the country with homes, depressing prices for the fourth consecutive quarter.
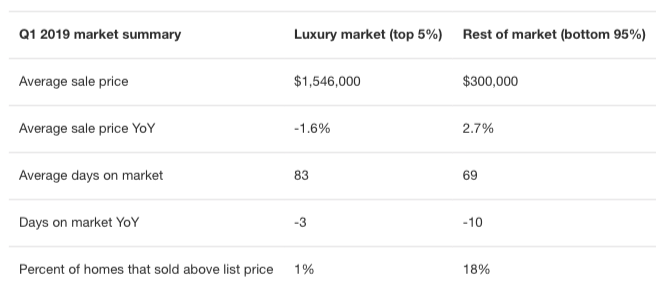
The average sale price for a luxury home, which Redfin describes as the top 5% most expensive homes in each of the more than 1,000 cities it tracks across the U.S. (not including New York City), fell 1.6% to $1.55 million in 1Q19, the first annual decline in three years.
The supply of luxury homes surged 14% annually in 1Q19, the fourth quarter in a row of increases.
Waning demand for luxury homes can be attributed to the recent changes in tax law. State and local taxes that homeowners regularly deduct were limited to $10,000, and mortgage interest deduction was reduced from $1 million to $750,000 in mortgage debt.
“Because homeowners can’t deduct as much mortgage interest as they used to be able to, the calculus has changed when it comes to buying a home, especially an expensive one,” said Redfin chief economist Daryl Fairweather. “Although the new mortgage rule applies to everyone in the country, high earners in states with high income taxes like California and Massachusetts saw their tax bills surge.”
“Not only do the new rules make it less desirable to purchase a multi-million dollar home in high-tax states, it has also motivated some people—especially those with big incomes and big housing budgets—to consider moving to places like Florida, Washington or Nevada, which have no state income tax,” Fairweather added.
Redfin shows the downshift in the luxury market has been damaging to certain metropolitan areas. The average luxury sale price dropped the most in Boston (-22.4%), Newport Beach, California (-21.8%), and Miami (-19.3%).
In San Diego, prices fell 1.4%, this was the first quarter of declining luxury home prices in two years. Earlier this week, we documented how San Francisco Bay Area homes dropped last month on a YoY basis for the first time in seven years. We also noted how West Coast markets were some of the hottest areas in the cycle, but now, the markets have cooled, if not reversed.
Nine of the ten markets listed above contributed to the overall sales drop in 1Q19, with Newport Beach, California, posting a -33.3% decline in the number of luxury homes sold and West Palm Beach posting a -23.1% decrease. Seattle was the only city on the Redfin list that didn’t post YoY decline in sales.
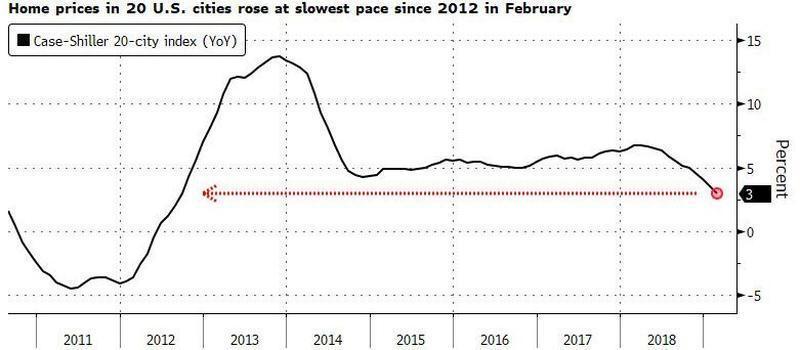
And to get a broad scope of things, S&P CoreLogic Case-Shiller Indices on Tuesday published a new report that showed home price declines weren’t just located in the San Francisco Bay Area but were widespread.
The real estate cycle is turning. Federal Reserve Chairman Jerome Powell on Wednesday overlooked President Trump’s call for a 100bps cut, a move that could continue weakening real estate markets for the foreseeable future.
via ZeroHedge News http://bit.ly/2UYavEu Tyler Durden
Zuckerberg is promoting private rooms. What’s the real reason?
Touting Facebook’s new social network redesign, Mark Zuckerberg talked up digital ‘living rooms’ where people can have more revealing, intimate conversations.
Standing in front of a giant screen with the words, “The future is private,” Zuckerberg said. However, privacy advocates and communications experts are skeptical about the site’s redesign. While they agree that it’s in Facebook’s best interests to improve privacy, they also say that users won’t be distracted by Facebook’s logo and see the platform as more integrated into their desktop, while online groups will encourage them to reveal even more personal beliefs and details from their lives.
“There’s something more at work here,” says Adam Levin, founder of Scottsdale, Ariz.-based CyberScout, a global data and identity protection company.
“By creating groups we will be doing Facebook’s work for it. The more people who come together to talk about their interests — whether they’re political, financial or religious — the more data Facebook can collect. There’s nothing more delicious for Facebook than having people come into groups and talk.”
Digital Living Room
Digital Living Room Cameras
People may be more likely to reveal illnesses, mental-health issues or even quirky or embarrassing hobbies, she said. This could be anything from men who like Mattel Barbie dolls and My Little Pony to Donald Trump supporters living in liberal enclaves that would be otherwise reluctant to share their political views, Kovacs North said. “Anything you think is private is public, and anything you think is temporary is permanent. Facebook aggregates data for advertisers, but other people can simply take a screenshot,” she added.
Zuckerberg disagrees of course.
I have little use for Facebook. I was very concerned about privacy issues long before Facebook privacy issues became the talk of the town, and rightly so.
It’s All About You
As long as you are comfortable sharing your personal data with advertisers, whether or not Zuckerberg proclaims he won’t, then who am I to disagree?
Otherwise Adam Levin hits the nail on the head:
“We’re about to enter the most hotly contested presidential election in modern history. Imagine the data Facebook can acquire from group chats. They give Facebook an opportunity to virtually eavesdrop. Mark Zuckerberg wants you to think that it’s all about you. And it is. But not exactly in the way that you think.”
via ZeroHedge News http://bit.ly/2Y367WQ Tyler Durden
While we previously discussed the “why” behind today’s selloff, which as noted earlier was a story in the Indian press suggesting US-China trade talks have hit an impasse, the next question is “who“? This is a relevant question because if one looks at oil, for example, instead of stocks, one will find a series of violent daily reversals, which have seen CTAs turn from max short, to max long, and back to max short again.
As Nomura’s Charlie McElligott writes in an ad hoc note this afternoon, the CTA model for WTI Crude flipped “-100% Short” earlier today (looks that way per the “TWAP selling in machine” look of the chart), reversing entirely from yesterday’s previously re-established +100% Long positioning, culminating an “enormously volatile past few sessions”, which have seen CTAs turn +100% Long last Friday but deleveraging to just +35% Long Monday, before forced re-leveraging on the Monday/Tuesday rally to +100%)
CTA rollercoaster in oil aside, equities remain in “bizarro-world” according to the Nomura quant, off the back of just two miniscule down-trades: yesterday’s -75bps SPX move followed by today’s -30bps “selloff” have incredibly sent VVIX back near ~100 (as Tom Eason said in his best deadpan, “…market’s pretty tightly wound here” with regard to ‘tails’.)
And yet, despite the massive marginal moves in oil, McElligott writes that in keeping with his YTD observations on the “Max Longs” in Bonds / Rates / EQ within systematic trend, regarding the CTA model he actually sees “both the US Equities Futs and UST / Rate positions remaining ITM (Equities moreso, USTs / Rates closer to triggering however) and above current deleveraging levels (see below for levels coming to today).” Indeed, as the following observations on trigger points show, there is a ways to go for equities before CTAs “flip”:
S&P 500, currently 100.0% long, [2923.1], selling under 2865.74 (-1.96%) to get to 57% , more selling under 2600.55 (-11.03%) to get to -100% , flip to short under 2600.84 (-11.02%), max short under 2600.55 (-11.03%)
Russell 2000, currently 100.0% long, [1577.6], selling under 1553.11 (-1.55%) to get to 57% , more selling under 1542.0 (-2.26%) to get to -100% , flip to short under 1542.15 (-2.25%), max short under 1542.0 (-2.26%)
NASDAQ 100, currently 100.0% long, [7756.5], selling under 7512.71 (-3.14%) to get to 57% , more selling under 6526.51 (-15.86%) to get to -100% , flip to short under 6527.29 (-15.85%), max short under 6526.51 (-15.86%)
ED4, currently 100.0% long, [97.625], selling under 97.44 (-0.19) to get to -100% , flip to short under 97.49 (-0.14), max short under 97.44 (-0.19)
USD_10Y, currently 100.0% long, [123.578125], selling under 122.29 (-1.29) to get to 54% , more selling under 119.44 (-4.14) to get to -11% , flip to short under 119.44 (-4.14), max short under 118.76 (-4.82)
If not CTAs, could today’s coordinated selloff in stocks and bonds be blamed on risk-parity funds? The answer, according to the Nomura strategist is that this “may be the case on the margin; but rarely is it that simple, especially as the bank’s risk-par model would require FAR more significant moves in realized vol to drive a sharp de- or re-leveraging; instead, their flows tend to look rather “counter-cyclical.”
So if not a systematic – CTA, risk parity, variably annuity – deleveraging, what is behind today’s sharp dump? The answer, to McElligott, is that we had “a lot of people on the same side of the same trades with the same view—and it was working fine; stability breeds instability however, and all it takes sometimes is a modest tweak to a narrative which then “tilts” excess positioning / leverage into a correction with occasional “cleanses.”
As for the selling catalyst, while the US-China trade story may have been the initial snowball to launch the avalanche, what accelerated the slide is simple: too many funds were on the same side of the trade. As a result, according to the Nomura derivatives expects that…
“much the same way that Jerome Powell nuked cross-asset vols in early January with his “pivot” (through squelching Rate Vol and backing down on tightening & the balance-sheet)….it’s totally rational that we could then see the opposite motion (GASP!), as Jerome’s very simple “transitory-” and “patience-” focused message yesterday (which as per my note this morning is heavily overrated) “suddenly” then sees markets lose what was perceived as “clear” forward-guidance on the path of interest rates (lower)—especially after the past month guidance from Fed speakers themselves on weakening inflation trend forcing a re-think of policy and / or potentially meriting “insurance cuts.”
The Trump Administration has laid out its arguments against the constitutionality of ObamaCare as it prepares an all-out assault in the courts that could bring a final Supreme Court ruling during the middle of election season next spring.
Filed with the conservative 5th US Circuit Court of Appeals, Assistant Attorney General Joseph Hunt unfurled the administration’s new position, which holds that the entirety of the law is unconstitutional. Previously, the administration had argued that some parts of the law could remain in effect, even if the individual mandate is struck down.
“Upon further consideration and review of the district court’s opinion, it is the position of the United States that the balance of the ACA also is inseverable and must be struck down” and that the fine on the uninsured “works part and parcel with the other health-insurance reforms in the ACA,” the administration wrote in the briefing.
The brief is, effectively, a bid to affirm a December decision by US District Judge Reed O’Connor that would have struck down the law if it weren’t for the inevitable appeals. The case is widely expected to go all the way to the Supreme Court, what would be ObamaCare’s second trip to the highest court in the nation.
In his ruling, O’Connor determined that when Congress struck down the individual mandate last year, it effectively nullified SCOTUS’s rationale for deeming the law constitutional in 2012. His decision sided with Republican state officials who had filed the challenge. The decision was swiftly appealed by Democratic attorneys general.
Last month, Trump tweeted that Republicans had been developing a “really great” alternative health care plan with “far lower premiums” than Obamacare and that a vote would take place right after the election.
I was never planning a vote prior to the 2020 Election on the wonderful HealthCare package that some very talented people are now developing for me & the Republican Party. It will be on full display during the Election as a much better & less expensive alternative to ObamaCare…
According to the Washington Examiner, if all of Obamacare were declared unconstitutional, then other provisions in the healthcare law would be undone, like the expansion of Medicaid, cuts to drug prices in Medicaid, and a rule allowing adult children to remain on their parents’ plans until the age of 26.
The United States Postal Service (USPS) is in a “death spiral” as it fears it will run out of cash by 2024. The postmaster general warned Tuesday that unless major changes are made to the model politicians set up to fail, the USPS will be unable to remain solvent.
The USPS has had dwindling revenue for years, even though they deliver to about 1 million new addresses each year. Most of the reason why is because private companies, such as UPS and FedEx are offering services the post office cannot. Competition in the marketplace will lower the costs, but public services can’t compete with private ones (because bureaucracy is expensive), and historically, are disasters waiting to happen.
The organization has stayed afloat largely by defaulting on $48 billion in mandated payments over the past several years, Megan Brennan, the Postmaster General said during a hearing called by the House Committee on Oversight and Reform, and its operations are further complicated by inflation-linked caps on price increases for key products, according to a report by the Washington Examiner. “Given the restraints imposed by law, no set of management actions is sufficient to offset the continuing decline in the use of mail,” said Brennan.
People are moving toward online statements and paperless options when possible, which is helping to make USPS obsolete. And politicians are already suggesting that the government, over $22 trillion in debt, should just throw money at USPS to force it to work rather than letting it fail so the void can be filled by private companies operating in a more free market.
Changing the 2006 law which requires the post office to pay in advance for retiree health benefits, rather than covering them as they come due, won’t fix the problem of fewer Americans choosing to use paper mail. And experts agree, it’s not going to solve the problem of USPS’s insolvency in the long run.
via ZeroHedge News http://bit.ly/2VEs0hr Tyler Durden
For stocks, April was certainly not the cruelest month, as the risk-on rally continued with the S&P 500 posting 4.0% total returns following the strong 13.6% rally in 1Q. The month ended with a mini meltup, as the S&P set record highs four times in April on a closing basis, three of them in the last three trading days of the month. Overall, the S&P 500 is up 18.2% YTD, 26% since the December low, and sits 2% above its prior high in September 2018.
As BofA notes, the April rally was led by mega-cap stocks – the largest 50 stocks outperformed the overall market by 50bps, while the equal-weight S&P 500 index lagged by 30bps. Global equities also posted strong gains (but lagged the S&P), rising 3.7% in local currency terms and 3.4% in USD, with all MSCI regions gaining. US stocks outperformed other asset classes including bonds (LT Treasuries -1.7% / IG corp. +0.6%) and cash (+0.2%). The VIX index fell 4% (down 48% YTD), while gold slipped for the second straight month (-1.0% in April).
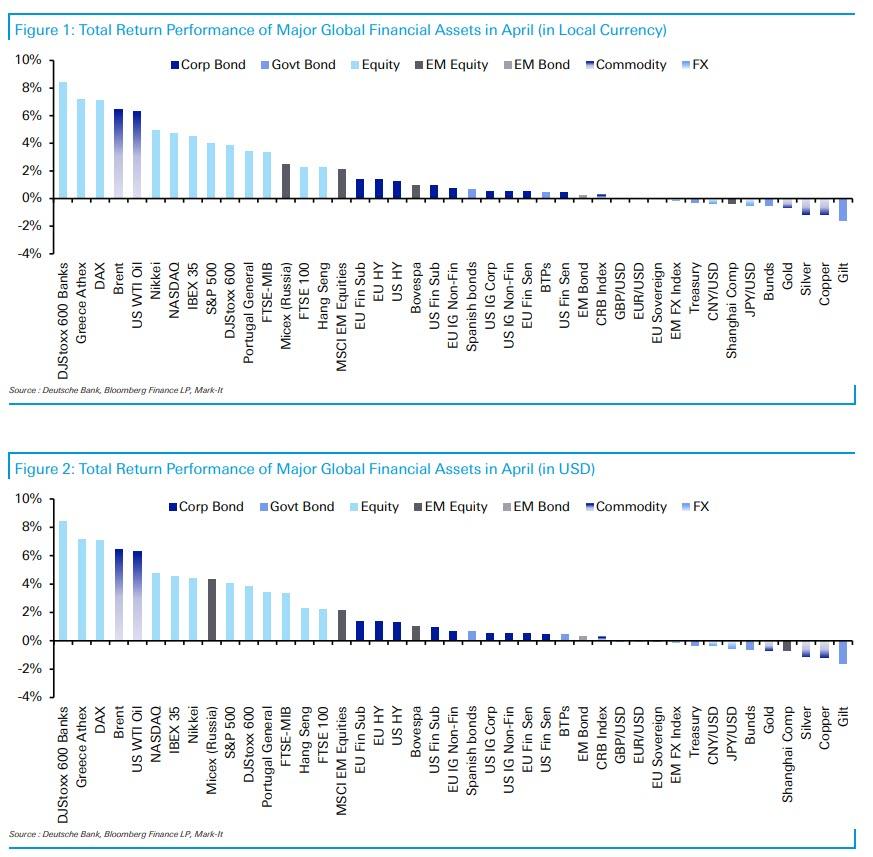
It wasn’t just the US, however, and as Deutsche Bank writes, there were strong returns across the board for most equity markets globally as shown below. Central banks falling into a dovish line one-by-one, data continuing to favor this goldilocks environment, earnings season so far being taken positively, trade headlines by and large incrementally more positive and a continued lack of volatility all contributed to the favorable backdrop for risk assets, according to the bank’s Craig Nicol.
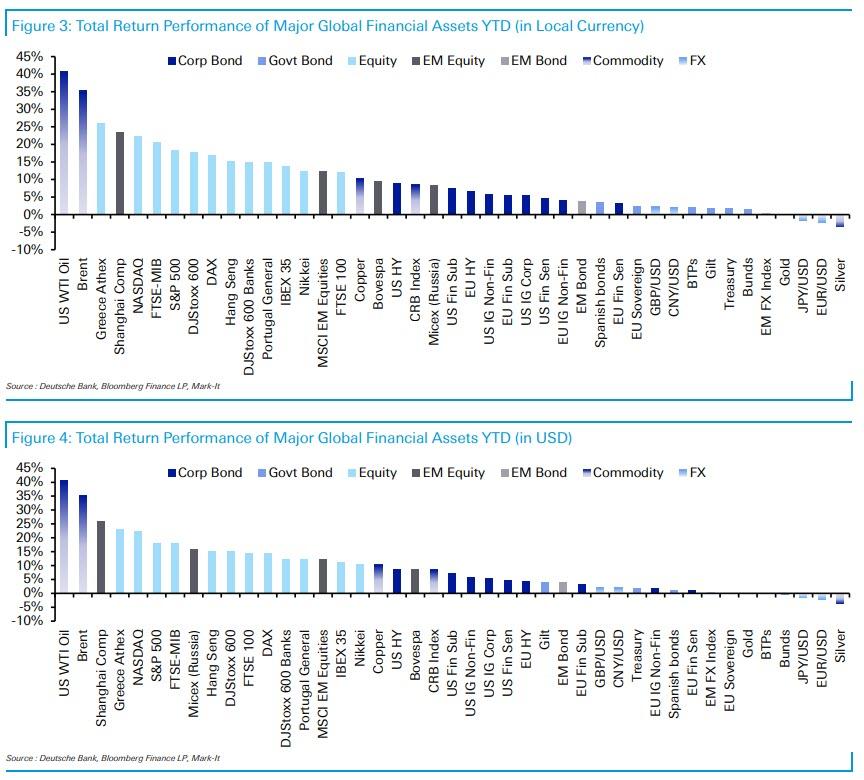
And while returns weren’t quite so spectacular for rates and commodities, which lagged the broader rally, however, by the end of the month, 30 of the 38 assets in Deutsche Bank’s sample still finished with a positive total return in local currency terms and also dollar-adjusted terms. This means that YTD, we’re now at 37 out of 38 assets up in local currency terms and 35 in dollar terms. In local currency terms, this is now the strongest start to a year through the first four months since 2007.
Digging into the April moves, DB notes that the top spot in its leaderboard goes to European Banks, which returned +8.4% in local currency terms. A combination of a slight rise in bond yields, earnings, improving data and a general lag versus wider equity markets in the first quarter all appeared to play a role. That compares to a return of +3.9% for the broader STOXX 600 while the NASDAQ and S&P 500 finished with returns of +4.8% and +4.0%, respectively, and as we noted above, new record highs. EM equities lagged the rally, albeit still returning a solid +2.1%. In Asia, the Nikkei returned +5.0% and Hang Seng +2.3%. The Shanghai Comp was the big underperformer, falling -0.4%.
Credit markets, and particularly higher beta credit, had a solid month also, particularly when considering negative total returns for Treasuries (-0.3%) and Bunds (-0.6%). EUR HY and USD HY returned +1.4% and +1.3%, respectively, while EUR Fin-Subs and USD Fin-Subs finished with returns of +1.4% and +1.0%, respectively. EUR and USD IG Corps by contrast returned +0.7% and +0.5%, respectively. Coming back to rates, it’s worth noting that Gilts (-1.6%) struggled last month as the focus turned to stronger UK data, however, non-core markets were stronger, particularly BTPs (+0.5%) and Spanish Bonds (+0.7%). EM Bonds (+0.3%) were slightly positive, albeit masking underlying idiosyncratic stories for a number of countries.
Finally, there was a bit of split in commodities with Brent (+6.3%) and WTI (+6.4%) oil two of the strongest assets last month, however, Gold (-0.7%), Silver (-1.1%) and Copper (-1.2%) all fell.
As for the YTD picture, as alluded to above, only 1 asset has the misfortune of being down this year in our sample and that goes to Silver (-3.5%). WTI oil (+40.7%) continues to hold the top spot, followed closely by the majority of equity markets, which are led by the Greek Athex (+26.1%). The NASDAQ has now returned +22.4%, S&P 500 +18.2% and STOXX 600 +17.7%. The big rally for European Banks last month means they are now up +15.0% this year. Meanwhile, USD credit is up +4.6% to +8.9% and EUR credit +3.3% to +6.6% with HY outperforming IG. Bond markets are still delivering a positive return in local currency terms, with Treasuries up +1.8% and Bunds +1.5%, however, the latter does deliver a negative return in dollar-adjusted terms as a result of the euro move this year.
Going back to the US and looking at sector performance, financials gained most in April, up 8.8%, true to its historical trend of consistent outperformance following yield curve inversions. Strong 1Q earnings (71% have beaten on EPS through April) and a steepening yield curve helped. Tech and Communication Services were also up over 6% each, bolstered by breadth of earnings beats (80% beat on EPS in both sectors). Health Care was the notable laggard in April, down 2.7%, likely hurt by extended positioning ahead of political campaigning. YTD, Health Care is the worst performing sector in the S&P, up just 3.2% vs. +17.5% for the S&P 500. Real Estate also fell in April, down 0.6%.
Finally, looking at returns by size, in keeping with quality returns, the Russell 2000 (+3.4%) slightly lagged the Russell Midcap (+3.8%) and the Russell 1000 (+4.0%) in April. Within small and mid caps, Financials, Tech, and Industrials led, whereas Health Care and Energy lagged. Value stocks outperformed expensive/growth stocks in both small and mid caps. Midcaps (+21.0%) are the best-performing sector so far this year, while large caps (+18.6%) are neck and neck with small caps (18.5%).
via ZeroHedge News http://bit.ly/2vBtZEB Tyler Durden
Watching US equities drop after Chair Powell’s press conference today, I could not help but think back almost 19 years, to 2 separate interactions I had in 2000 with my former employer Steve Cohen and equally famous hedge fund manager Lee Cooperman. The turn of the millennium was a watershed year for domestic stocks. The dot com bubble was starting to burst, but Fed Funds sat at 6.5% from June to December, the highest levels since 1991. Markets wanted either a cut or at least some reassurance the Fed Put was still in place.
On one FOMC meeting day that year, Steve had set up very short. Since everyone in the room got to see his positions, we all knew that and almost everyone was therefore short as well. The old trading room at SAC was quite small, so the energy going into the day was palpable. The best trader in the world had a point of view, and we were all going to end the day with a nice gain by piggybacking on his insight.
Except the day didn’t start off as expected. Stocks rallied at the open and all morning long. By 11am the room was sitting on a major loss. Steve was quiet – he usually was – but he knew if he just sat around waiting until 2pm he would be tempted to change his mind.
So Steve left the desk, something that rarely happened, and went downstairs to the cafeteria to have lunch with his family. I can still remember catching a glimpse of him at a large table with his wife and children, happily distracted by their presence and munching on some fish sticks. Yes, billionaires eat fish sticks…
As 2pm neared and with Steve back on the desk, things still weren’t going well. The market had continued its ascent. The Fed decision crossed the tape – no rate cut – but stocks rose further still. If you’ve never seen 30 traders anxiously trying not to stare at their P&Ls and wondering if their leader has lost his edge, I don’t recommend the experience. The only sound was Steve’s trading assistant calling out ever-higher S&P levels.
But then, around 230pm stocks stopped going up. And then it started to drop. At first just a little, and then more of a plummet. Everyone started to breath again. Steve, of course, looked exactly the same. Aside from needing a little lunchtime breather, things had worked out the way he thought.
As he left the room at 4pm, all he said to us was “That’s how you do it, boys… Have a good night.” We gave him a standing ovation. He waved on his way out the door.
The setting for the other story was an idea dinner at a steak place in Manhattan. The attendees were a bunch of hedge fund analysts and PMs, and for whatever reason Lee Cooperman – famous in NY hedge fund circles even then – thought this event was the best use of early evening hours.
Most of the conversation revolved around how much the Fed could actually do to stabilize the stock market and US economy. The consensus among the attendees – none over 40 years old save Lee – was that the Fed was powerless. The bubble was too big, animal spirits too lofty, and the US economy too exposed to the equity wealth effect.
Cooperman was quiet through this debate, but as he stood up to go he said to the table “All very interesting, but you don’t want to live in a world where the Fed can’t impact stock prices. Good night.” And with that, he was gone.
It has been a long time since those two events, but for me they bookend how I think about the role of the Fed in setting asset prices:
For a trader, the Fed is a catalyst like any other. You analyze the prevailing market narrative and decide if the event (an FOMC meeting) will live up to expectations.
Today was a perfect example of that. As we outlined last night, everything from 2-year yields to Fed Funds Futures were signaling a more dovish Fed anxious to spur inflation. Chair Powell isn’t ready to go there, so markets dropped after the press conference.
Investors are more concerned with how the Fed sees the general level of stock prices and, just as importantly, the volatility of those prices. The Fed Put is more about the CBOE VIX Index than whether the S&P is at 2500 or 3000. We saw that well enough in December/January.
Summing up: when it comes to how one should “trade the Fed”, perspective and conviction are everything. The trader will see today’s action as a sign markets were overconfident in a dovish Fed. The investor will look at Fed Funds Futures still putting +50% odds on a rate cut this year and 10-year Treasuries at 2.5% and see indications that the Fed is still in their corner.
via ZeroHedge News http://bit.ly/2VDKrmx Tyler Durden
Last week, when we showed the latest fund flow data confirming that active, mutual funds have now experienced a virtually non-stop torrent of capital outflows for the past 14 months, with the redeemed funds used to fund ETFs and various other passive, “robotic” investments, we had one piece of simple advice: “learn to code.”
Well, as it so often happens these days, what we thought was sarcastic humor turned out to be the bitter truth just days later, and as Bloomberg reported this morning, two Janues Henderson fund managers, Thomas Hanson and Hartej Singh, have requested to leave the company which until recently employed Bill Gross. They will be replaced by a new quantitative team of four, who will be recruited by the asset manager.
The hiring will “reflect the changing nature of fund management and how greater use of technology, statistical techniques and data management will augment our fundamental processes,” she said.
In short: the hiring will reflect that active, fundamental managers should, well, learn to code, as the only “managers” that matter in this broken, centrally-planned market are those who trade not on fundamentals but on big data, trends, and fund flows, especially that of the Fed.
As a result, Janus Henderson’s global credit team will go to six from eight fund managers (after losing its most notable credit manager, Bill Gross several months earlier). Thomas Hanson, who co-managed the European high-yield and “Credit Alpha” strategies, joined from Legal & General Investment Management in 2015. Hartej Singh has joined Pension Insurance Corporation as a portfolio manager, according to his LinkedIn profile. He was previously co-manager of Janus Henderson’s sterling-denominated credit funds.
As for the real reason why the asset manager is scrambling, Janus Henderson, which was created in the merger between Janus Capital and Henderson Group, suffered its sixth quarter of investor withdrawals in the first three months of this year. Which is why the fund will try anything just to stop the bleeding.
via ZeroHedge News http://bit.ly/300nbi2 Tyler Durden