Turkey Gold Demand Spikes To 8-Year High (As Price Drops)

As gold prices have fallen, yet another nation is choosing to use the drop to build its reserves. As Bloomberg notes, Turkey’s gold imports that doubled this year are set to reach the highest level since 2005 as the metal’s price heads for the first annual drop in 13 years. As Commerzbank notes “there seems to be a lot of interest in physical gold at the current low price,” as Turkey imported 251.4 metric tons of gold since January – the biggest tonnage increase since at least 1995 (a rate almost 60% more than 2012’s average monthly rate). Turkey was the fourth-largest buyer of gold last year, after India, China and the U.S., World Gold Council data show.


Source: Bloomberg


via Zero Hedge http://feedproxy.google.com/~r/zerohedge/feed/~3/v6lL7cOD4HA/story01.htm Tyler Durden

The Stunning Magic Of “New Normal” Hedge Fund Leverage

The following chart, from the Balyasny Asset Management Q3 letter to investors, show just that: the magic of hedge fund leverage in the New Normal.

Specifically, it shows that while BAM’s AUM from 2010 until Q3 2013 has increased only modestly (light blue), it is the dark blue bar portion that shows just how much “purchasing power”, i.e., allocation, has been deployed by the fund, thanks to the good graces of its Prime Brokers, who have allowed it expand its leverage from 100% to nearly 500%! Compare this to the peak leverage in the old normal which was roughly half: yes, that was at a time when the so-called credit bubble exploded. It has now doubled.

From BAM:

During our soft-close period over the last two years, we have doubled the size of our allocations and our balance sheet while keeping AUM roughly the same. Our plan is to accept only enough new capital to allow us to keep our assets / notional dollars allocated ratio at 1 to 5.


We find that portfolio managers on average utilize about 70-80% of their maximum allocations – so $1 of assets to $5 in notional allocated dollars typically results in our target gross leverage of 3.5-4x. We will be very disciplined with this so please let us know as early as possible if you are interested in increasing your allocation next year.

Of course, when one is levered nearly 5x, being “very disciplined” is usually a good idea.

But who would be on the hook should things turn south, and the massive leverage blows up in the face of Balyasny and its LPs? Not Balyasny of course, but the Prime Brokers who provided the fund with 5x leverage. Prime Brokers who just happen to be the same TBTF banks that were bailed out last time around, and which will have to be bailed out once again as soon as the Bernanke levitation finally ends.

But most importantly, the chart shows quite clearly that without any new equity injections in the market, the one and only source of incremental “capital” injected into risk assets is, you guessed it, debt.


via Zero Hedge http://feedproxy.google.com/~r/zerohedge/feed/~3/bRExCAokePU/story01.htm Tyler Durden

The Stunning Magic Of "New Normal" Hedge Fund Leverage

The following chart, from the Balyasny Asset Management Q3 letter to investors, show just that: the magic of hedge fund leverage in the New Normal.

Specifically, it shows that while BAM’s AUM from 2010 until Q3 2013 has increased only modestly (light blue), it is the dark blue bar portion that shows just how much “purchasing power”, i.e., allocation, has been deployed by the fund, thanks to the good graces of its Prime Brokers, who have allowed it expand its leverage from 100% to nearly 500%! Compare this to the peak leverage in the old normal which was roughly half: yes, that was at a time when the so-called credit bubble exploded. It has now doubled.

From BAM:

During our soft-close period over the last two years, we have doubled the size of our allocations and our balance sheet while keeping AUM roughly the same. Our plan is to accept only enough new capital to allow us to keep our assets / notional dollars allocated ratio at 1 to 5.


We find that portfolio managers on average utilize about 70-80% of their maximum allocations – so $1 of assets to $5 in notional allocated dollars typically results in our target gross leverage of 3.5-4x. We will be very disciplined with this so please let us know as early as possible if you are interested in increasing your allocation next year.

Of course, when one is levered nearly 5x, being “very disciplined” is usually a good idea.

But who would be on the hook should things turn south, and the massive leverage blows up in the face of Balyasny and its LPs? Not Balyasny of course, but the Prime Brokers who provided the fund with 5x leverage. Prime Brokers who just happen to be the same TBTF banks that were bailed out last time around, and which will have to be bailed out once again as soon as the Bernanke levitation finally ends.

But most importantly, the chart shows quite clearly that without any new equity injections in the market, the one and only source of incremental “capital” injected into risk assets is, you guessed it, debt.


via Zero Hedge http://feedproxy.google.com/~r/zerohedge/feed/~3/bRExCAokePU/story01.htm Tyler Durden

Guest Post: America's Future – Some Provocative Questions

Monty Pelerin’s World blog points out five provocative questions that Ben Hunt has raised. Many will answer “yes” to the five questions – and that has profound implications on what kind of country the US will become for the next generation…


1. Has the academic and bureaucratic capture of US monetary policy been duplicated in other policy areas, such as national security and healthcare?


2. Is there a common academic and bureaucratic response across these policy areas to the economic and political duress of the past 10 years, such that emergency policy actions against immediate threats have been transformed into permanent insurance programs against future and potential threats?


3. Is this the common thread woven through the three most important and controversial policies of our day: QE, Obamacare, and NSA eavesdropping?


4. Are there useful lessons to be drawn from the last time we went through such a wholesale redefinition of the *meaning* of government policy, back in the 1930’s?


5. What are the structural consequences for markets and investing that stem from this redefinition?


How many “yes”‘s do you see?


via Zero Hedge http://feedproxy.google.com/~r/zerohedge/feed/~3/t3bsH0gZZsw/story01.htm Tyler Durden

Guest Post: America’s Future – Some Provocative Questions

Monty Pelerin’s World blog points out five provocative questions that Ben Hunt has raised. Many will answer “yes” to the five questions – and that has profound implications on what kind of country the US will become for the next generation…


1. Has the academic and bureaucratic capture of US monetary policy been duplicated in other policy areas, such as national security and healthcare?


2. Is there a common academic and bureaucratic response across these policy areas to the economic and political duress of the past 10 years, such that emergency policy actions against immediate threats have been transformed into permanent insurance programs against future and potential threats?


3. Is this the common thread woven through the three most important and controversial policies of our day: QE, Obamacare, and NSA eavesdropping?


4. Are there useful lessons to be drawn from the last time we went through such a wholesale redefinition of the *meaning* of government policy, back in the 1930’s?


5. What are the structural consequences for markets and investing that stem from this redefinition?


How many “yes”‘s do you see?


via Zero Hedge http://feedproxy.google.com/~r/zerohedge/feed/~3/t3bsH0gZZsw/story01.htm Tyler Durden

October Housing Traffic Weakest In Two Years On "Broad-Based" Housing Market Slowdown

In case the world needed any additional proof that the latest housing bubble (not our words, Fitch’s) was on its last legs, it came earlier today from Credit Suisse’ Dan Oppenheim who in his monthly survey of real estate agents observed that October was “another weak month” for traffic, with “pricing power fading as sluggish demand persists.” This naturally focuses on the increasingly smaller component of buyers who buy for the sake of owning and living in a home instead of flipping it to another greater fool (preferably from China or Russia, just looking to park their stolen cash  abroad). Quantifying the ongoing deflation of the bubble, Oppenheim notes that the “weakness was again broad-based, and particularly acute in Seattle, Orlando, Baltimore and Sacramento…. Our buyer traffic index fell to 28 in October from 36 in September, indicating weaker levels below agents’ expectations (any reading below 50). This is the lowest level since September 2011.”

Other notable findings:

  • The Price appreciation is continuing to moderate: while many markets saw home prices rising if at a far slower pace, 7 of the 40 markets saw sequential declines (vs. no markets seeing declines in each of the past 8 months). Agents also noted increased use of incentives. Tight inventory levels remain supportive, but are being outweighed by lower demand.
  • Longer time needed to sell: it took longer to sell a home in October as our time to sell index dropped to 42 from 57 (below a neutral 50). This is  typically a negative indicator for near-term home price trends.

Which is bad news for the Fed: recall that as the TBAC has been preaching for over half a year, unless the Fed manages to reflate the housing bubble to escape velocity speeds where the securitization product can become the equivalent of “high quality collateral”, Mr. Chairwoman will be unable to step away from injecting the credit money flow, while in the process extracting so much more collateral that the market ultimately runs out of things the Fed can legally (or illegally) monetize.

Full note:

Another Weak Month for Traffic, Though Some Saw More Signs of Life in Late Oct.


• Pricing power fading as sluggish demand persists: Add the government shutdown to the list of recent buyer concerns. Even as mortgage rates pulled back (which had ostensibly been the main driver of weaker trends this summer), buyers headed to the sidelines in October, especially in markets dependent on the federal government or contractors as the government shutdown ensued. The end result was that after several months of weakening demand, price appreciation appears to be moderating in most markets. One potential bright spot is that we saw some comments from agents toward the end of the month highlighting a pick-up in activity after the shutdown and debt ceiling debate were resolved, though it wasn’t enough to move the needle on our index so we will watch closely in November.


• Buyer traffic falls again as government shutdown leads to further hesitation: Our buyer traffic index fell to 28 in October from 36 in September, indicating weaker levels below agents’ expectations (any reading below 50). This is the lowest level since September 2011. Agents had previously highlighted growing hesitancy from buyers given the sharp move higher in home prices and mortgage rates, but even as rates came in, buyer confidence took a hit from the government shutdown and debt ceiling debate, even in markets which on the surface wouldn’t appear overly reliant on the federal government. Weakness was again broad-based, and particularly acute in Seattle, Orlando, Baltimore and Sacramento. Dallas remained at healthy levels, while Denver, Houston and Vegas all improved sequentially.


• Price appreciation continuing to moderate: Our home price index fell to 57 in October from 72 in September, still pointing to higher home prices, but much less broad-based. In addition, 7 of the 40 markets we survey saw sequential declines (vs. no markets seeing declines in each of the past 8 months). Agents also noted increased use of incentives.


Tight inventory levels remain supportive, but are being outweighed by lower demand.


• Longer time needed to sell : Our home listings index pointed to stable inventory levels, but it took longer to sell a home in October as our time to sell index dropped to 42 from 57 (below a neutral 50). This is typically a negative indicator for near-term home price trends.

* *  *

Oh well: the latest mass delusion of instawealth was fun while it lasted.


< img src="http://da.feedsportal.com/r/180263864480/u/49/f/645423/c/34894/s/33766d6f/sc/22/rc/3/rc.img" border="0"/>

via Zero Hedge http://feedproxy.google.com/~r/zerohedge/feed/~3/TUSG4thGb5s/story01.htm Tyler Durden

October Housing Traffic Weakest In Two Years On “Broad-Based” Housing Market Slowdown

In case the world needed any additional proof that the latest housing bubble (not our words, Fitch’s) was on its last legs, it came earlier today from Credit Suisse’ Dan Oppenheim who in his monthly survey of real estate agents observed that October was “another weak month” for traffic, with “pricing power fading as sluggish demand persists.” This naturally focuses on the increasingly smaller component of buyers who buy for the sake of owning and living in a home instead of flipping it to another greater fool (preferably from China or Russia, just looking to park their stolen cash  abroad). Quantifying the ongoing deflation of the bubble, Oppenheim notes that the “weakness was again broad-based, and particularly acute in Seattle, Orlando, Baltimore and Sacramento…. Our buyer traffic index fell to 28 in October from 36 in September, indicating weaker levels below agents’ expectations (any reading below 50). This is the lowest level since September 2011.”

Other notable findings:

  • The Price appreciation is continuing to moderate: while many markets saw home prices rising if at a far slower pace, 7 of the 40 markets saw sequential declines (vs. no markets seeing declines in each of the past 8 months). Agents also noted increased use of incentives. Tight inventory levels remain supportive, but are being outweighed by lower demand.
  • Longer time needed to sell: it took longer to sell a home in October as our time to sell index dropped to 42 from 57 (below a neutral 50). This is  typically a negative indicator for near-term home price trends.

Which is bad news for the Fed: recall that as the TBAC has been preaching for over half a year, unless the Fed manages to reflate the housing bubble to escape velocity speeds where the securitization product can become the equivalent of “high quality collateral”, Mr. Chairwoman will be unable to step away from injecting the credit money flow, while in the process extracting so much more collateral that the market ultimately runs out of things the Fed can legally (or illegally) monetize.

Full note:

Another Weak Month for Traffic, Though Some Saw More Signs of Life in Late Oct.


• Pricing power fading as sluggish demand persists: Add the government shutdown to the list of recent buyer concerns. Even as mortgage rates pulled back (which had ostensibly been the main driver of weaker trends this summer), buyers headed to the sidelines in October, especially in markets dependent on the federal government or contractors as the government shutdown ensued. The end result was that after several months of weakening demand, price appreciation appears to be moderating in most markets. One potential bright spot is that we saw some comments from agents toward the end of the month highlighting a pick-up in activity after the shutdown and debt ceiling debate were resolved, though it wasn’t enough to move the needle on our index so we will watch closely in November.


• Buyer traffic falls again as government shutdown leads to further hesitation: Our buyer traffic index fell to 28 in October from 36 in September, indicating weaker levels below agents’ expectations (any reading below 50). This is the lowest level since September 2011. Agents had previously highlighted growing hesitancy from buyers given the sharp move higher in home prices and mortgage rates, but even as rates came in, buyer confidence took a hit from the government shutdown and debt ceiling debate, even in markets which on the surface wouldn’t appear overly reliant on the federal government. Weakness was again broad-based, and particularly acute in Seattle, Orlando, Baltimore and Sacramento. Dallas remained at healthy levels, while Denver, Houston and Vegas all improved sequentially.


• Price appreciation continuing to moderate: Our home price index fell to 57 in October from 72 in September, still pointing to higher home prices, but much less broad-based. In addition, 7 of the 40 markets we survey saw sequential declines (vs. no markets seeing declines in each of the past 8 months). Agents also noted increased use of incentives.


Tight inventory levels remain supportive, but are being outweighed by lower demand.


• Longer time needed to sell : Our home listings index pointed to stable inventory levels, but it took longer to sell a home in October as our time to sell index dropped to 42 from 57 (below a neutral 50). This is typically a negative indicator for near-term home price trends.

* *  *

Oh well: the latest mass delusion of instawealth was fun while it lasted.


via Zero Hedge http://feedproxy.google.com/~r/zerohedge/feed/~3/TUSG4thGb5s/story01.htm Tyler Durden

Gold -22% YTD – Sentiment As Poor As October 2008 Prior To 2009, 2010 Surge

Today’s AM fix was USD 1,309.00, EUR 975.12 and GBP 814.16 per ounce.     
Yesterday’s AM fix was USD 1,316.00, EUR 973.45 and GBP 818.46 per ounce.

Gold fell $10.50 or 0.79% yesterday, closing at $1,306.70/oz. Silver slipped $0.18 or 0.83% closing at $21.60. Platinum dipped $12.69 or 0.9% to $1,449.30/oz, while palladium fell $3.58 or 0.5% to $758.25/oz.

Gold surged 2% in euro terms, from €972/oz to €992/oz, after the shock EU interest rate reduction to 0.25%. Subsequently, aggressive selling came into the market with determined sellers pushing prices back down so that gold ended flat in euro terms after the ECB move to near zero percent interest rates.


Gold in Dollars, 3 Years – January 2008 to January 2011 – (Bloomberg)

The shock move suggests the Eurozone economy and individual European economies are even weaker than thought. Overnight, France had its sovereign credit rating cut to “AA” by rating agency Standard & Poor’s. French banks are some of the weakest in the Eurozone and are very vulnerable to the coming bail-ins.

All eyes will be on the U.S. jobs number later today (13:30 GMT). A poor jobs number should see gold rise on safe haven buying due to concerns about the struggling U.S. economy. A weaker economy will likely lead to a continuation of ultra loose monetary policies.

Ultra loose monetary policies continue in the UK and EU. The Bank of England has decided to keep its key interest rate at a record low of 0.5% and continue its quantitative easing, money printing and bond buying at £375 billion. Currency debasement continues suggesting that the UK recovery is anaemic at best and remains vulnerable.

Another important thing to watch is the Chinese Plenum, the four-day meeting of China’s top leaders which gets underway in Beijing on Saturday and is widely expected to be the launch-pad for major economic reforms from the world’s second biggest economy.

The decisions of the Third Plenum meeting may have a huge potential impact worldwide and they are expected to unveil some of their biggest economic reforms for 35 years.

Some have speculated that the price of gold could benefit from this weekend’s summit in China. There could be the expected announcement that the People’s Bank of China has again dramatically increased their gold reserves. Alternatively, new policies could lead to Chinese people continuing to buy gold in huge volumes for financial insurance, store of wealth purposes.

With the Chinese property bubble set to burst, the bust may lead to even greater demand for physical bullion from the gold loving Chinese.


Gold in Dollars, 6 Years Including 2008 Price Falls – (Bloomberg)

The shock ECB interest rate reduction and move to loosen monetary policies even further could be the spark that gold needs to help prices get momentum to the upside again. It will be gold supportive, particularly in euro terms. Murmurings of negative deposit rates are also gold positive.

The ECB is also considering adopting even more radical monetary policies involving  quantitative easing (QE) or the creation of euros in order to buy or monetise government debt as the U.S. is doing with their $85 billion a month bond buying programme. Asked whether the ECB would consider QE, Draghi said a number of options were available before quantitative easing would be considered but did not rule out the possibility.

An even more radical option of negative deposit rates is also being considered. There are suggestions that the ECB is considering charging banks for depositing their reserves with the ECB by imposing a negative deposit rate. Many banks might then pass on this negative rate to depositors meaning that extremely low yielding deposit instruments could become negative and actually cost depositors money.

Gold is down 22%, 26.6% and 30% year to date in dollar, pound and euro terms respectively  (See charts).

Technically, gold looks like it is consolidating between $1,200/oz and $1,400/oz in dollar terms,  £775/oz and £925/oz in pound terms and EUR 900/oz, and EUR 1,100/oz in euro terms.  Gold may have seen its low in all currencies on June 28th (see charts) and this remains the key level of support.


Gold in Pounds, 6 Years – (Bloomberg)

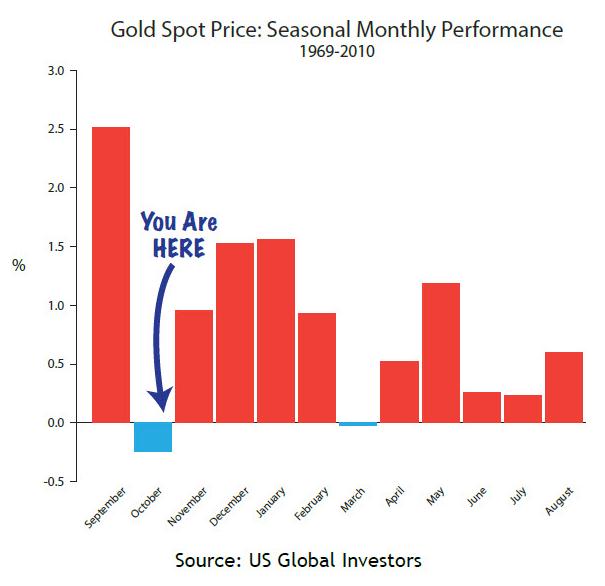
Seasonally, autumn and winter is the strong period for the precious metals due to robust physical demand internationally. This is especially the case in Asia, due to wedding and festival demand and into year end as the Chinese stock up on gold prior to Chinese New Year which this year takes place on January 31st, 2014.

September and November are two of gold’s strongest months in the last 38 years (since 1975) and given the bullish fundamentals, any further weakness is likely to be short term. Interestingly, October is one of gold’s weakest months and weakness in October is often followed by gains in November, December and January making early November a good time to buy gold.

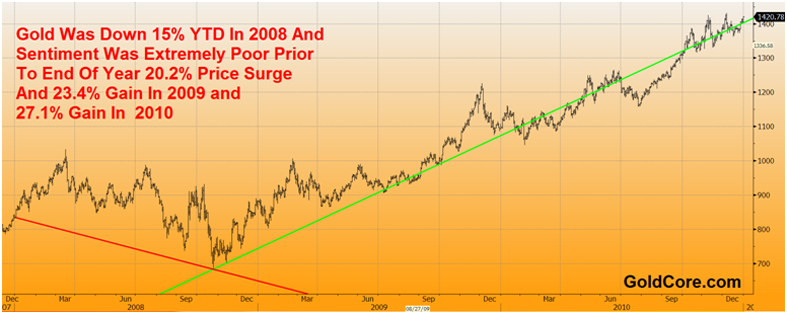
Gold is down 22% year to date and looks set for the first annual decline since 2000. The last time that gold suffered such a poor year to date performance was in 2008. At the start of November 2008, gold was trading down 14.6% for the year.

Sentiment was very poor with banks and analysts saying that the gold bubble had burst and gold was going to fall more. Some said that gold below $500/oz was on the cards. Bearish sentiment was at extreme levels and all notions of fundamental value were thrown out the window as the financial crisis morphed into a global economic crisis.

Stock, commodity and many currency markets internationally were in meltdown on panic selling.

Many announced that gold was no longer a safe haven. Gold and silver’s price fell 4.3% and 8% on October 24th, 2008, on massive deleveraging and wholesale panic selling in all financial markets.

This was despite still very strong demand, shortages and increasing tightness in the physical market. The tightness was spreading from the small coin and bar market up to the larger bar market and premiums on larger bars such as 5 kilo bars and 100 oz bars were also increasing. Gold lease rates remained very high on increasing concern about counterparty risk in the bullion banks.

However that, the point of maximum pain, was actually a great buying opportunity and those who took our advice, diversified and bought on gold’s extremely poor sentiment and weakness, did extremely well in the coming weeks and months. 

Gold bottomed on November 12th, 2008 at $712.30/oz. By the end of November it had risen 12.4% and in December it rose another 7.8%. It thus, reversed the losses for the year and finished 2008 up 5.7% and then went on to see gains of 23.4% in 2009 and 27.1% in 2010.

By early March 2010, gold had reached over $1,215/oz for a gain of 70.7% from the lows on November 12, 2008.

The wisdom of buying when there is extreme doubt and pe
ssimism had been seen again. Those who held their nerve and bought low did very well and will continue to do well.

Those who use today’s lows to gradually accumulate physical bullion coins and bars for delivery or in allocated gold accounts will also be rewarded in the coming months. The fundamentals of gold have not changed and the medium term market drivers of gold remain positive.

Medium Term Market Drivers Of Gold
– Ultra Loose Monetary Policies To Continue > Yellen as New Fed Chair
– Global Debt Crisis > Eurozone & U.S, UK and Japan
– Geopolitical Risk in the Middle East and Globally
– Chinese and Indian Gold Demand
– Futures, GOFO and Gold Backwardation

Ultra loose monetary policies are set to continue for the foreseeable future which is highly supportive of gold and should lead to real record highs, inflation adjusted, over $2,400/oz in the coming years.


Dr Constantin Gurdgiev, Bill Black, Colm O’Regan, David McWilliams and Peter Antonioni @Kilkenomics 2013

We Are @Kilkenomics 2013 – Europe’s First Economics Festival

Click Gold News For This Week’s Breaking Gold And Silver News
Click Gold and Silver Commentary For This Week’s Leading Gold And Silver Comment And Opinion
Like Our Facebook Page For Breaking News, Interesting Insights, Blogs, Prizes and Special Offers


via Zero Hedge http://feedproxy.google.com/~r/zerohedge/feed/~3/jzCRGewGX8w/story01.htm GoldCore

Guess How Many North Carolinans Have Signed Up For Obamacare Via The Website?

North Carolina’s largest insurer is having its share of problems with the Obamacare website. As CBS Charlotte reports, internal emails obtained by WNCN-TV show that Blue Cross Blue Shield show that only 1,000 people had filled out applications as of October 15th. But perhaps most stunningly…only one person was able to successfully use Healthcare.gov to enroll in the new exchange. What is worse, they note that even that single person has not paid, which means the enrollment is not complete.


It gets worse…

Blue Cross Blue Shield found the entire system is so filled with glitches that the company decided not to upload data because it was afraid false information might enter its computer system.


And the emails reveal a scammer was using the insurer’s name to try to obtain personal information.


A person was making phone calls claiming to be with the “National Health Care Registry,” and falsely claim it was taking over healthcare reform contracts from the Blue Cross.


BCBS spokesman Lew Borman told WNCN-TV the company is working with the government to solve these problems.


“We’re hopeful that the issues can be resolved quickly so the Exchange will work seamlessly for our customers,” he said.


via Zero Hedge http://feedproxy.google.com/~r/zerohedge/feed/~3/Pn6VDpXg1X8/story01.htm Tyler Durden