Spot The Odd One Out

All of these things are not like the other… except one!


In all the following charts, the green line is the S&P 500…


Crude Oil is diverging…


High Yield Credit is diverging…


US Macro Fundamentals are diverging…


10Y Yields are diverging…


The USD is diverging…


Earnings expectations are diverging…

and Current earnings are diverging…


Current US GDP is diverging…


US GDP expectations are diverging…


and Dr. Copper is diverging…


But… there is one "asset" that is not diverging from the S&P 500…


Still think its "all about the fundamentals"…?


via Zero Hedge http://feedproxy.google.com/~r/zerohedge/feed/~3/LBArZM351hk/story01.htm Tyler Durden

Dan Loeb's Third Point Returns 10% Of Capital Amid "Concerns About The Global Economy"

It seemed as if this morning’s exuberant run into US equities would never stop but it would appear that comments from none other than Dan Loeb has (for now) put an end to the exuberance. With fundamentals collapsing, and even Cramer’s “Cult stocks” tumbling, today’s rally was yet another blindlingly obvious insight into the fact that this market is entirely artificial and Third Point’s Dan Loeb, worried about the global economy, has reduced his exposure to equities. Furthermore, he plans to return 10% of capital to investors. Not exactly the wealth-effect enhancing, confidence-inspiring action that the Fed hoped for…

Even the cult stocks are rolling over…


Via Third Point:

On US Equities:

These sales decreased long equity exposure, a move consistent with our growing concerns at the time about the global economy

Year-End Return of Investor Capital

Third Point’s assets under management are currently $14 billion. Our increased size is primarily a result of a net annualized return since January 1, 2009 of 24% to investors in the flagship Partners fund and 29% in our slightly levered Ultra fund, which have led growth in the capital base since our initial close to new inflows in mid-2011. In an effort to moderate this growth, we have decided to give back a portion of 2013’s cumulative profits to investors.


We plan to return approximately 10% of capital in our private funds. This amount will be based on year-end account balances and will include any requested redemptions from investors, the deadline for which is October 31st. The capital return will be made to all applicable investors on a pro rata basis, but will exclude employee investments and the investment from our listed vehicle feeder fund (which will separately pay a redemption-funded dividend).


It seems increasingly the biggest (and smartest) players in the room are sensing the music is beginning to stop… Soros, Oaktree, and Klarman’s Baupost among many others…


via Zero Hedge http://feedproxy.google.com/~r/zerohedge/feed/~3/R48dzawC5Uo/story01.htm Tyler Durden

Dan Loeb’s Third Point Returns 10% Of Capital Amid “Concerns About The Global Economy”

It seemed as if this morning’s exuberant run into US equities would never stop but it would appear that comments from none other than Dan Loeb has (for now) put an end to the exuberance. With fundamentals collapsing, and even Cramer’s “Cult stocks” tumbling, today’s rally was yet another blindlingly obvious insight into the fact that this market is entirely artificial and Third Point’s Dan Loeb, worried about the global economy, has reduced his exposure to equities. Furthermore, he plans to return 10% of capital to investors. Not exactly the wealth-effect enhancing, confidence-inspiring action that the Fed hoped for…

Even the cult stocks are rolling over…


Via Third Point:

On US Equities:

These sales decreased long equity exposure, a move consistent with our growing concerns at the time about the global economy

Year-End Return of Investor Capital

Third Point’s assets under management are currently $14 billion. Our increased size is primarily a result of a net annualized return since January 1, 2009 of 24% to investors in the flagship Partners fund and 29% in our slightly levered Ultra fund, which have led growth in the capital base since our initial close to new inflows in mid-2011. In an effort to moderate this growth, we have decided to give back a portion of 2013’s cumulative profits to investors.


We plan to return approximately 10% of capital in our private funds. This amount will be based on year-end account balances and will include any requested redemptions from investors, the deadline for which is October 31st. The capital return will be made to all applicable investors on a pro rata basis, but will exclude employee investments and the investment from our listed vehicle feeder fund (which will separately pay a redemption-funded dividend).


It seems increasingly the biggest (and smartest) players in the room are sensing the music is beginning to stop… Soros, Oaktree, and Klarman’s Baupost among many others…


via Zero Hedge http://feedproxy.google.com/~r/zerohedge/feed/~3/R48dzawC5Uo/story01.htm Tyler Durden

Chart Of The Day: Average New York Banker Makes 5.2 More Than Average Non-Banker

The annual New York State Comptroller report on “The Securities Industry in New York City” is traditionally full of relevant information about the state of Wall Street (previously here) from the perspective of the biggest beneficiary of a strong and vibrant Wall Street: the New Your State tax authority which is happy to collect as much taxes on soaring Wall Street bonuses as the law, and IRS audits, will allow. We list the full report highlights below, but the most salient point is the following: in New York City, the average banker made $360,700 in 2012. This is 5.2 more than the average non-financial job in the city (i.e., all other jobs).

The good news: This is one whole turn lower than the peak 6.2x hit in 2007.

The bad news: Twenty-five years ago, this number was 2.0x.

Which is also the reason why a few hundred thousand bankers pray to
Alan Greenspan every night, and sacrifice a filet mignon in gratitude to
both him and the Great Moderation, which allowed this mindboggling run
up to occur in the first place.

More from the report:

The average salary (including bonuses) paid to securities industry employees in New York City grew rapidly from 2003 through 2007, when it peaked at $401,500. The average salary fell sharply in 2009 as the financial crisis deepened, but much of the loss was regained in 2010. Since then, salaries have remained stable, averaging $360,700 in 2012 (see Figure 4). While the 2012 average salary was less than the 2007 peak, it was higher than in any year prior to 2007, and was by far the highest average among the City’s major industries.


The disparity between the average salary in the City’s securities industry and in the rest of the private sector remains wide, even though recently it has narrowed slightly. In 2012, the average salary in the securities industry was 5.2 times greater than the average in the rest of the private sector ($69,200). At its peak in 2007, the average was 6.2 times greater. Twenty-five years ago, the average salary in the industry was twice as high as in other industries.

Yet looking at the actual amount of bonuses paid out one wouldn’t believe that the ratio was as sticky near its all time highs, as it has been. The chart below shows the amount of actual bonus pool by year on Wall Street. Certainly not at the highs that bankers have grown to expect over the past decade:

So how is the per banker comp still so high? Simple: the number of bankers is being slashed at a pace not seen seen the Lehman bankruptcy.

Why is this important:

OSC estimates that each new job created (or lost) in the securities industry leads to the creation (or loss) of two additional jobs in other industries in the City.


The size of the multiplier reflects the high income levels associated with the industry and its importance in the City’s economy. These additional (or fewer) jobs result from Wall Street firms engaging in additional (or fewer) business-to-business transactions (e.g., with professional services firms and other financial firms), and from Wall Street employees increasing (or decreasing) their household spending on such things as restaurants, stores, travel and personal services.


OSC also estimates that each Wall Street job created (or lost) results in one additional (or fewer) job elsewhere in New York State, primarily in the City’s suburbs. Many Wall Street employees are commuters, who live and spend in the suburbs, thereby supporting local businesses and generating jobs.

Translation: less Wall Street jobs, much less NY State (and City) taxes.

Here is what the report had to say on the topic of banker bonuses:

Like most businesses, financial firms report compensation (i.e., base salary, fringe benefits and bonuses, including deferred remuneration) on an accrual basis of accounting. As such, cash bonuses paid in January through March of one calendar year (for work performed during the prior calendar year) are reported in the prior year’s financial statements. For example, most of the resources that are being set aside for cash bonuses in 2013 will be paid out during the first quarter of 2014.


Previously, most bonuses reflected work done in a given year and were paid in cash. This tended to reward short-term profits at the expense of long-term performance. In response to new regulations and other compensation reforms designed to reduce excessive risk-taking, firms have raised base salaries, and now pay a smaller share of bonuses in the current year while a larger share is deferred to future years in the form of cash, stock options or other forms of compensation. Clawback provisions have also been implemented.6 In addition, a greater share of bonuses is now being paid outside the traditional bonus period, making it harder to distinguish bonuses from base salaries.


While these developments have made estimating the size of the cash bonus pool more difficult, they have also  reduced volatility in industry tax payments to the State and City. Collections now reflect an average of bonus payments from several years, allowing strong years to offset weak years.


In February 2013, OSC estimated that the cash bonus pool for securities industry workers in New York City paid during the traditional bonus season grew by 8 percent to $20 billion (see Figure 3). The increase in the size of the cash bonus pool reflects a number of developments, including payments received for work done in 2012, when profits were strong, and the realization of bonuses deferred from prior years (including income accelerated into 2012 from future years to avoid the higher federal income tax rates that took effect in  2013).


Total compensation for the broker/dealer operations of member firms of the New York Stock Exchange increased by 5.5 percent during the first half of 2013, and an OSC examination of the financial statements of a sample of large and small firms (including firms that engage in a broader range of activities than traditional broker/dealer operations) also found that compensation was higher than last year.7 These trends suggested that bonuses might be higher in 2013, but recent developments have cast doubt on that outlook. Although it is too early to predict the size  of the 2013 bonus pool, bonus awards traditionally vary by firm and by business activity.

Other highlights from the report:

  • The average salary in the securities industry in New York City was
    $360,700 in 2012. While the 2012 average was less than the 2
    007 peak, it
    was higher than in any year prior to 2007, and was 5.2 times greater
    than the  average salary in the rest of the private sector.
  • The securities industry had a strong first half of 2013, with broker/dealer profits of $10.1 billion, but profitability is likely to be lower in the second half of the year.
  • Despite strong profits over the past four years, the securities industry is smaller in New York City than before the financial crisis. Securities industry employment totaled 163,400 jobs in August 2013, 25,600 fewer (13.5 percent) than before the crisis.
  • The securities industry showed strong job growth during the first part of the recovery (adding 9,600 jobs), but since August 2011 it has resumed streamlining and has lost 7,300 jobs.
  • New York City has experienced very strong private sector job growth during the recovery, but the securities industry has made only a small contribution (less than 1 percent). In contrast, the industry played a much larger role in employment growth during prior recoveries.
  • The securities industry is one of the City’s main economic engines. Even though the industry accounted for only 5 percent of private sector jobs in 2012, it accounted for 22 percent of wages.
  • OSC estimates that City tax payments from securities industry-related activities (including capital gains) grew by 27 percent to $3.8 billion last fiscal year, fueled by changes in federal tax rates. This represents the second-highest level on record, and is higher than before the crisis.
  • Last fiscal year, securities-related activities accounted for 16 percent of New York State’s tax revenue and 8.5 percent of New York City’s.
  • Regulatory reform has proceeded at a slow pace. Less than half (40 percent) of the rules required by the Dodd-Frank Act have been completed, although the industry has begun to modify its practices in anticipation of regulatory changes

Full report can be found here.


via Zero Hedge http://feedproxy.google.com/~r/zerohedge/feed/~3/SILhmp5EQss/story01.htm Tyler Durden

Panic Buying Continues

Despite NFLX giving back half its after-hours gains, the NASDAQ is surging to new 13-year highs, the S&P cash crosses 1750 (to new all-time highs), and the Dow Transports explodes higher (to yet another record) for the ninth of the last 10 days. All of this as the USD is monkey-hammered and the EUR surges to 2-year highs… Treasury yields are dropping fast (down 5-7bps across the curve). As we noted last week, US equities have caught up entirely to the Fed balance sheet. Gold (back above its 100DMA) and silver are surging and oil is pressing back up towards $100. The reason for all this exuberance: the jobs number was sufficiently horrible it has moved the tapering consensus to March 2014 of beyond…

Gold has broken above its 100DMA…


Treasury yields are dropping fast…


EURUSD at 2-year highs…


US equities just won't stop…


and this is why…

Perhaps equities will stall here as they have reached their short-term Fed balance sheet fair value… or not…


Charts: Bloomberg


via Zero Hedge http://feedproxy.google.com/~r/zerohedge/feed/~3/uvcBUBKqodw/story01.htm Tyler Durden

Guest Post: Why We Face Ruin

Originally posted at The World Complex blog,

A nice compendium of UK economic data has recently appeared (h/t NESS). You are encouraged to download data sets for your own nefarious purposes.

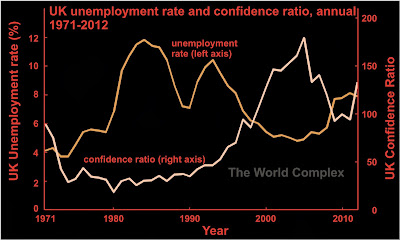
As an example, I have decided to plot UK unemployment rate against the measure of confidence I proposed on these pages a couple of years ago. To recap, the confidence ratio is the ratio of outstanding public debt (in dollars) to the dollar value of the country's gold holdings. I chose "confidence" as presumably this ratio can only be high for a country in which investors have great confidence. For those of a different mindset, it can be viewed as a measure of a country's ruin (although it would be better to include other foreign currency reserves).
 

UK unemployment data from the site mentioned above. UK debt came from google public data. UK gold holdings came from the data sets available from the World Gold Council. To find the dollar value of gold holdings, I used averaged annual prices available at Kitco. Average conversion rate of GBP to USD available here (although I don't remember where I got it for the original posting, which was up to 2011).

That is a good-looking example of negative correlation. It tells us that the unemployment falls when the confidence ratio is high. Now, there are three ways for a government to increase that confidence ratio:

1) increase debt


2) sell off gold


3) pray for the price of gold to fall (obviously in a non-manipulative manner that doesn't direct profits to favoured entities).

The fall in confidence that we observed in the latter half of the last decade was entirely due to the rising price of gold. Look at what that did to the unemployment rate! Clearly the fault of gold-bugs and conspiracy theorists. The rising price of gold completely overrode the excellent work of the British Parliament in driving up the country's debt. As for Gordon Brown, he was a hero! His only flaw was in not going far enough. If he had sold all the UK's gold, imagine how low unemployment would be today!

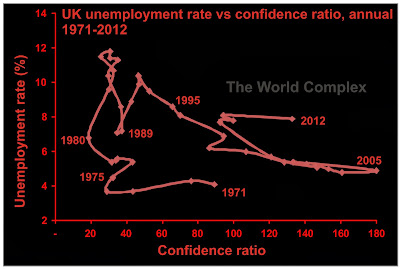
This wouldn't be a post on the World Complex if we didn't do some kind of state space portrait, so here it is: unemployment rate vs. confidence ratio.

Policy decisions of British Parliament and their impact on unemployment can be followed from the above chart. Clearly the government in the 1970s laboured under the delusion that reducing debts would benefit the economy(1). They were rewarded for their imprudence by spiking unemployment in the early 1980s.

By the mid-1990s, they had discovered the golden ticket. With the rising confidence ratio, the UK was rewarded with a falling unemployment rate. Then came Gordon Brown's heroics–by aggressively selling gold he caused the confidence ratio to fall and the UK was showered with new jobs!

There was a small crisis in the latter part of the last decade. But since then–clearly back on track. If the forward evolution of the system follows a similar catenary to the period 1993-2005, then a mere quadrupling of the confidence ratio will restore the unemployment rate to about 6%. The most prudent way to achieve this would be to immediately sell off 75% of Britain's remaining gold (2).

I find this approach to finances inspiring, and am willing to give it a try. Here at The World Complex, the unemployment rate is unusually high (technically I am welcome to go to the office, but the treasury is empty). Looking at my finances, I see the problem–I have very little debt and high savings (although much lower than they were two years ago, thanks to the ongoing turmoil in the junior mining market). To rectify this oversight, I will be issuing bonds. For reasons of fiscal prudence, I will try to keep my confidence ratio below 100, and will begin an auction for $25 million in debt next Thursday (3). No cheap google ad payouts here!

Notes:

(1) the rising price of gold may have had something to do with this. But this proves my point! Rising gold price = rising unemployment, you naughty gold bugs.

(2) in my opinion it would be too difficult to drive the gold price back down to $300/oz.

(3) securities officers and other sarcastically challenged individuals take note–this is intended as sarcasm. Your participation is welcome.


via Zero Hedge http://feedproxy.google.com/~r/zerohedge/feed/~3/A3XPKhB5RAo/story01.htm Tyler Durden

Goldman: "Weaker Than Expected" Jobs Report Means No Taper Before March

Yesterday Goldman explained why glorious and abysmal job numbers would both be sufficient to propel the Stalingrad and Poor to new ATH. So far, they were right. And while the number was not exactly abysmal (ironically, the market is now hung up on weaker than expected data just to make sure Uncle Ben and Uncle Janet stay around as long as possible), it was, as Goldman’s Jan Hatzius just announced, “somewhat weaker than expected, as the disappointment on September payroll growth was only partly offset by back-month revisions, while average hourly earnings grew more slowly than expected.” He said a bunch of other things too, but the most notable was that “this report makes it more likely that the Fed pushes the first reduction in the pace of its asset purchases into 2014… we think that March is the most likely date under our economic forecast.” And since it is now obvious that the Fed is completely oblivious to what ongoing QE does to high quality collateral (which it is now soaking up at a pace of 0.4% in 10Yr equivs per week), full steam ahead it is. We expect Dudley to get his Hatzius marching orders shortly.

From Goldman:

The unemployment rate ticked down, but benefitted from favorable rounding and a small decline in the participation rate on an unrounded basis. Although December remains a possibility, this report makes it more likely that the Fed pushes the first reduction in the pace of its asset purchases into 2014. While the uncertainty is considerable, we think that March is the most likely date under our economic forecast, and the assumption that the next set of fiscal deadlines proves less disruptive than the most recent set.

MAIN POINTS:

1. Payroll employment rose 148k in September (vs consensus 180k). While August employment growth was revised up?as has been the typical pattern in recent years?July employment growth was revised down, leaving the net revision to the prior two months only +9k. By industry, all of the slowdown in job growth relative to August was found in private service-providing industries, as employment in leisure and hospitality fell 13k (vs. +21k in August) and employment in health and education services rose only 14k (vs +61k in August). In contrast, construction employment rebounded (+20k), potentially due in part to more favorable weather in September, while government added 22k jobs, entirely due to the state and local sector. This morning’s report leaves the 3-month trend in payroll job growth at +143k and the 12-month trend at +185k.

2. The unemployment rate declined by one-tenth to 7.2% to one decimal place (vs consensus 7.3%). On an unrounded basis, the decline was a smaller four basis points to 7.235%. Although employment grew by 133k according to the household survey, on a payroll-consistent basis?adjusting for definitional differences between the two surveys?employment declined 195k. While the labor force participation rate held constant to one decimal place at 63.2%, on an unrounded basis the rate continued to edge down slightly.

3. Average hourly earnings grew only 0.1% in September (vs consensus +0.2%), leaving the 12-month rate of increase at 2.1%. The average hourly workweek was unchanged at 34.5. The index of aggregate weekly hours?the product of workers and hours per worker?grew at an only-modest 1.1% annual rate during Q3.

4. Although December remains a possibility, this report makes it more likely that the Fed pushes the first reduction in the pace of its asset purchases into 2014. While the uncertainty is considerable, we think that March is the most likely date under our economic forecast, and the assumption that the next set of fiscal deadlines proves less disruptive than the most recent set. We continue to expect the first increase in the fed funds target rate in 2016 Q1.

5. With the employment report, manufacturing data, and sentiment surveys in hand, we start our September CAI at 2.6%, down from 3.1% in August.


via Zero Hedge http://feedproxy.google.com/~r/zerohedge/feed/~3/V5t_f6eD1EM/story01.htm Tyler Durden

Goldman: “Weaker Than Expected” Jobs Report Means No Taper Before March

Yesterday Goldman explained why glorious and abysmal job numbers would both be sufficient to propel the Stalingrad and Poor to new ATH. So far, they were right. And while the number was not exactly abysmal (ironically, the market is now hung up on weaker than expected data just to make sure Uncle Ben and Uncle Janet stay around as long as possible), it was, as Goldman’s Jan Hatzius just announced, “somewhat weaker than expected, as the disappointment on September payroll growth was only partly offset by back-month revisions, while average hourly earnings grew more slowly than expected.” He said a bunch of other things too, but the most notable was that “this report makes it more likely that the Fed pushes the first reduction in the pace of its asset purchases into 2014… we think that March is the most likely date under our economic forecast.” And since it is now obvious that the Fed is completely oblivious to what ongoing QE does to high quality collateral (which it is now soaking up at a pace of 0.4% in 10Yr equivs per week), full steam ahead it is. We expect Dudley to get his Hatzius marching orders shortly.

From Goldman:

The unemployment rate ticked down, but benefitted from favorable rounding and a small decline in the participation rate on an unrounded basis. Although December remains a possibility, this report makes it more likely that the Fed pushes the first reduction in the pace of its asset purchases into 2014. While the uncertainty is considerable, we think that March is the most likely date under our economic forecast, and the assumption that the next set of fiscal deadlines proves less disruptive than the most recent set.

MAIN POINTS:

1. Payroll employment rose 148k in September (vs consensus 180k). While August employment growth was revised up?as has been the typical pattern in recent years?July employment growth was revised down, leaving the net revision to the prior two months only +9k. By industry, all of the slowdown in job growth relative to August was found in private service-providing industries, as employment in leisure and hospitality fell 13k (vs. +21k in August) and employment in health and education services rose only 14k (vs +61k in August). In contrast, construction employment rebounded (+20k), potentially due in part to more favorable weather in September, while government added 22k jobs, entirely due to the state and local sector. This morning’s report leaves the 3-month trend in payroll job growth at +143k and the 12-month trend at +185k.

2. The unemployment rate declined by one-tenth to 7.2% to one decimal place (vs consensus 7.3%). On an unrounded basis, the decline was a smaller four basis points to 7.235%. Although employment grew by 133k according to the household survey, on a payroll-consistent basis?adjusting for definitional differences between the two surveys?employment declined 195k. While the labor force participation rate held constant to one decimal place at 63.2%, on an unrounded basis the rate continued to edge down slightly.

3. Average hourly earnings grew only 0.1% in September (vs consensus +0.2%), leaving the 12-month rate of increase at 2.1%. The average hourly workweek was unchanged at 34.5. The index of aggregate weekly hours?the product of workers and hours per worker?grew at an only-modest 1.1% annual rate during Q3.

4. Although December remains a possibility, this report makes it more likely that the Fed pushes the first reduction in the pace of its asset purchases into 2014. While the uncertainty is considerable, we think that March is the most likely date under our economic forecast, and the assumption that the next set of fiscal deadlines proves less disruptive than the most recent set. We continue to expect the first increase in the fed funds target rate in 2016 Q1.

5. With the employment report, manufacturing data, and sentiment surveys in hand, we start our September CAI at 2.6%, down from 3.1% in August.


via Zero Hedge http://feedproxy.google.com/~r/zerohedge/feed/~3/V5t_f6eD1EM/story01.htm Tyler Durden

Where The September Jobs Were: Truck Drivers, Bureaucrats, Salesmen And Temps

As part of our monthly NFP-day tradition, we break down the monthly job gains (and losses) by industry. So here they are: in September the biggest job gaining sectors, accounting for 86K jobs or 58% of the total 148K jobs added, were the following  four industries:

  • Transportation and Warehousing: + 23K
  • Government: +22K
  • Retail Trade: +21K
  • Temp Help: +20K

In short: nearly two thirds of all jobs created in September (according to the BLS’ increasingly more flawed data so these numbers are likely completely made up) were truck drivers, bureaucrats, salespeople and temps.

What about “real” jobs: well, Financial Activities were down 2K, Manufacturing were up 2K, Information (those very critical programmers so instrumental in the glitchless roll out of Obamacare): +4K, and Professional and Business Services (ex temps): +12K.

Quality all the way.

Source: BLS


via Zero Hedge http://feedproxy.google.com/~r/zerohedge/feed/~3/o1ECAX_CUqE/story01.htm Tyler Durden

If You Believe In The Recovery, Do Not Look At This Chart

Just a few moar years of unlimited open-ended quantitative money printing and we are sure this will all be fixed…


via @Not_Jim_Cramer


Of course it does beg the question Rick Santelli asked

"[What the Fed minutes said] is, listen, we have to wait for bigger confirmation that the economy is doing better; and for that, we're going to look at the employment side. [At the same time] we have the fewest people working that can work in 30 years, and all-time-record-high profits for corporations. Now, does that strategy sound rational to you?" It seems, now that Bernanke has seemingly promised that it will really never end, that Santelli's question will become increasingly critical in this country.


How does this end?


via Zero Hedge http://feedproxy.google.com/~r/zerohedge/feed/~3/UJl6yFQrWmk/story01.htm Tyler Durden