Autopilot Was Engaged In Fatal SoCal Tesla Wreck Earlier This Month, Authorities Reveal

Autopilot Was Engaged In Fatal SoCal Tesla Wreck Earlier This Month, Authorities Reveal

A Tesla that was involved in a fatal crash in Southern California last week was operating on Autopilot at the time, it has been revealed. The crash is still is under investigation by the National Highway Traffic Safety Administration, a report from ABC noted on Friday.

The crash, which took place on May 5 in Fontana, killed the 35 year old driver after his Model 3 hit an overturned semi on the freeway. A second person was seriously injured after the Model 3 hit him, while he was trying to help the driver of the overturned semi.

On Thursday of this week, the California Highway Patrol announced that the car was operating on Autopilot, which has been no stranger to controversy involving fatal Tesla wrecks. This wreck marks at least the fourth death in the U.S. involving Autopilot. 

The information was so important, the CHP felt, that they shared it despite the ongoing investigation, stating: “While the CHP does not normally comment on ongoing investigations, the Department recognizes the high level of interest centered around crashes involving Tesla vehicles. We felt this information provides an opportunity to remind the public that driving is a complex task that requires a driver’s full attention.”

Just days prior, the CHP arrested yet another Tesla driver who it said was in the back seat of his vehicle while it barreled down Interstate 80 near Oakland. Autopilot or Full Self Driving were assumed to be operating. 

There is also an ongoing NHTSA investigation involving a fatal Tesla wreck that took place in Houston weeks ago. The NTSB has issued a preliminary report in that case, finding that a similar vehicle could have engaged Traffic Aware Cruise Control, but not Autosteer, at the point where the crash took place. 

The NTSB concluded by stating that the investigation was ongoing and that it was working with Harris County Texas Precinct 4:

The NTSB continues to collect data to analyze the crash dynamics, postmortem toxicology test results, seat belt use, occupant egress, and electric vehicle fires. All aspects of the crash remain under investigation as the NTSB determines the probable cause, with the intent of issuing safety recommendations to prevent similar crashes. The NTSB is working alongside the Harris County Texas Precinct 4 Constable’s Office, which is conducting a separate, parallel investigation. 

Recall, it was Mark Herman, Harris County Constable Precinct 4, who was most skeptical of Elon Musk’s comments absolving Autopilot of liability last month, telling Reuters that the police served search warrants on Tesla to secure data from the Model S. 

Responding to Musk at the time, Herman said: “If he is tweeting that out, if he has already pulled the data, he hasn’t told us that. We will eagerly wait for that data.”

“We have witness statements from people that said they left to test drive the vehicle without a driver and to show the friend how it can drive itself,” Herman said according to the Reuters report.

Tyler Durden
Fri, 05/14/2021 – 15:20

via ZeroHedge News https://ift.tt/3tKMiTv Tyler Durden

Home Prices Are Soaring So Fast, They Are Negating The Benefits Of Low Mortgage Rates

Home Prices Are Soaring So Fast, They Are Negating The Benefits Of Low Mortgage Rates

A recent report in the Wall Street Journal that cited data from the National Association of Realtors and Fannie Mae caught our eye by highlighting an unfortunate reality of low interest rates: while they initially help even the playing field and make homes more affordable for more Americans, after a while, price appreciation will ultimately make housing less accessible for middle- and working-class Americans.

Using data combined with anecdotes from home buyers, WSJ illustrated how the rapid pace of price appreciation over the last year is affecting the outlook for the housing market, as high prices negate the impact of mortgage rates that are still near record lows.

Nationwide, the median existing-home sales price rose 16.2% in the first quarter to $319,200, a record high in data going back to 1989, NAR said.

Prices are rising so rapidly that they are outweighing the benefit of rock-bottom borrowing rates. In the first quarter, the typical monthly mortgage payment rose to $1,067, from $995 a year earlier, NAR said, even as mortgage rates declined.

Of course, the frenzied state of the American real estate market is nothing new.

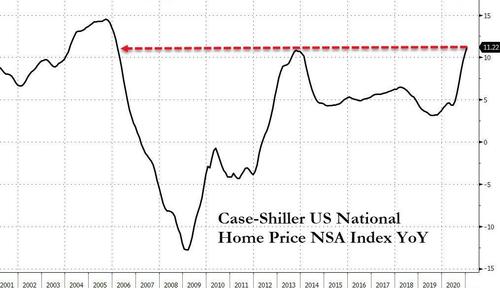
The other day, we reported that home sales prices in the country’s hottest markets had risen by their widest level since 2006, according to the Case-Shiller Home Price Index, a closely watched measure of home prices in the US which offers a breakdown by region, as well as nationally. According to Case-Shiller, US home prices in 20 major cities are up a shocking 11.10% year-over-year.

But outside the major metro markets, demand was even stronger, translating into the biggest YoY increase in median sales since 2006.

As for that data we noted earlier, the NAR found that 182 of the 183 regions it tracks are reporting higher median sales prices than the year prior. But even more notably, 89% of those areas are seeing prices up more than 10%.

Thus far, the housing boom has been so widespread in part due to low mortgage rates, which have made mortgages more affordable, and more obtainable, for middle-class Americans. But economists believe that the inflection point where buyers of more modest means are priced out of the market is near. In other words, it’s one thing when ritzy markets like NYC and San Francisco see home prices boom. But when it starts happening in Boise, the outlook for price appreciation is much more limited, because the pool of potential interested buyers is much more limited.

Speaking of Boise…

In the Boise, Idaho, metro area, where median home prices surged 32.8%, Julie Cook struggled to find a house within her budget. She and her mother moved to Boise from Florida in January. Ms. Cook had looked at house listings before she moved and planned to buy a house in Boise for under $300,000. But by the time she arrived, there was little that amount could buy.

Ms. Cook ended up purchasing a townhouse for $330,000 in March. “It’s really not my dream or anything,” she said. “But I felt like I needed to, for mine and my mom’s sake, find a place that we could afford.”

Already, first-time home buyers are struggling with soaring prices, as those with limited budgets increasingly lose out to cash buyers, and economists at Fannie Mae are taking this into account.

Economists have said the pace of price increases is likely to slow later in the year and next as more people are priced out of the market, especially if mortgage rates tick higher. Mortgage-finance company Fannie Mae is forecasting median existing-home prices to rise 11.5% in 2021, then slow to a 4% increase in 2022.

“With low inventory already impacting the market, added skyrocketing costs have left many families facing the reality of being priced out entirely,” Mr. Yun said.

And while commodity prices soar amid a construction boom, it’s worth noting that easy government money (and artificially low interest rates thanks to the Federal Reserve) aren’t the only factors driving home prices higher.

Record-low inventory is also a factor. Data show Americans are staying in homes longer, and that the number of homes on the market has tumbled as the pandemic has made many who already own comfortable homes less inclined to sell (whether that’s due to the fear of letting strangers in their home in the middle of a pandemic, or the unwillingness to navigate the market as a buyer).

Across the country, and especially outside the big cities, brokers are warning that they have never seen demand so high. But for any investors looking for a potential opportunity to flip, just remember: while remote work is probably here to stay, the pace of this torrid market might not be as durable.

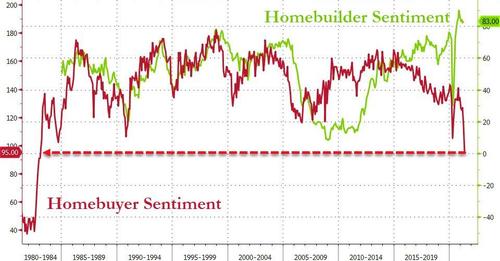
And if anything brings that home, it is this chart, as we noted earlier, showing home-buying sentiment has collapsed to its weakest since 1983…

Get back to work Mr.Powell!

Tyler Durden
Fri, 05/14/2021 – 14:59

via ZeroHedge News https://ift.tt/3hmglhU Tyler Durden

The US Government Is On Track To Top Last Year’s Record-Breaking Deficits

The US Government Is On Track To Top Last Year’s Record-Breaking Deficits

Authored by Ryan McMaken via The Mises Institute,

The Treasury department has issued its spending and revenue report for April 2021, and it’s clear the US government is headed toward another record-breaking year for deficits.

According to the report, the US federal government collected $439.2 billion in revenue during April 2021, which was a sizable improvement over April 2020 and over March 2021. Indeed, April 2021’s revenue total was the largest since July of last year when the federal government collected 563.5 billion following several months of delays on tax filing deadlines beyond the usual April 15 deadline. (Not surprisingly, in most years, April tends to be the federal government’s biggest month for tax collections.)

In spite of April’s haul, however, the federal government managed to spend much more than that, with spending topping $664 billion during April. This means the federal government ran a sizable deficit in April of 225.6 billion. This was a middling sum compared to other monthly deficits this fiscal year (which began on October 1), but deficits are adding up fast.

For the first seven months of this fiscal year combined, the US government collected $2.1 trillion in revenue, yet it spend nearly twice as much: $4.1 trillion, or 90 percent more than it collected.

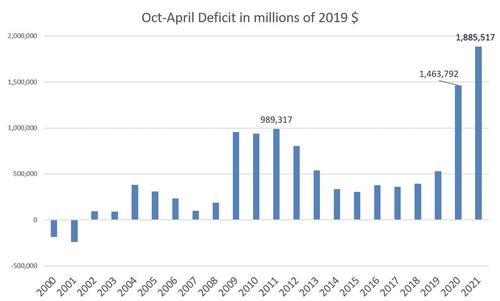
Put another way: for the first seven months of this fiscal year (2021), the total deficit already totals $1.9 trillion. During the same period of last year, this total was $1.5 trillion. 

For the first seven months of each year going back to 2000, even if adjusted for inflation, we see that 2020 and 2021 ran much larger deficits even than was the case during the Bush-Obama spending spree kicked off in late 2008 and peaking in 2011.

With five months left to go in the fiscal year, and with the deficit already approaching 2 trillion, it won’t take more than Biden’s $2 trillion infrastructure bill to ensure that 2021’s deficit soars to new record-breaking levels. That is, the US on course to beat last year’s full-year deficit by the time this fiscal year comes to an end.

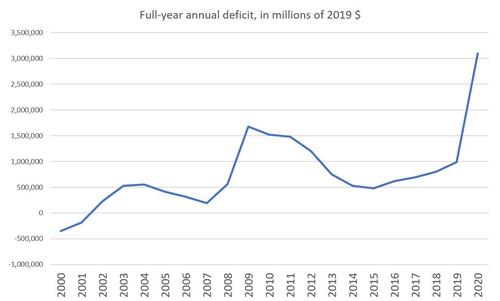
In the second graph, we see that the full-year deficit for the 2020 fiscal year was a record-breaking 3.1 trillion. This was far in excess of any previous year, even adjusted for inflation. During 2009, for example, the deficit reached “only” $1.4 trillion.

The total national debt is now approaching $30 trillion, and was $27.7 trillion at the end of the fourth quarter of 2020. Taken as a percentage of GDP, the debt is now exceeding even the extraordinary levels reached during the Second World War, making the current fiscal crisis the largest one, proportionally, to have ever occurred during peace time. In terms of annual deficits, only three years in American history exceeded 2020’s deficit as a percentage of GDP: 1943, 1944, and 1945.

The administration has yet to even begin talking about scaling back these astronomical spending levels. This is partly due to the fact that April’s jobs report was such a disappointment. In spite of predictions of over a million new jobs, the actual estimate came in around 266,000. As I noted in an article last week, a lack of new hires is due partly to the fact that more than nine million American workers are collecting some form of unemployment insurance payment. But that’s not all. Over the past year, 4 million workers have left the labor force altogether for a variety of reasons, and they’re not actively looking for work.

To some this might suggest it is time to scale back unemployment payments, but the Biden administration used the job figures to justify additional spending, claiming “we’ve got work to do.”  What he means is: “we need to spend more money.”

These record-breaking deficits are also likely to mean more monetization of debt. Last March, after several months of some small declines in the size of its portfolio, the Fed again began buying up Treasuries and other assets to inject liquidity into the financial sector yet again. The Fed was already sitting on $4 trillion in assets in early 2020, but by June, total assets had skyrocketed to $7 trillion. Much of this was Treasuries, since as Bloomberg reports: 

When the Fed began buying Treasuries in March 2020 to calm the market during the pandemic panic, it targeted the sectors that were under the most stress, in quantities as large as $75 billion a day. By June, the program stabilized at $80 billion a month…

In other words, the debt is being converted to cash. Needless to say, these purchases are badly needed not just to “calm the market” and keep hedge funds and bankers liquid. The purchases are part of an essential game to augment demand for Treasuries, and thus keep interest rates low so the US government doesn’t face an explosion of its total costs for debt service.  In 2020, the US spent approximately $350 billion on interest payments. (For context, the budget for all veterans’ benefits is about $250 billion.) This number is only going to go up and consume more and more of the federal budget. Moreover, if interest rates go up, interest payments will increase even faster than the total debt. 

Since January, the yield on the 10year Treasury has increased 50 percent from approximately 1 percent to 1.5 percent.  If this trend continues, the US taxpayer will be on the hook for big increases in interest payments which will have to come out of other areas of the budget, or by printing more money which will only further devalue the dollar. 

There’s no easy solution, and this is why those old-fashioned, fuddy-duddy economists have been warning against runaway spending for years. Eventually the taxpayers have to pay for it, either through a ruined currency, or by slashing government spending in other areas. Or through tax increases. But for now, politicians will keep kicking that can down the road, and hope they can blame someone else when the reality becomes undeniable. 

Tyler Durden
Fri, 05/14/2021 – 14:40

via ZeroHedge News https://ift.tt/2RivINH Tyler Durden

Did China Just Kill The Commodity-Craze?

Did China Just Kill The Commodity-Craze?

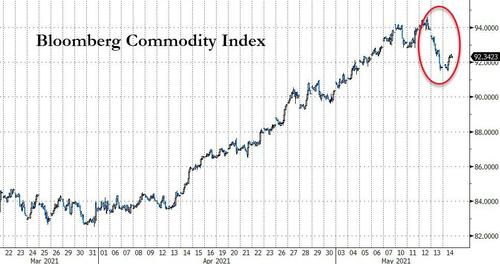
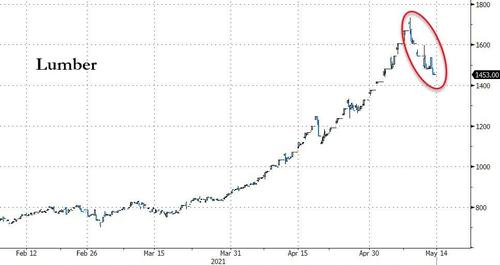
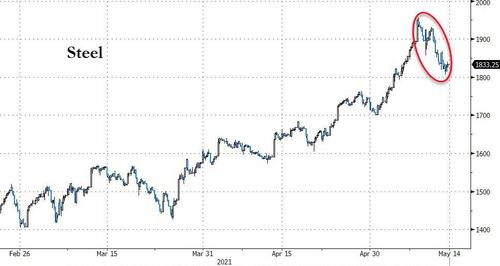
After weeks of vertical rampage, commodity prices broadly tumbled this week as everything from lumber to iron ore saw their first weekly drop in months.

Source: Bloomberg

While it may be early, the sudden reversal across the commodity space has many wondering if the bubble has popped.

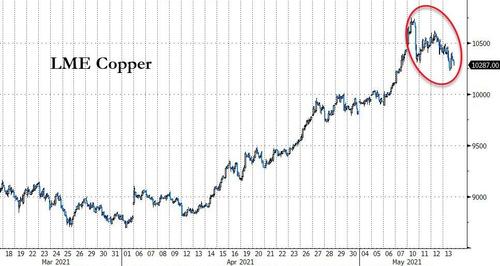
Copper prices were on course for their first weekly decline since the start of April on Friday as rising inflation fears and a dip in demand from China dragged prices down.

“The high copper price appears to have curbed demand,” said broker Marex Spectron.

Source: Bloomberg

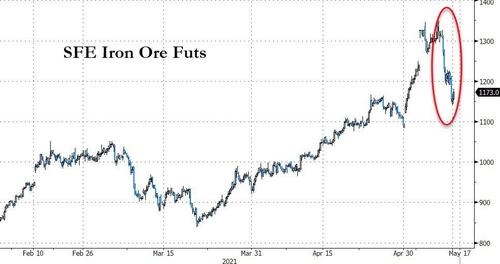
Iron ore continued its fall from a record amid efforts by China to clamp down on surging prices, with the metal set for the biggest two-day plunge since 2019.

Source: Bloomberg

And even lumber’s long run of gains is stalling…

Source: Bloomberg

With Capital Economics warning “we forecast [lumber] prices will fall to $600 per 1,000 sq.ft by end-2021.

Meanwhile, warnings of a crackdown on misbehaviour in the steel market hammered Chinese steel prices…

Source: Bloomberg

So what’s happening?

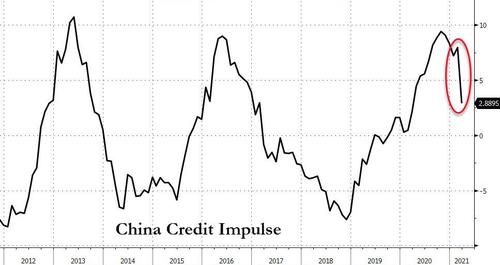
We have vehemently explained over the past few years that ‘as goes China’s credit impulse, so goes the world’ and it would appear, once again, that is occurring. Specifically, this week saw data showing new bank loans in China fell more than expected in April and money supply growth slowed to a 21-month low, pointing to slower growth in the world’s biggest metals consumer.

Source: Bloomberg

Even worse, the Chinese government also warned that it will monitor and effectively ‘manage’ a rapid increase in commodity prices, without specifying how.

Tyler Durden
Fri, 05/14/2021 – 14:20

via ZeroHedge News https://ift.tt/3tMUrHg Tyler Durden

Here Are The Industries Crushed By Biden’s “Generous Unemployment Benefits”

Here Are The Industries Crushed By Biden’s “Generous Unemployment Benefits”

When even Goldman – which has a history of aligning with the White House and the prevailing political administration du jour – refutes the falsehoods spread by the Biden administration about the origins of the unprecedented labor shortage, it’s time to change the narrative.

In a note published today by Goldman chief economist Jan Hatzius, observes what is well known, namely that the “much weaker-than-expected job growth and much stronger-than-expected wage growth in last Friday’s employment report suggests that the labor market is much tighter than a 6.1% headline unemployment rate suggests” but it is what he says next that insures no Goldman economist will receive an invitation to the White House for the next few years.

According to the bank, the current labor market tightness reflects not any of the trite, general and incorrect reasons spouted by the White House for the record labor shortage, but is a result of “unusually generous unemployment insurance benefits.” And in case there is any confusion, here it is again:

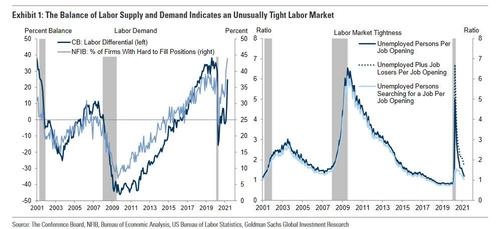
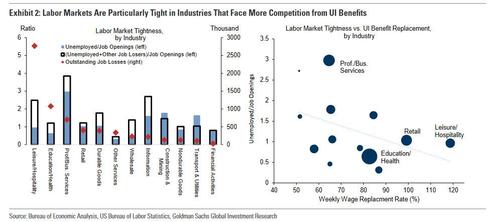
The main reason for the current labor market tightness is that that labor demand has recovered quickly—as indicated by the elevated labor differential and high share of firms with hard to fill positions (left chart, Exhibit 1)—while many workers remain out of the labor force due to unusually generous unemployment insurance (UI) benefits and lingering virus-related impediments to working. 

As a result, the ratio of unemployed workers searching for a job to job openings has fallen to 1.0 (light blue line; right chart, Exhibit 1)—a level typically associated with tight labor markets.  If all workers who lost their job since the start of the pandemic (including those who have left the labor force) were looking for work, the ratio of job seekers to openings would be 1.7 (dark blue dotted line), a level that corresponded to 5.8%unemployment last cycle.

Hatzius also notes that “generous UI benefits have put upward pressure on wages, particularly for lower-income workers, whose average self-reported reservation wage—the lowest wage they would accept for a new job—has increased by 21% since the fall.”

As a result, the Goldman economist says that “the ratio of unemployed workers to job openings has fallen to a level typically associated with tight labor markets, particularly in the low-wage service sectors that face more competition from UI benefits and account for a large number of remaining job losses.”

Of course, none of it is news to anyone except perhaps for Biden’s handlers and whoever writes the text for his teleprompter.

What we did find interesting is Goldman’s analysts of which industries have been crushed the hardest by Biden’s generous unemployment benefits which have forced the private sector to compete with Uncle Sam.

  • In the chart below left, Goldman calculate the ratio of unemployed workers to job openings (blue bar) and the ratio of unemployed workers plus those previously employed but not currently searching to job openings, for each industry (black bar), with industries ordered according to outstanding job losses. The blue bars are generally lower and the difference between the blue and black bars is generally larger for industries on the left, meaning that the labor market is tighter in industries with a large number of outstanding job losses, in part because a larger share of job losers in those industries are not looking for work and therefore not counted as unemployed.
  • In the chart below right, Goldman plots the ratio of unemployed workers to job openings against the wage replacement rate from UI benefits for the median worker in each industry.  The negative relationship suggests that labor markets are tighter for lower-wage industries where employers face more competition from UI benefits when hiring workers.

Goldman concludes that “this imbalance between labor supply and demand is probably the cause of the surprising recent strength in wage growth.”

Or, in other words – as we have said all along – it is Biden himself that is making it impossible for small firms to hire, and since they are competing with behemoths like McDonalds and Amazon for whom offering a $500 signing bonus is a walk in the park, Biden is actively facilitating the destruction of all those small and medium “mom and pop” businesses which managed to survive the decimation of the covid pandemic, and is making sure that whatever market share they have is promptly lost to publicly traded megafirms such as Amazon, WalMart and others.

If that news was bad, this is even worse: according to Goldman this state-sponsored destruction of small firms won’t fade until September: “labor supply disincentives from UI benefits will persist until early September in most of the US, although 16 states have recently announced they will end the $300 federal payments in June.  A further complication in identifying the role played by any single factor is that constraints interact positively, and the generous UI benefits were partially put in place so that households would not be forced to confront hard decisions about whether to work while pandemic-related health risks and child-care concerns persisted.”

Bottom line: these supply constraints will keep labor markets tight and push up wage growth in the near term, before eventually fading around September “when most schools will have fully reopened, widespread vaccination will have dramatically reduced perceived health risk, and the $300 federal UI payments will have expired.”

For all those small and medium businesses who can’t afford to hike wages due to razor thing margins (thank you soaring inflation) yet who manage to fight off the massive conglomerates who will eagerly raise wages and offer signing bonuses to steal market share (paid for with a bond or two which will be lapped up by the market), congratulations. For everyone else, our condolences – we hope your stay in the USSA was pleasant.

Tyler Durden
Fri, 05/14/2021 – 13:58

via ZeroHedge News https://ift.tt/3fmyVDM Tyler Durden

DarkSide Hackers Reportedly Closing Down After Retaliation Routs Their Infrastructure

DarkSide Hackers Reportedly Closing Down After Retaliation Routs Their Infrastructure

The hacker group responsible for the ransomware attack on Colonial Pipeline that caused fuel shortages in the Southeast US appears to be shutting down after all its recent success, according to WSJ

The operator of the ransomware group Darkside, believed to originate in Eastern Europe or Russia, has been unable to access its computer systems to conduct cyber attacks. Associates close to the hacking group said it would disband, citing international pressure from the US, said security research firm FireEye. 

Recorded Future threat intelligence analyst Dmitry Smilyanets said DarkSide has lost control of its servers and lost some money it made through ransom payments. 

“A few hours ago, we lost access to the public part of our infrastructure, namely: Blog. Payment server. DOS servers,” Darksupp, the operator of the Darkside ransomware, said.

Now, these servers are unavailable via SSH, and the hosting panels are blocked.”

Darksupp also reported cryptocurrency funds were withdrawn from the payment server and would be split between itself and its associates.

This sudden dispersion of the hacking group is suspicious. Who would disband a hack operation for a measly $5 million – that will barely buy a mansion in the Bay Area. 

On Thursday, President Joe Biden announced his administration had been “in direct communication with Moscow about the imperative for responsible countries to take decisive action against these ransomware networks” and would “pursue a measure to disrupt their ability to operate.”

Biden said, “We do not believe the Russian government was involved in this attack, but we do have strong reason to believe that the criminals who did the attack are living in Russia, that’s where it came from.”

But not everyone is convinced DarkSide is a legitimate hacking group but rather a cover for a rogue group of CIA hackers. 

Natalya Kaspersky, the founder and former CEO of security software firm Kaspersky Lab, made an explosive suggestion in an interview with Russian state-owned domestic news agency RIA Novosti that CIA hackers were actually behind the Colonial Pipeline attack, reported RT News

Kaspersky said the Umbrage team, which is part of the Remote Development Branch under the CIA’s Center for Cyber Intelligence, can mask its hackers as outside ones and leave behind the “fingerprints” of the external hackers when it breaks into electronic devices. 

WikiLeaks in 2017 shed light on the Umbrage team. At the time, USA Today said CIA operatives “may have been cataloging hacking methods from outside hackers, including in Russia, that would have allowed the agency to mask their identity by employing the method during espionage.”

Kaspersky pointed out a list “of the countries under whose hacker groups this UMBRAGE is disguised – Russia, North Korea, China, Iran.” She claimed that “therefore, it cannot be said with certainty that a hacker group carried out the attack from Russia and that it was not a provocation made themselves from there, or from some other country.” 

… more things that make you go hmm. 

Tyler Durden
Fri, 05/14/2021 – 13:39

via ZeroHedge News https://ift.tt/2RXGOra Tyler Durden

Stage Is Set For “Dramatically Higher Inflation” As Transportation Costs Spike Even Higher

Stage Is Set For “Dramatically Higher Inflation” As Transportation Costs Spike Even Higher

By Greg Miller of Freight Waves,

The headlines last August and September blared: “Trans-Pacific rates are going crazy.” “Rates are on fire.” “Records shattered.” Oh, what cargo shippers would give to get the rates they paid eight or nine months ago. Those earlier records were repeatedly shattered. It just happened yet again.

“Non-stop demand of ocean freight and the resulting delays and equipment shortages pushed spot rates to new heights across all major trade lanes once again this week,” said Judah Levin, the research lead at Freightos.

And spot rates don’t tell the whole story. Shippers are paying thousands more in premiums on top of those rates just to get their cargo loaded.

Fixed annual contracts priced 50%-100% higher than last year’s will partially shield importers from the latest spot-rate rise. But with many shippers still heavily exposed to the spot market as the traditional peak season nears, the stage is set for the dramatically higher transport costs to be passed along to consumers, to the extent possible, in the form of inflation.

Trans-Pacific rates still rising

As of Wednesday, the Freightos Baltic Daily Index assessed Asia-West Coast spot rates (SONAR: FBXD.CNAW) at $5,650 per forty-foot equivalent unit (FEU). That’s up 15% from the beginning of this month and up 70% from rates back in August and September when pricing began to garner headlines. Rates are now 3.2 times higher than in mid-May 2020, up 228% year-on-year (y/y).

On the longer route from Asia to the East Coast via the Panama Canal, Freightos assessed Wednesday’s spot rate at $7,435 per FEU, up 171% y/y. The all-time high was hit Tuesday: $7,555 per FEU.

Add on extra charges and it looks like paying around $10,000 per FEU is the new normal for Asia-East Coast cargoes.

Different indices use different methodologies and come up with different rates, but the trend lines all go in the same direction: up.

Drewry’s weekly World Container Index, published Thursday, assessed Shanghai-Los Angeles rates at $5,255 per FEU, up 201% y/y, and Shanghai-New York rates at $7,085 per FEU, up 154% y/y.

Trans-Atlantic: Sleepy no more

The westbound trans-Atlantic route was one trade lane that had seemed to escape massive rate inflation. That ended in April, shortly after the Ever Given accident in the Suez Canal. It is no longer the sleepy trade it once was.

Last month’s surge was just the beginning. Rates have kept climbing. As of Wednesday, Freightos put the Europe-East Coast spot rate at a record-high $4,299 per FEU, up 132% y/y.

Drewry’s assessment is considerably lower than Freightos’, at $3,550 per FEU, up 37% y/y.

Asia-Europe: Most extreme increases

Many larger U.S. shippers have global operations and send significant volumes from Asia to Europe. However extreme the rate rises to the U.S., they pale in comparison to what’s going on in Europe. Rates there have climbed significantly from already very high levels since the Ever Given accident, which heavily impacted these cargo flows.

According to Frieghtos, Asia-North Europe rates on Wednesday were $8,331 per FEU, up 493% y/y or 5.9 times rates in mid-May 2020. Of all the mainline trades, rates in Asia-North Europe have risen the most.

Asia-Mediterrean rates were $9,387 per FEU, 4.8 times higher than this time last year, a  377% y/y increase.

Drewry estimates current Shanghai-Rotterdam spot rates at $8,976 per FEU, up 539% y/y, and Shanghai-Genoa rates at $8,943 per FEU, up 471% y/y.

In general, freight cost increases are not only more painful in Europe than in the U.S. because they’ve risen faster, but because Europe — unlike the U.S. — is in the midst of a recession.

Tyler Durden
Fri, 05/14/2021 – 13:20

via ZeroHedge News https://ift.tt/2RcMqhA Tyler Durden

Nasdaq Versus Commodities: This Ratio Suggest Critical Juncture Ahead  

Nasdaq Versus Commodities: This Ratio Suggest Critical Juncture Ahead  

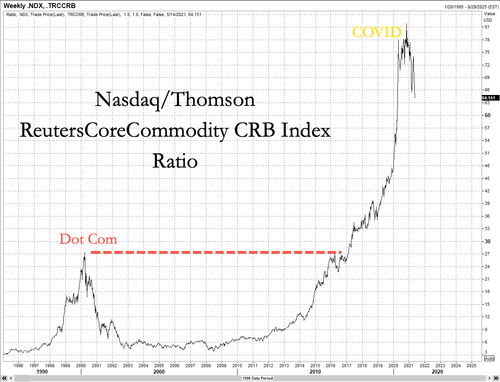
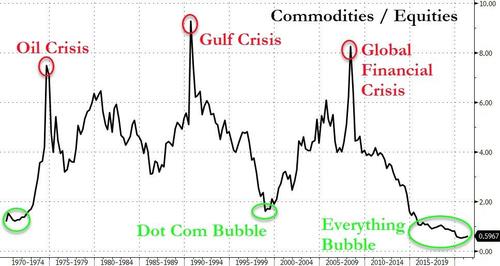
With tech stocks tumbling in recent weeks amid surging inflation fears, at least the commodity sector appears safe from the global reflationary risk-off wave that swept across markets. Besides the ups and downs daily, the tech-laden Nasdaq Composite has been on a tear for the last five years. But since commodities began to outperform earlier this year, Nasdaq year-to-date gains are flat. 

It appears tech outperformance has flipped while the Thomson Reuters/CoreCommodity CRB Index, boosted by solid gains in such commodities as crude oil, copper, corn, soybeans, has gained around 22%. The commodity index hit a six-year high and on track for one of the best years in more than a decade. 

The Nasdaq/CRB ratio began to reverse to the downside on Nov. 11 and continues to make new lows. This may suggest the ratio is at an inflection point. 

 A similar pattern played out in the Dot-Com period where tech outperformed against commodities, catapulting the Nasdaq/CRB ratio to new highs from 1997 to March 2000.

The ratio reversed and collapsed as investors pivoted to commodities. The same could be happening today as Goldman Sachs strategists declared the start of a new commodity supercycle

Many argue that the beginning of a monstrous inflationary commodities supercycle is here. Still, there are some dissidents to the commodity boom, such as ARK’s Cathie Wood, who disagrees with Goldman and calls for a “very serious” correction in commodities. 

… and why would Wood be wishing for a plunge in commodity prices? 

Well, of course, continued inflation and a rise in commodities (especially oil) would likely lead to massive investor outflow of equities Wood has stocked her flagship ARKK fund

Nasdaq/CRB ratio appears to have reached an extreme. If the commodity boom persists and inflation remains rampant, then the tech unwind may continue. 

Tyler Durden
Fri, 05/14/2021 – 13:05

via ZeroHedge News https://ift.tt/3fi2Ywt Tyler Durden

Proof-Of-Stake Coins Surge After Musk Trashes Power-Hungry Bitcoin

Proof-Of-Stake Coins Surge After Musk Trashes Power-Hungry Bitcoin

Authored by Scott Chipolina via Decrypt.co,

In brief

  • With Proof of Stake (POS), cryptocurrency miners can earn more crypto if they hold more coins.

  • Proof of Stake (POS) was created as an alternative to Proof of Work (POW), which is the consensus algorithm that Bitcoin uses.

  • Several coins that use alternative consensus algorithms to Bitcoin have increased in value.

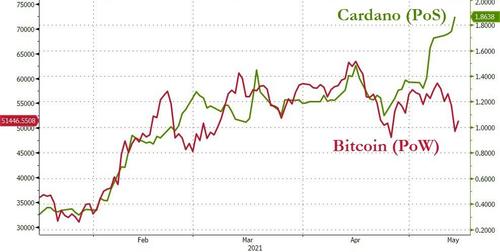
Several proof-of-stake cryptocurrencies have increased in price since Elon Musk backtracked on Bitcoin two days ago. 

In a tweet earlier this week, Musk announced that Tesla had suspended vehicle purchases made in Bitcoin. “We are concerned about rapidly increasing use of fossil fuels for Bitcoin mining and transactions, especially coal, which has the worst emissions of any fuel,” he said. 

Since that tweet, the Tesla CEO doubled down, saying that it is “high time for a carbon tax,” and that while he strongly believes in crypto, “it can’t drive a massive increase in fossil fuel use.” 

His U-turn on Bitcoin caused its price to drop from approximately $57,000 to as low as $48,000. But other cryptocurrencies, which use alternatives to Bitcoin’s energy-intensive proof-of-work algorithm, have benefited from Musk’s announcement. 

Proof-of-stake cryptocurrencies

Proof-of-stake (PoS) cryptocurrencies are fundamentally different from proof-of-work (PoW) cryptocurrencies. 

PoW systems use huge amounts of energy to secure the network. Miners use powerful computers in a race to solve complicated mathematical puzzles; the winner receives newly-minted crypto.

By contrast, in a PoS system, miners validate transactions based on the amount of coins they hold. The more coins a miner hold, the more likely they are to win the right to validate transactions.

Because PoS networks do not suck up the immense amount of energy consumed by PoW networks like the Bitcoin network, they are environmentally friendlier.

In the wake of Musk’s announcement, at least six cryptocurrencies have increased in price. 

Proof-of-stake price surges

The largest PoS cryptocurrency by market cap is Cardano (ADA), which has increased by over 13% during the last 24 hours to a price of $1.89. 

Another PoS cryptocurrency that has increased since Musk’s announcement is Polygon (MATIC), which has a market cap of $7.6 billion. In the last 24 hours, Polygon has increased by almost 16% to a price of $1.25. 

Anything but Bitcoin

Other cryptocurrencies that use alternatives to proof of work algorithms also surged. 

One such example is Stellar (XLM), which has a market cap of $16 billion and uses a small number of trusted nodes to validate transactions. In the last day, XLM has increased by 16% to a price of $0.7. 

Hedera Hashgraph (HBAR) has outpaced almost every other coin on this list, increasing by 35% in the last day to a price of $0.35. HBAR has a market cap of just under $3 billion. It uses its own hashgraph consensus algorithm.

While all of these Bitcoin alternatives have increased since Musk’s announcement, none have surged as much as Klaytn (KLAY), which has grown by just under 40% growth in the last 24 hours, reaching a price of $3.03. KLAY has a market cap of $7.4 billion. Its blockchain uses a proof of contribution consensus mechanism, which uses a small number of trusted validators. 

Despite all of these coins being in the green, Musk appears to be fully focused on Dogecoin, a proof-of-work cryptocurrency.

Tyler Durden
Fri, 05/14/2021 – 12:45

via ZeroHedge News https://ift.tt/2Ra1Va1 Tyler Durden

Putin Calls Gaza Crisis “Direct Threat” To Russia’s Security Interests; Merkel Condemns Anti-Israel Protests

Putin Calls Gaza Crisis “Direct Threat” To Russia’s Security Interests; Merkel Condemns Anti-Israel Protests

At a moment the United States is blocking a UN Security Council meeting and statement on Gaza, delaying it further to next week given Israel shows no signs that it’s ready for ceasefire talks following an earlier overture from Hamas, multiple world leaders have issued their own statements demanding “urgent de-escalation” and have called for ceasefire, particularly French President Emmanuel Macron, British Prime Minister Boris Johnson, and Russian President Vladimir Putin.

Putin’s latest statement Friday, being initially reported by Sky News Arabic, appeared especially forceful, calling the crisis a “direct threat” to Russian interests in the region.

He said the “current sharp escalation in Israeli-Palestinian conflict poses a direct threat to Russia’s security interests,” according to a translation. This after yesterday Putin along with UN Secretary-General Antonio Guterres appealed for an end to the fighting.

At least 130 Palestinians have been killed, including more than 30 children, and close to 1,000 wounded since Monday, while six Israeli civilians, including two children, have died from the Hamas attacks.

Here’s more on Putin’s words from regional media

Russian President Vladimir Putin warned on Friday that the current escalation between Israel and Palestine poses a direct threat to Russia’s security.

Holding a meeting with the Russian Security Council, Putin suggested discussing the situation in Jerusalem and Gaza Strip prior to the agreed agenda.

“I would like to ask my colleagues to comment on the current situation in the Middle East, I mean the escalated Palestinian-Israeli conflict – this is happening in the immediate vicinity of our borders and directly affects our security interests,” he said.

Meanwhile German Chancellor Angela Merkel on Friday issued a statement which appeared a show of strong support from Israel’s operations in Gaza, which as of Thursday night has included ground troops in operations at the border and over one hundred warplanes as well as tank fire.

“Chancellor decidedly condemns the ongoing rocket attacks on Israel, these are terrorist attacks … Nothing justifies these acts of terrorism. The rocket attacks have to be ceased immediately, the German government supports Israel’s right to self-defense,” a spokesperson for the Chancellor said.

And controversially the ongoing anti-Israel protests which have popped up in German cities this week were addressed, and were linked in the statement anti-Semitism:

“Here in Germany, people are taking to the streets to protest against Israel’s policies. They can do it peacefully, this is natural in our democracy. However, those who use these protests to espouse antisemitism are abusing the right of assembly. Our democracy will not stand for antisemitic rallies,” Seibert added.

Apparently some among the protest groups in places like Bonn, Munster and Gelsenkirchen actually sought to vandalize or outright attack synagogues, according to European reports.

Tyler Durden
Fri, 05/14/2021 – 12:25

via ZeroHedge News https://ift.tt/2QmKJh4 Tyler Durden