As Good As It Gets: Goldman Is Last Big Bank To Turn Bearish, Sees Market Dropping In Coming Months
On Friday, something remarkable happened: after 12 months of relentless, raving optimism (and one day after JPM’s chief quant preacher Marko Kolanovic appeared on CNBC and urged everyone to BTFD) the most bullish bank on Wall Street, JPMorgan (whose year-end S&P price target of 4,400 is the highest on Wall Street) finally eased back on its “balls to the wall” euphoria and while it did not turn bearish per se, JPM’s chief equity strategist Dubravko Lakos-Bujas joined his other notably bearish sellside peers at Deutsche Bank and Morgan Stanley, and said that “easy equity gains for the broad market are likely behind us” and as a result JPMorgan’s “bullish conviction is now lower.”
As the second phase of global reopening gets confirmed by a pickup in mobility and pent-up demand, we expect yields to retrace higher thereby constraining the equity multiple with S&P 500 entering a period of consolidation. On March 8th, we argued the risk-reward for the Growth trade had tactically improved after the February Momentum crash and Growth derisking. Since then Growth has strongly outperformed, but mainly defensive/bond-proxy Growth, making this segment again vulnerable to rates.
Well, just a few hours later, the bank with the second highest S&P target – Goldman – also capitulated, with the bank’s chief strategist David Kostin writing that recent discussions he has had with clients “have focused on peaking US GDP growth and the capital gains tax hikes proposed by President Biden.”
It gets worse: as Kostin warns, “Investors buying S&P 500 as growth peaked have typically realized negative short-term returns and weak 12-month returns, consistent with the 3% upside to our year-end target of 4300.”
In short, this is as good as it gets – for the economy – and it’s all sideways from here (at best) until the end of the year. And just in case that was not enough, Kostin then warns that “S&P 500 returns have also been weak ahead of past capital gains tax hikes.” The good news “selling was short lived and reversed afterward” although this time the selling may not be so short-lived as Goldman estimates $1+ trillion in unrealized capital gains for the wealthiest US households.”
Here are some more details from the latest Kostin note:
During the past two months, the incoming questions from portfolio managers changed weekly and spanned the macro horizon: interest rates, inflation, corporate tax rates, profit margins, falling volatility, low return dispersion, and money flow. Never a dull moment and at 4180, the S&P 500 index trades nearly at its all-time high, up 10% since the start of the year.
More importantly, it is just 4% from Goldman’s year-end target of 4,300. Anyway, back to Kostin and his client conversations:
This week, attention shifted again. First, we received many inquiries about sector and style rotations and peaking economic growth. Second, questions abounded about the impact the potential capital gains tax rate hike could have on stock prices. Our answers: Domestic growth is peaking and forward equity returns are likely to be modest with a 3% gain in the S&P 500 to our year-end 2021 target of 4300. And historical experience suggests equity selling later this year ahead of a possible capital gains tax hike will be short-lived and reversed in subsequent quarters.
So yeah, bearish. Meanwhile…
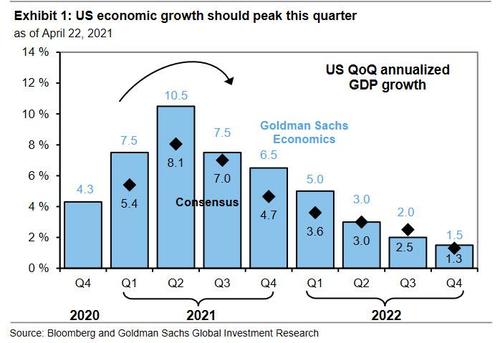
US economic growth is peaking. Goldman Sachs economists expect US GDP growth will peak in 2Q 2021 at an annualized rate of 10.5%. Although GDP growth will remain both above trend and above consensus forecasts through the next few quarters, the pace of growth will peak within the next few weeks as the tailwinds from fiscal stimulus and economic reopening begin to fade.
Furthermore, as Kostin shows in the next chart, equities often struggle when a strong rate of economic growth first begins to slow. Picking up on what Michael Wilson said last week, the Goldman strategist writes that during the last 40 years, “investors buying the S&P 500 when the ISM Manufacturing index registered above 60 –typically coinciding with peak growth –have experienced a median return of -1% during the subsequent month and a paltry +3% return during the subsequent year.”
Why does this matter? Because the most recent ISM reading was 64.7 – i.e., the highest in almost 40 years, and while Goldman’s S&P 500 year-end target reflects a 4% total return from the current level, including dividends, Kostin explicitly reminded readers that the bank’s mid-year 2021 target remains 4100. Translation: stocks are set to drop from here over the coming 2-3 months… precisely what Deutsche Bank warned about two weeks ago.
To be sure, Goldman can’t spook its clients and go bearish cold turkey, so instead it said that it expects “equity prices will continue to rise as growth slows during the second half of this year. Equities generally appreciate when the rate of economic growth slows as long as growth remains positive, albeit at a slower pace. Although US growth is peaking, the growth rate should remain strong. In addition, the global economy is still accelerating and will not peak until 3Q 2021.”
This, of course, is drivel: when even Goldman says the selling is coming, the only question is when does the frontrunning of said selling begin since clients will certainly not be waiting until the last possible moment to dump exposure. And speaking of that, even Goldman admits that rising cap gains taxes are hardly bullish:
The Taxman Cometh, Part II. During the past month, investors have been focused on the Biden administration’s proposed corporate tax reform and the impact on specific stocks. This week, attention shifted to the forthcoming proposal to raise the capital gains tax rate. Long-term capital gains and qualified dividends are currently taxed at a maximum rate of 20%, along with a separate 3.8% tax on investment income. Press reports reveal that Biden will propose taxing both of these as ordinary income for filers with more than $1 million in annual income. This would roughly double the tax rate on capital gains and dividend income from 23.8% to 43.4%. Our economists expect a more modest increase, potentially around 28%.
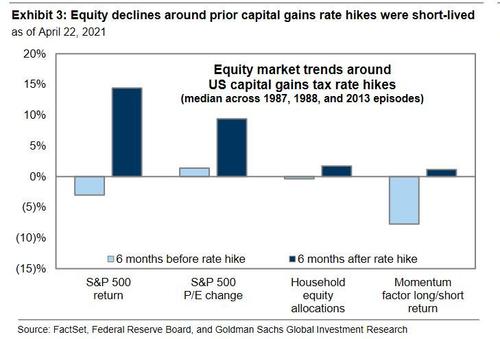
Past capital gains tax hikes have been associated with declines in equity prices and in household equity allocations. Also, high-momentum “winners” that had delivered the largest gains to investors ahead of the rate hike have usually lagged. Tech and Consumer Discretionary sectors have been the largest sources of capital gains within the US equity market during the last 3, 5, and 10 years.
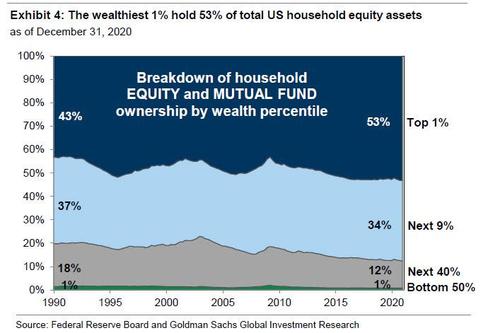
Unsurprisingly, the wealthiest 1% were the biggest net sellers of equities across US households around the last capital gains rate hike in 2013. During the three months prior to the hike, the wealthiest households sold 1% of their starting equity assets, which would equate to around $120 billion of selling in current terms.
And here, some ominous stats: using Federal Reserve data, Goldman estimates the wealthiest households now hold $1 to $1.5 trillion in unrealized equity capital gains. This equates to 3% of total US equity market cap and roughly 30% of average monthly S&P 500 trading volume.
However, as noted above, Kostin writes that the trend of net equity selling and falling stock prices around capital gains rate changes has usually been short-lived and reversed during subsequent quarters, to wit:
In 2013, although the wealthiest households sold 1% of their assets prior to the rate hike, they bought 4% of starting equity assets in the quarter after the change and therefore only temporarily reduced their equity exposures in order to realize gains at the lower rate. Total household equity allocations demonstrated a similar pattern around the two preceding capital gains tax hikes.
Eventually, once the tax-selling is over, Goldman expects an eventual increase in household equity allocations funded, in part, by a continued rotation away from cash since “US households represent the single largest owner of the US equity market, at 35%, and currently have cash allocations close to the 30-year average despite cash yields being substantially below average.” Households accounted for 40% of the $1 trillion of total inflows into US money market funds during 1H 2020 ($410 billion) and around 70% of the $180 billion of outflows since then ($120 billion).
Finally, Goldman estimates that additional household selling of money market funds could exceed $200 billion and that a meaningful amount of that cash will represent equity demand. The bank also forecast net equity buying by households to total $350 billion in 2021 and be driven by the wealthiest 1%. The top 1% – which accounts for 53% of household equity ownership – has bought $2 trillion of shares during the past 30 years vs. $800 billion of net selling by the bottom 99%.
Assuming Goldman is right, this is great news for the top 1%… it’s just further testament however that the record class, wealth and income divide between the haves (the 1%) and the have nots (everyone else) is about to get even greater.
Tyler Durden
Mon, 04/26/2021 – 10:23
via ZeroHedge News https://ift.tt/3eAPmw3 Tyler Durden
