“Inflation Surge” Is 2021’s Big Risk – Are You Ready For 4% CPI By Mid-Year?
“Quick and surging inflation could well prove the biggest surprise of 2021,” Fund manager Ken Jesudian, co-founder and chief executive officer of Toronto-based Crimson Asset Management, said in a letter to clients.
“In an environment as such, investors want to own equities of companies with pricing power, low capital expenditures and low debt levels.”
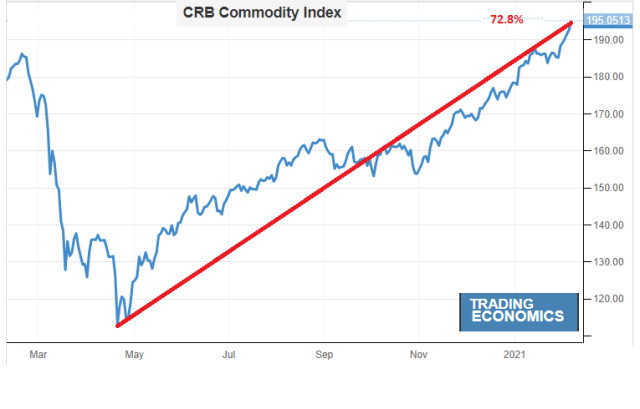
And, as Global Macro Monitor details below, Jesudian is not alone as we are starting to hear lots of talk about inflation these days, something we have been seeing in the pipeline for the past six months.
Input price inflation accelerated to a near-decade high in January. Costs increased to the greatest extent since April 2011, reflecting stronger rises in both the manufacturing and service sectors. This was partly passed on to clients in the form of higher charges, the main factor underlying the steepest rise in output prices for 27 months. – JPMo Global PMI, January
The surge in US inflation expectations continues unabated, highest since March 2013… pic.twitter.com/CIRBp4iur2
We’ve crunched a boatload of numbers over the past few days. Sit back and enjoy.
What Deflation?
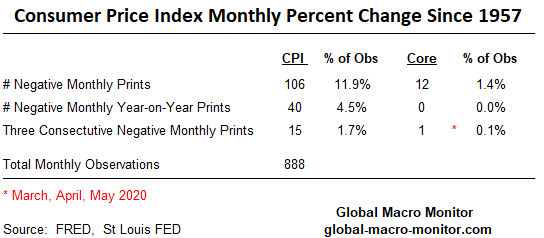
Since 1957, 888 monthly observations of the Consumer Price Index, there have only been 106 monthly negative prints and only 12 negative monthly prints on Core CPI (excluding food and energy). Monthly year-on-year inflation has only printed 40 times on the main CPI and Core CPI has never printed a negative year-on-year number.
You read that right, never.
Three Consecutive Negative Monthly Prints Are Rare
Three consecutive negative monthly CPI prints are rare, only 15 times for main CPI and just once for Core, which happened just recently after the COVID shock.
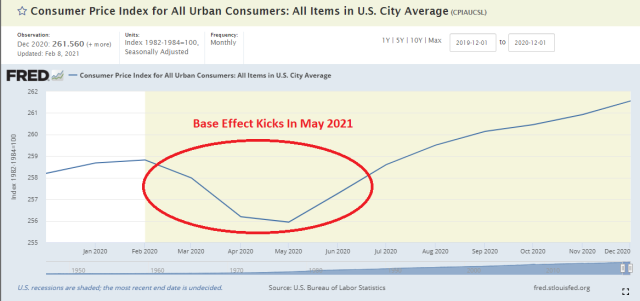
The Coming Base Effect
The following FRED chart of the Consumer Price Index illustrates how it bottomed last May after the COVID shock, which is going to set up for some very high year-on-year CPI inflation prints by mid-year. In part, because of the lower base but also the surprisingly quick snapback in the price index after the government temporarily shut off the lights and the Fed turned on the printing press.
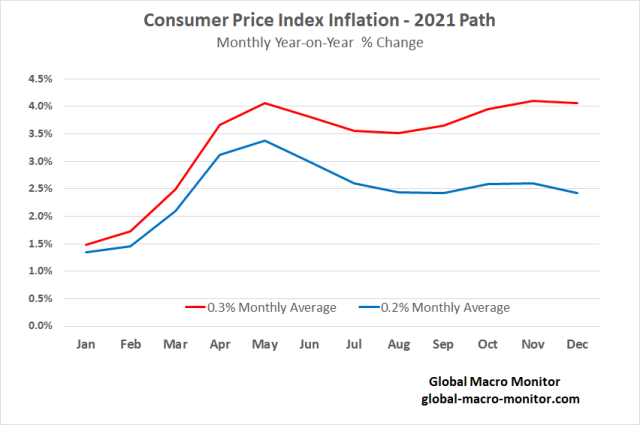
We have constructed in the following chart a couple paths for CPI inflation in 2021, one based on an average 0.3 percent monthly rate, which takes the year-on-year inflation rate to 4.1 percent by May, which is sustained and translates to a core CPI of 3.5 percent. Given what we currently see in the PMIs, including major problems in the global supply chain, and the excess stimulus already in the system, a 0.3 percent monthly CPI may be too stingy.
A Different Kind Of Economic Shock
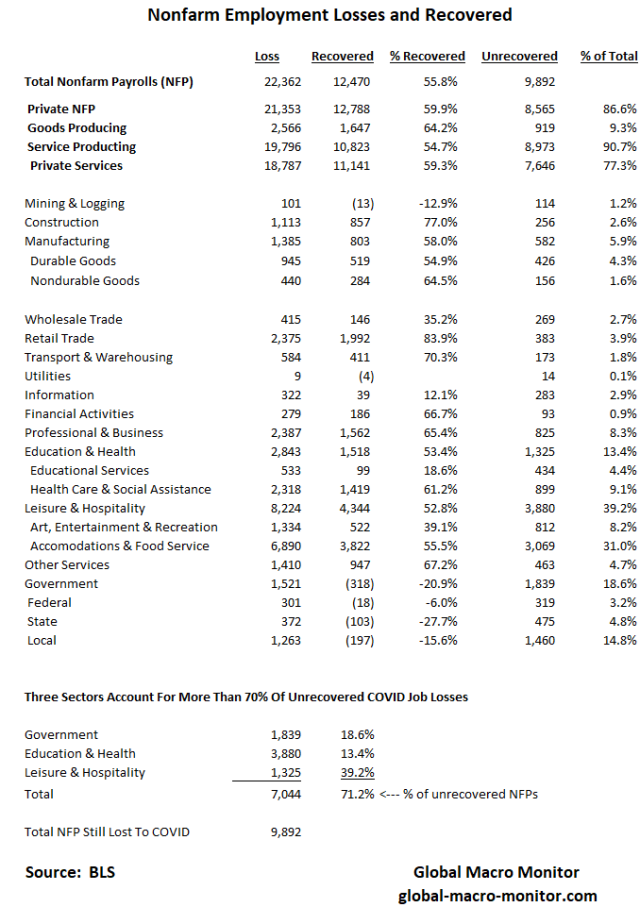
We also think very few understand the current economic situation and that this crisis is unlike those in the recent past. The labor force and employment problems are not so much the result of too little demand but a forced reduction in supply due to the COVID restrictions. More than 70 percent of the 10 million jobs that have been lost and have not been recovered are in three sectors: 1) leisure and hospitality; 2) education and health services, and 3) government.
Once COVID begins to fade – it has already started – and the economy opens fully, pent-up demand, especially for leisure and hospitality will be huge, and with capacity already reduced in this area, hiring will rebound sharply and so will prices.
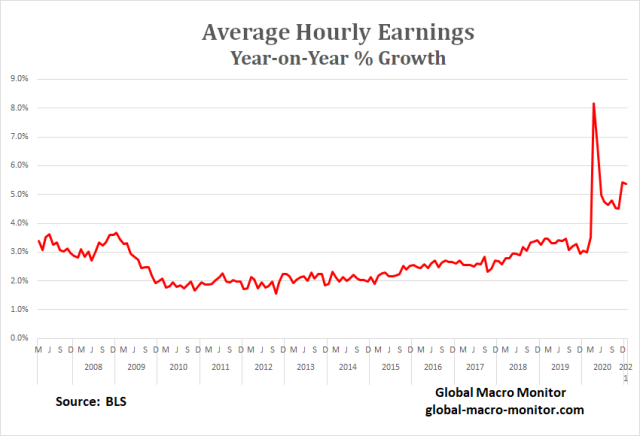
Why Are Average Hourly Earnings (AHE) Spiking?
While crunching the numbers, we also found an interesting anomaly with AHE, which is now running at multi-year highs. We have warned many times on this site about going deeper with the macro data and the problems of averaging.
Though we have not engaged in much second-order thinking or analysis on this issue — you don’t pay us enough to do so — we are pretty certain the spike in earnings is the result that most of the job losses have been in the lower-paying service sector, such as leisure and hospitality. If, for example, all the sub .250 hitters on the Yankees are given their walking papers, the team batting average naturally goes up. The same goes for the macro.
We are also kind of amazed that those soaking up the sun at the genius bar on bubble vision are not using the “spike in AHE” as a rationale to justify the market’s irrational and outrageous valuations. Maybe they will or already have?
Market Impact
Personally, I have given up on the market, which has become almost farcical, well, not even almost. One would think that if inflation is rising the Fed’s hands will be tied and there is a risk they may panic, or the bond market will panic first, which could send risk markets into a tailspin. But that’s too rational.
We also know that we mortal humans tend to think linearly but markets, the economy, and society move forward on a nonlinear trajectory. In other words, it impossible to predict the future, especially when it comes to timing.
Nevertheless, we still hold to the instruments and signals that have guided us in the past and continue to heed the words of one of our heroes,
In economics, things take longer to happen than you think they will, and then they happen faster than you thought they could.
Finally, I am thankful to my partner at GMM, Carol K., who has taught me “you have got to ride the gravy train as long as it lasts.” I guess you can tell who is making the money at the Global Macro Monitor. Keep fighting, CK.
Appendix
O.M.G!
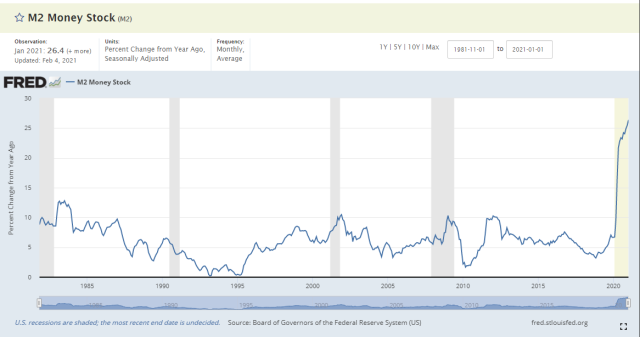
Carpet bombing the economy with stimulus and liquidity is a huge mistake and will end in a river of tears, in my opinion. Surgical strikes to help the sectors most in need, please.
Inflation is always and everywhere a monetary phenomenon. – Milton Friedman
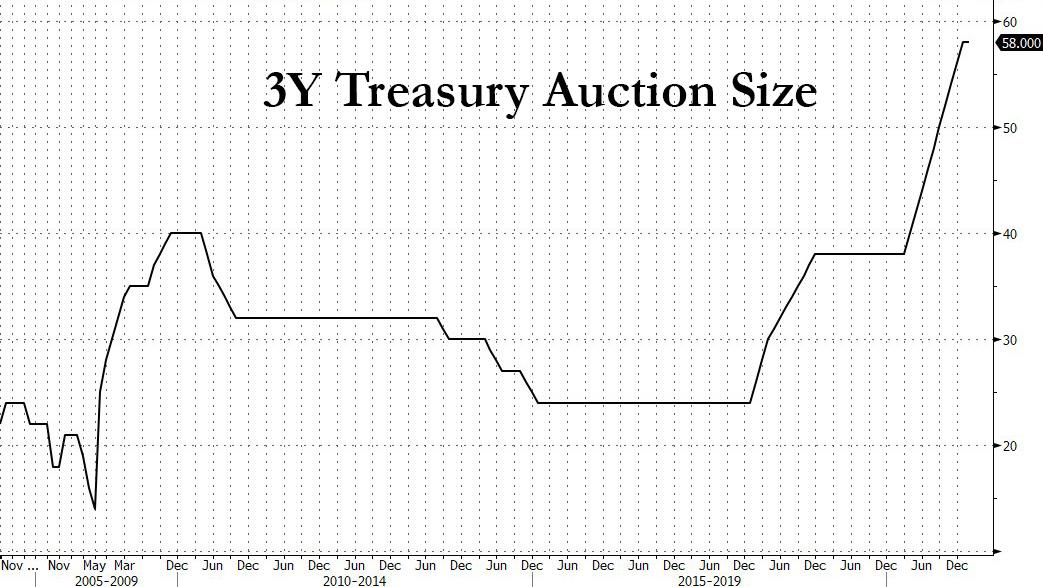
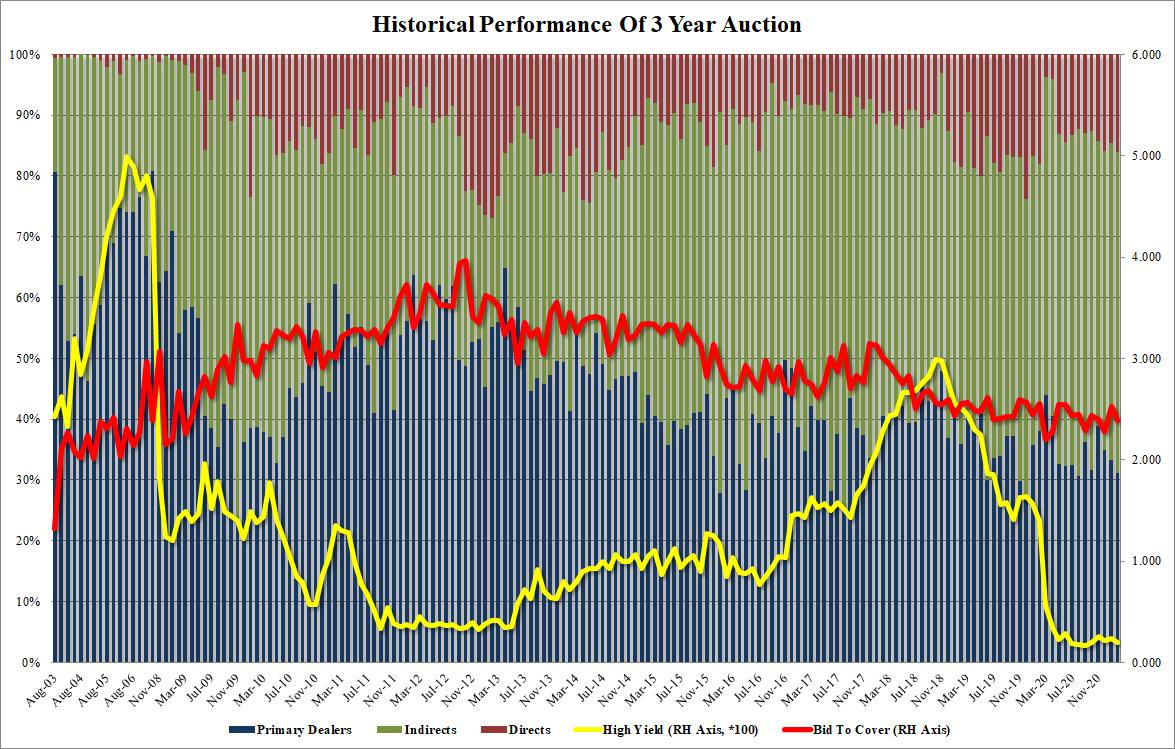
With refunding week upon us (which now will be monthly instead of the usual quarterly affair as the exploding US deficit needs constant net debt issuance), moments ago the Treasury sold its first coupon auction for the week when it found buyers for $58BN in 3Y notes – a size which matched last month’s record…
… at a high yield of 0.196%, down from last month’s 0.234% and pricing “on the screws” with the 0.196% When Issued.
The bid-to-cover of 2.391 was a drop from the 2.520 last month, and just below the six-auction average of 2.393.
The internals were unremarkable, with Indirects taking down 52.7, up fractionally from 52.2 in January and in line with the 52.0 recent average. Directs rose to 16.0% – the highest since February 2020 – and obviously well above the recent average of 13.8% leaving Dealers holding on to 31.2%, which was below both January’s 33.2% and the recent average of 34.3%.
Overall, a boring auction which priced pretty much in line with expectations, as the absolute lack of reaction in the secondary market confirmed.
Germany Hired Koch Institute And Other Scientists To Justify Unconstitutional Lockdowns: Die Welt
One of Germany’s largest newspapers, Die Welt, has obtained evidence that the Interior Ministry hired scientists from the Robert Koch institute and several universities to justify the country’s strict lockdown measures.
The documents – more than 200 pages which were recovered after a legal battle with the Koch Institute, reveal internal correspondence between the Ministry of the Interior and the researchers.
In one exchange, State Secretary Markus Kerber asks the researchers to develop a model on which to base “preventative and repressive measures.”
In just four days, scientists working in close coordination with the ministry developed a working paper in secret, which described a “worst-case scenario” in which over one million people in German could die of COVID-19 if social life were to continue as it was before the pandemic.
Based on the dire projections, the German state responded with sweeping legislative changes to longstanding laws to enact strict measures – including unprecedented lockdowns that began in March. This triggered a flurry of lawsuits challenging the constitutionality of the measures, ranging from lost income to isolation of the elderly, to mandating that people remain in their homes and avoid public places in violation of “fundamental rights of personal freedom.”
Meanwhile, German courts have been ruling against the restrictions.
In one case, a court granted interim relief after plaintiffs say the city of Gießen illegally prohibited a protest, despite detailed social distancing precautions outlined by organizers. The court held that the city’s ban violated the freedom of assembly, and that legal changes instituted in March do not apply to open-air assemblies.
In a second case regarding a COVID-19 protest in Stuttgart, the city was found in violation of the law when it told the organizer that it could not process requests to hold mass gatherings due to pandemic restrictions. Eventually a Constitutional Court held that the city similarly violated freedom of assembly.
And in a third case, Muslims petitioning to hold prayers at a mosque during Ramadan amid Lower Saxony’s strict ban on religious gatherings was overturned by the high administrative court (Oberverwaltungsgericht), which – while refusing to open all mosques – noted that infection risk depended on several details, and that a blanket ban was inappropriate.
In January, a German court in Weimar declared the prohibition on social contact unlawful and contrary to German Basic Law (Gründgesetz), finding the lockdown laws “unconstitutional because the Infection Protection Act was not a sufficient legal basis for such a far-reaching regulation as a contact ban,” according to the UK Human Rights Blog.
In this case a citizen of Weimar had been prosecuted and was to be fined €200 for celebrating his birthday together with seven other people in the courtyard of a house at the end of April 2020, thus violating the contact requirements in force at the time. This only allowed members of two households to be together. The judge’s conclusion was that the Corona Ordinance was unconstitutional and materially objectionable.
This is the first time a judge has dealt in detail with the medical facts, the economic consequences and the effects of the specific policy brought about by the Coronavirus pandemic…
In short, German officials paid the Koch Institute and others to produce dire pandemic models, which they then used to enact unconstitutional laws which are now being overturned by the courts.
As discussed in Bull Mania, the signs of market exuberance did not diminish during the recent correction. With the market well ahead of fundamentals, as money continues to chase performance, the “risk” remains elevated.
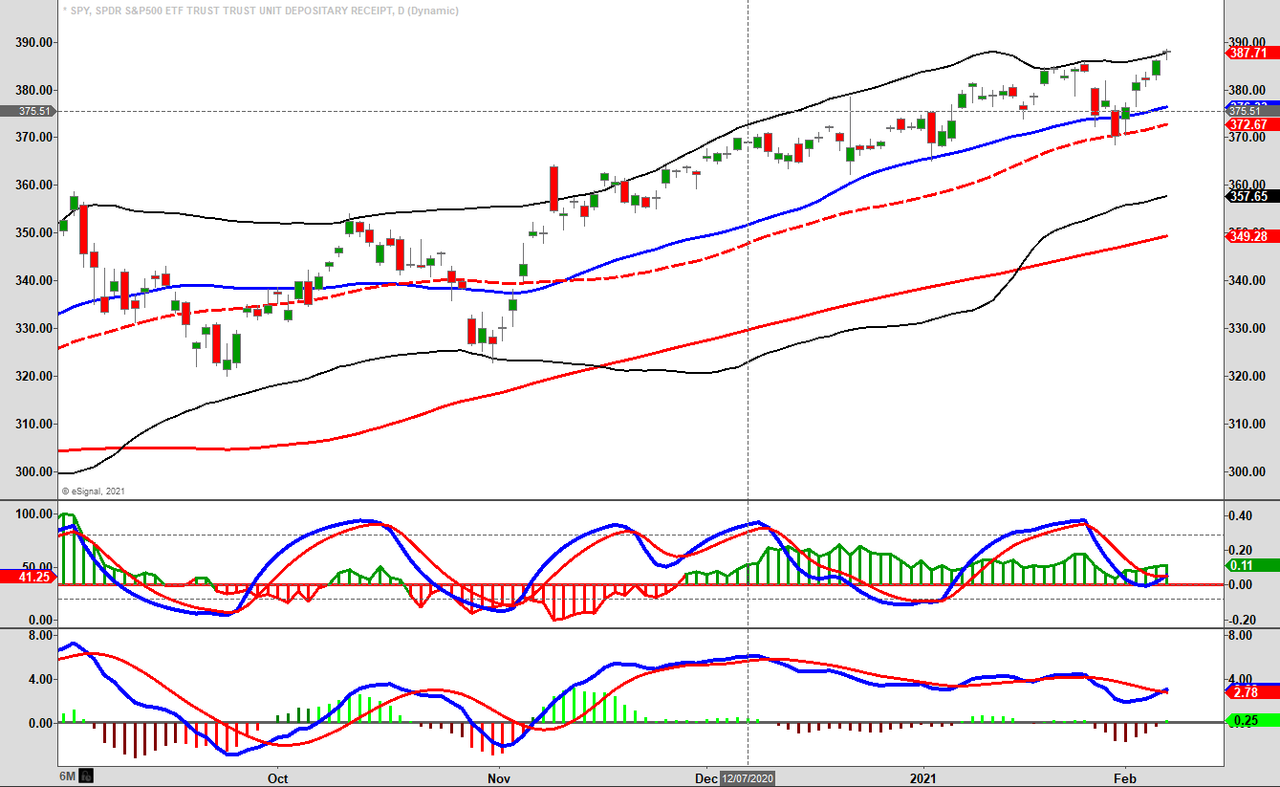
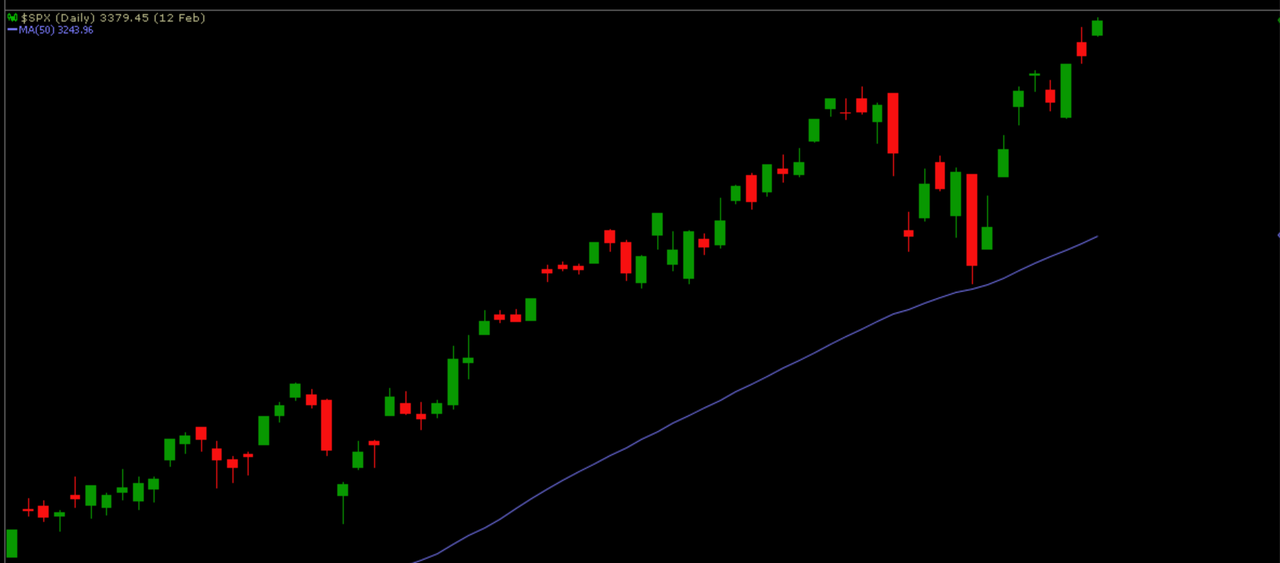
“[The expected rally] was indeed the case as the markets successfully tested and held the 50-dma (red dashed line.) Despite the fact money flows remained weak, as shown in the chart below, the market did manage to regain previous highs.”
“While the money flow ‘buy signal’ will likely trigger next week, the market is already trading 2-standard deviations above the 40-dma. Such suggests that the upside may be more limited over the next couple of weeks.”
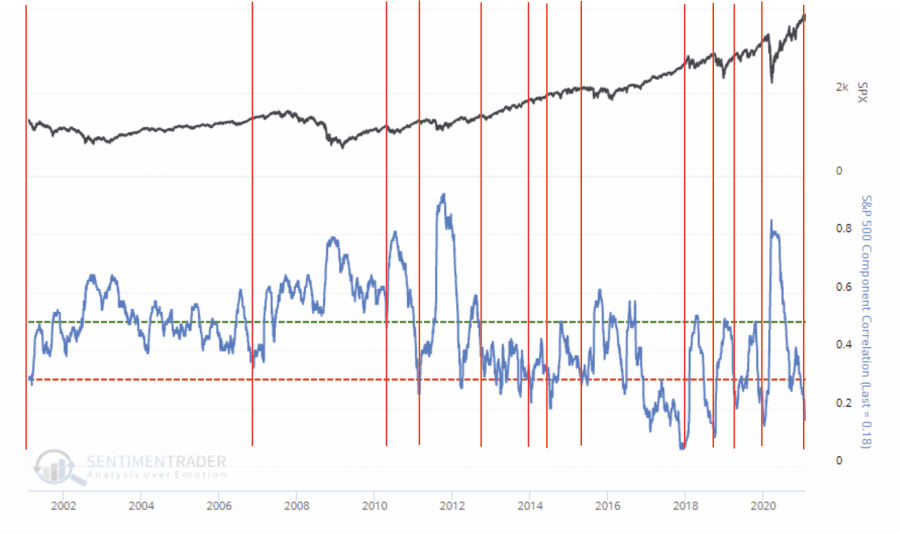
The more critical point in the newsletter concerning the market was the breakdown in correlations between the market and its underlying constituents. To wit:
“Currently, the number of stocks outperforming the market is dropping sharply. Such is notable because the correlation among stocks in the S&P 500 plunged to the lowest level in over a year.’ – Sentimentrader
“What is also notable is that these periods of low correlations typically align themselves with previous market tops. Topping process can take some. Generally, it is long enough for investors to dismiss the warning as ‘wrong this time.’ The subsequent correction can range from mild to more extreme.”
What we know is that markets move based on sentiment and positioning. Such makes sense considering that prices are affected by buyer’s and sellers’ actions at any given time. Most importantly, when prices, or positioning, become too “one-sided,” a reversion always occurs.
“When all experts agree, something else is bound to happen.”
So, how are traders positioning themselves currently?
Positioning Review
The COT (Commitment Of Traders) data, which is exceptionally important, is the sole source of the actual holdings of the three critical commodity-trading groups, namely:
Commercial Traders: this group consists of traders that use futures contracts for hedging purposes. Their positions exceed the reporting levels of the CFTC. These traders are usually involved with the production and processing of the underlying commodity.
Non-Commercial Traders: this group consists of traders that don’t use futures contracts for hedging and whose positions exceed the CFTC reporting levels. They are typically large traders such as clearinghouses, futures commission merchants, foreign brokers, etc.
Small Traders: the positions of these traders do not exceed the CFTC reporting levels, and as the name implies, these are usually small traders.
The data we are interested in is the second group of Non-Commercial Traders (NCTs.)
NCT’s are the group that speculates on where they believe the market will head. While you would expect these individuals to be “smarter” than retail investors, we find they are just as subject to “human fallacy” and “herd mentality” as everyone else.
Therefore, as shown in the charts below, we can look at their current net positioning (long contracts minus short contracts) to gauge excessive bullishness or bearishness.
Volatility
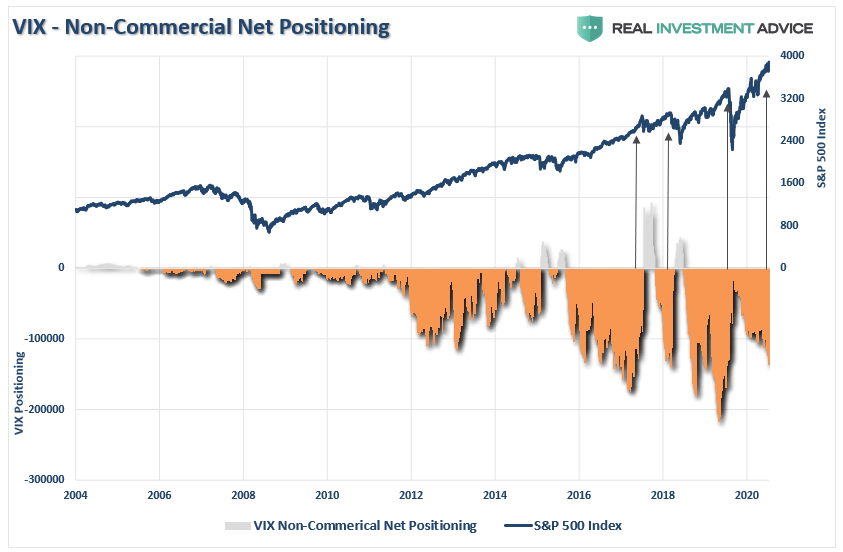
Since 2012, the favorite trade of bullish speculators has been to “short the VIX.” Shorting the volatility index (VIX) remains an extraordinarily bullish and profitable trade due to the inherent leverage in options. Leverage is one of those things that works great until it doesn’t.
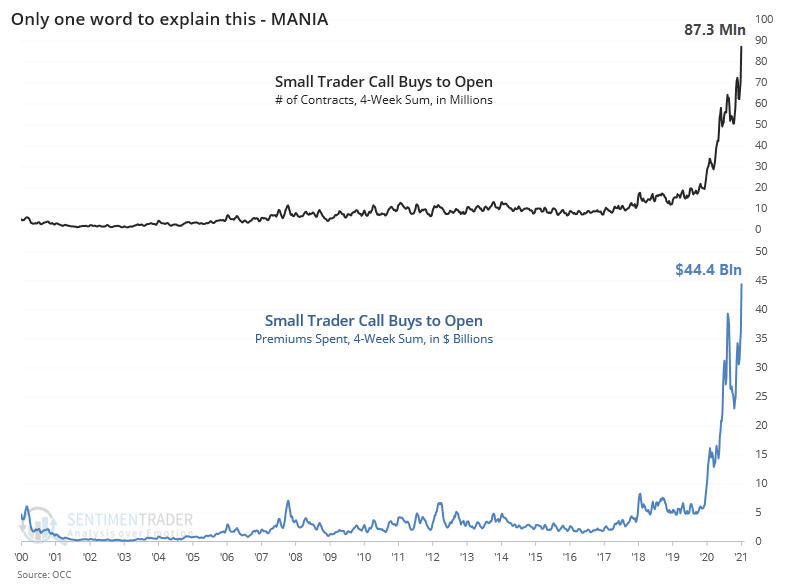
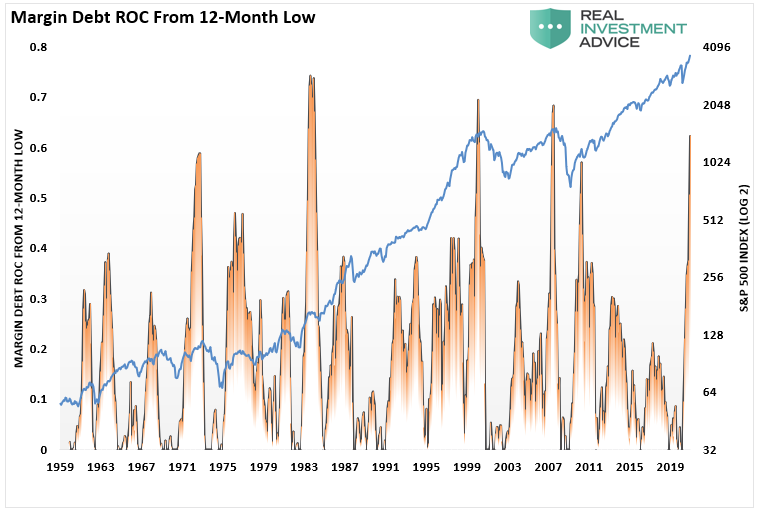
One of the more astonishing data points is that retail investors have increased risk markedly since the March lows. As noted last week, investors have not only taken on record levels of risk via speculative call buying but have also simultaneously increased margin debt to record levels.
Currently, net shorts on the VIX are rising sharply and are back to more extreme levels. While not as severe as seen in 2017 or 2019, the positioning is large enough to fuel a more significant correction.
The only question is the catalyst.
Crude Oil Extreme
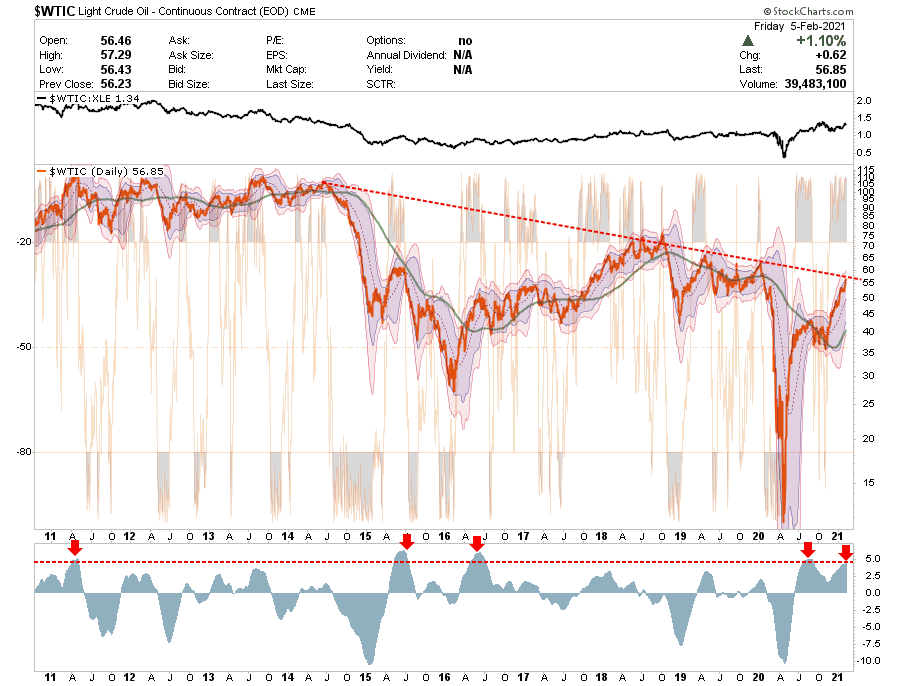
Crude oil has gotten a lot more interesting as of late. After a brutal 2020, with the price of oil futures going negative at one point, oil rebounded above $50/bbl. Given current expectations for a surge in “inflation” from the massive infusions of liquidity, the focus on highly speculative positions is not surprising.
Despite the massive surge in oil prices since March, “energy” stocks, as noted by the correlation of crude to XLE, have underperformed. Such is because the leverage in options increases speculative returns. It is worth noting that “expectations” of economic recovery are likely well ahead of reality. As such, the extreme overbought, extended, and deviated positioning in crude will likely lead to a rather sharp correction.
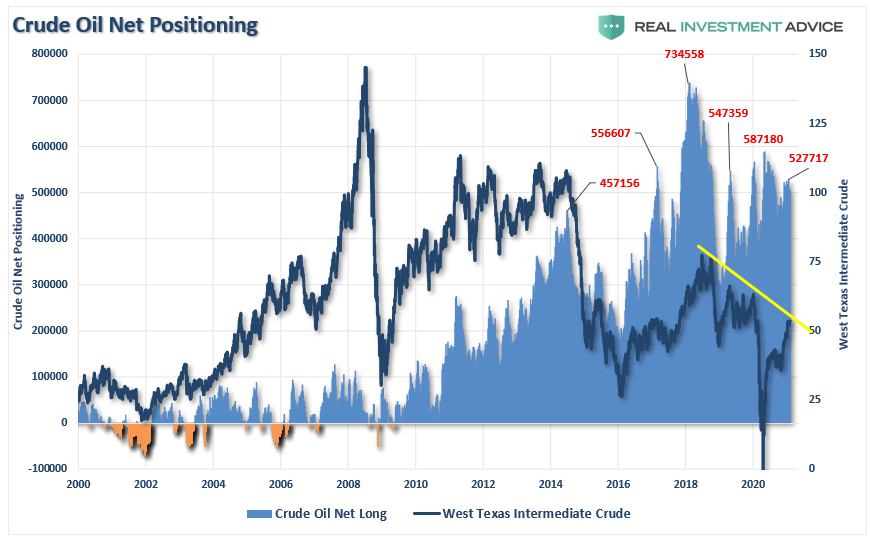
The speculative long-positioning is driving the dichotomy in crude oil by NCTs. While levels fell from previous 2018 highs during a series of oil price crashes, they remain more extreme at 527,717 net-long contracts. While not the highest level on record, it is definitely on the “extremely bullish” side.
Also, note in both charts, the declining trend in oil prices remains intact and continues to provide significant resistance.
As noted in the “Energy Rally Is Likely Premature,” The supply of oil, and lack of global demand, remains a longer-term problem for oil prices. Furthermore, rising interest rates, combined with a dollar rally, will likely derail the economic “reflation” story.
U.S. Dollar Extreme
There are two major risks to the entire “bull market” thesis: interest rates and the dollar. For the bulls, the underlying rationalization for high valuations has been low inflation and rates. However, given an economy that is pushing $85 trillion in debt, higher rates and inflation will have immediate and adverse effects:
The Federal Reserve gets forced to begin talking about hiking rates, tapering QE, and reducing accommodation; and,
The consumer will begin to contract consumption as higher costs pass through from producers.
Given that personal consumption expenditures comprise roughly 70% of economic growth, higher inflation and rates will quickly curtail the “reflation” story.
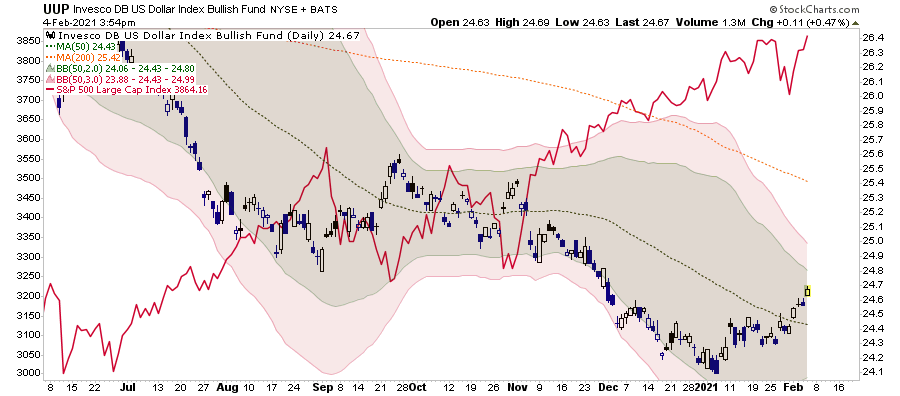
With the market currently priced for perfection, a disappointment of economic growth caused by a rising dollar or rates or a contraction in consumer spending will lead to a repricing of risk. As noted this past weekend, the dollar is the risk we are watching.
The one thing that always trips of the market is the one thing that no one is paying attention to. For me, that risk lies with the US Dollar. As noted previously, everyone expects the dollar to continue to decline, and the falling dollar has been the tailwind for the emerging market, commodity, and equity ‘risk-on’ trade. Whatever causes the dollar to reverse will likely bring the equity market down with it.”
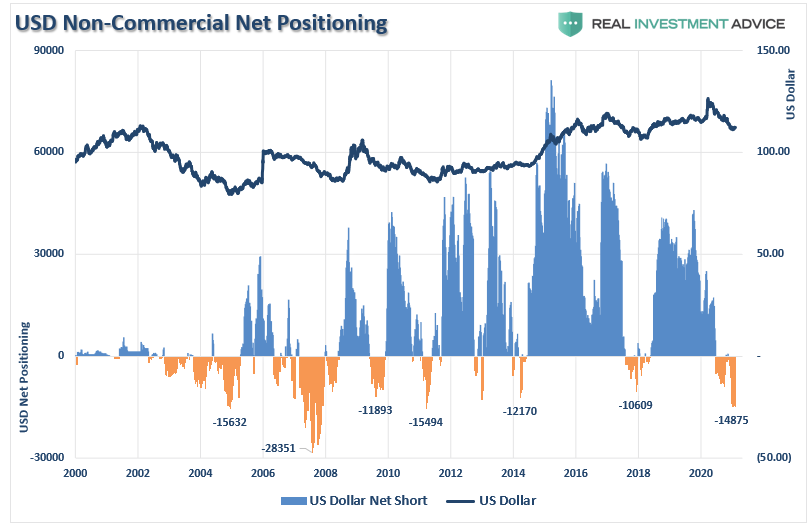
Very quietly, the dollar has been rising and recently broke above its 50-dma. With a substantial net short position outstanding, a further rise could trigger shorts to begin covering, pushing the dollar up further.
As noted, such would not be welcome for the equity markets due to the non-correlation between the dollar and equities. Most importantly, a surging dollar, with rising interest rates, could put a severe dent in the “reflation trade.”
Interest Rate Conundrum
Over the latest several years, I have repeatedly addressed why financial market “experts” have been confounded by why interest rates fail to rise. In March 2019, I wrote:“The Bond Bull Market,” which followed up our earlier calls for a sharp drop in rates as the economy slowed.
At that time, the call was a function of the extreme “net-short positioning” in bonds, which suggested a counter-trend rally was likely.
In March 2020, unsurprisingly, rates fell to the lowest levels in history as economic growth collapsed. Notably, while the Federal Reserve turned back on the “liquidity pumps,” juicing markets to all-time highs, bonds continued to attract money for “safety” over “risk.”
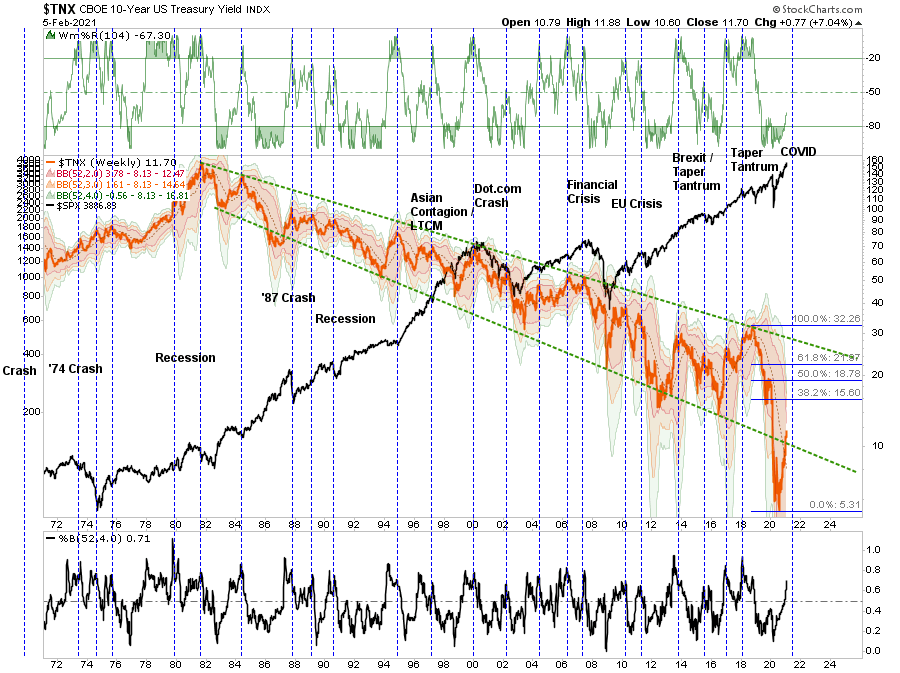
Recently, “bond bears” resurfaced, suggesting rates are going higher due to explosive economic growth. As noted above, such is unlikely given that higher inflation, a rising dollar, and rates all harm a debt-laden economy.
Can rates rise in the near-term due to “checks to households” that get spent to pull-forward consumption? Absolutely.
However, the limit of that increase in rates is between 1.56% and 2.19%. At these points, rates will collide with the outstanding debt.
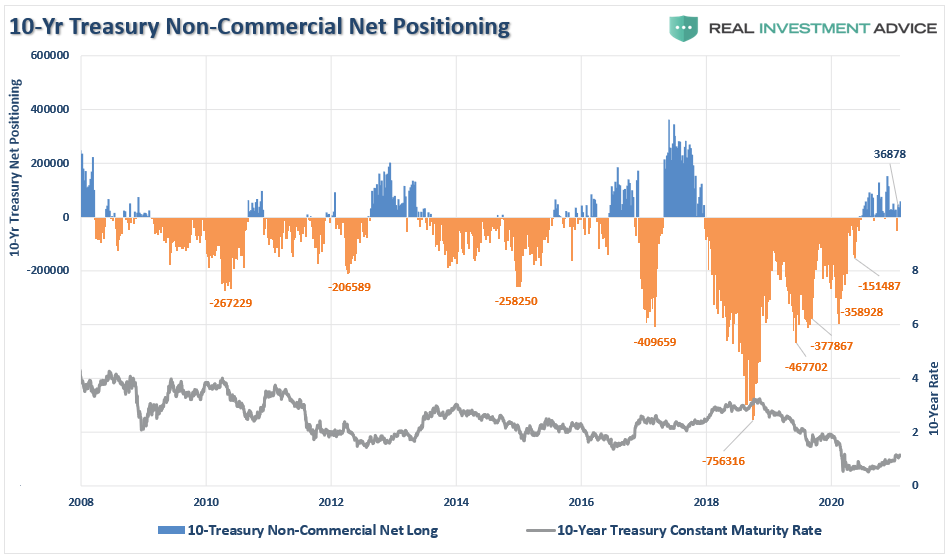
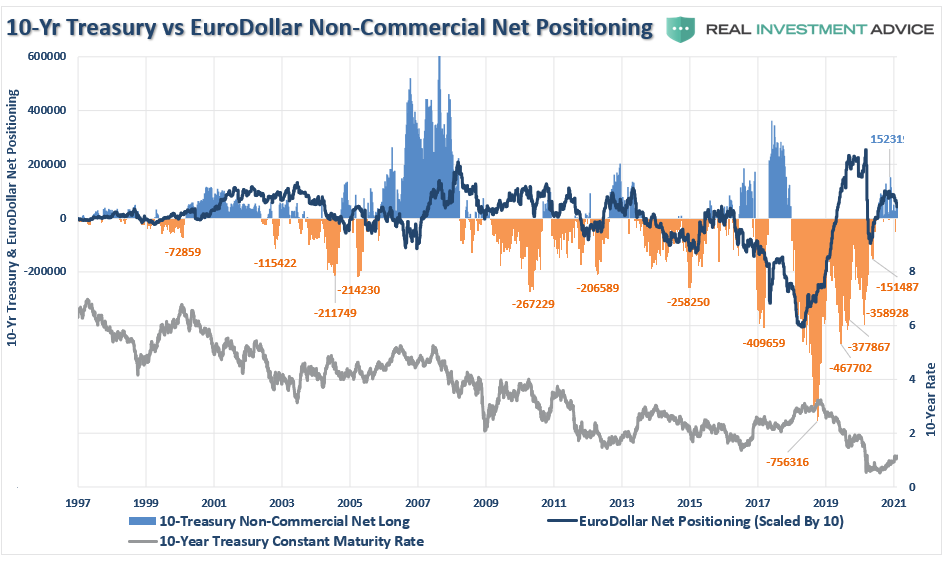
The number of contracts “net-long” the 10-year Treasury already suggests the recent uptick in rates, while barely noticeable, maybe near its peak.
Importantly, even while the previous “net-short” positioning in bonds has reversed, rates failed to rise correspondingly. The reason for this is due to increasing levels of Eurodollar positioning as foreign banks push reserves into U.S. Treasuries for “safety” and “yield.”
With the number of bonds with “negative yields” rising globally, the U.S. Treasury bond’s positive yield and liquidity will likely keep it a preference for storage of reserves for now. Such will increase further if economic growth fails to appear as expected.
Conclusion
In today’s market, the majority of investors are simply chasing performance.
Ultimately, investing is about managing the risks that will substantially reduce your ability to “stay in the game long enough” to “win.”
“Philip Carret, who wrote The Art of Speculation (1930), believed “motive” was the test for determining the difference between investment and speculation. Carret connected the investor to the economics of the business and the speculator to price. ‘Speculation,’ wrote Carret, ‘may be defined as the purchase or sale of securities or commodities in expectation of profiting by fluctuations in their prices.’”
Chasing markets is the purest form of speculation. It is just a bet on prices going higher than determining if the price paid for those assets is a discount to fair value.
Historically, such sentiment excesses from around short-term market peaks, not investable bottoms.
Investors miss that while a warning doesn’t immediately translate into a negative consequence, such doesn’t mean you should ignore it.
“There remains an ongoing bullish bias that continues to support the market near-term. Bull markets built on ‘momentum’ are very hard to kill. Warning signs can last longer than logic would predict. The risk comes when investors begin to ‘discount’ the warnings and assume they are wrong.
It is usually just about then the inevitable correction occurs. Such is the inherent risk of ignoring risk.’”
The cost of not paying attention to risk can be extraordinarily high.
Iran Issues Rare Declaration To Pursue Nukes “If Backed Into A Corner”
In an extremely rare and possible first, a top Iranian intelligence official has signaled that the Islamic Republic could pursue the production of nuclear weapons “if backed into a corner”.
It marks a change in tune from Iranian leaders who both in recent years and past decades have consistently repeated Iran’s official line which has long seen nuclear weapons as “un-Islamic”. Ayatollah Ali Khamenei has within the past two years explicitly declared nukes as “illegal under Islamic law” in line with his predecessor clerics. Tehran has all along maintained its nuclear development pursuits are exclusively for domestic energy consumption.
In comments first reported in Iranian state TV on Tuesday, Intelligence Minister Mahmoud Alavi emphasized, “Our Nuclear Industry is strictly peaceful. Iran’s supreme leader said in a fatwah that producing nuclear weapons is against Islamic norms, is haram.”
But then the powerful intelligence chief pivoted to a “threat” at a moment of continued standoff with the Biden administration over the restoration of the JCPOA nuclear deal:
“I will only say this: if a cat is backed into a corner, it might behave the way it wouldn’t while free. If Iran is pushed in that direction, it will not be Iran’s fault. Under the regular circumstances, Iran has no such plans,” he said.
Alavi affirmed further: “If they push Iran in this direction, it won’t be the fault of Iran, but the fault of those who have pushed Iran.”
Significant
“Iran’s leader issued a Fatwa that forbids acquiring nuclear weapons. However, if a cat is pushed to the corner, it’s going to react differently to a free cat. If Iran decided to take this path nobody should blame Iran.” — Irans intelligence minister Mahmoud Alavi — pic.twitter.com/6qQiFKKIkb
Despite Biden’s repeat promises on the campaign trail to ‘immediately’ restore US participation in the 2015 nuclear deal brokered under Obama, which Trump pulled out of in May 2018, there’s currently not even so much as negotiations for reentry underway.
The rival sides are essentially saying “you first” in terms of returning to its terms, with the White House demanding that Tehran lower uranium enrichment levels back under stipulated caps and other terms of the deal.
On Monday Iran’s Foreign Ministry released a statement repeating Iran’s longstanding position that, “The US was the party to leave the negotiation table and the JCPOA. We wait for the other side to fully fulfill its commitments; then, we will follow the path of returning to our obligations.”
Meanwhile the latest report from Reuters suggests the Biden administration is pursuing a strategy of taking “small steps” toward US re-entry in the JCPOA, which would simultaneously require Iran to take significant but piecemeal action in return.
Republicans controlled not just the White House but also both chambers of Congress, and even in that moment of unified government at the beginning of the Trump presidency, their power was not complete.
Then-House Speaker Paul Ryan was strategizing with party lawmakers behind closed doors about how to accomplish the single most defining GOP promise of the 2016 campaign: repealing the Affordable Care Act.
The person to watch in the Senate, Ryan said, was “Elizabeth.”
Do you mean, one congressman asked, the junior senator from Massachusetts, Elizabeth Warren?
“No,” Ryan replied.
“Elizabeth, the Senate parliamentarian.”
As the Wall Street Journal reported at the time, Ryan was talking about Elizabeth MacDonough.
The Washington Post would go on to introduce her as the staffer who “could change the course of the health-care debate,” while The Hill later called her“the most powerful person in Washington few have heard of.”
Politico summed up the story by calling the parliamentarian “Obamacare’s little secret.”
The sudden interest in the obscure official was because the parliamentarian determines which laws can be repealed (or passed) using budget reconciliation, the procedure by which the Senate can avoid a filibuster and allow legislation to pass by a simple majority.
This makes the parliamentarian the powerful procedural traffic cop on Capitol Hill, as all of the headlines asserted. MacDonough stopped Republicans cold when they tried using reconciliation to repeal some provisions of Obamacare, and she might soon rule that a provision in the COVID relief bill to raise the minimum wage to $15 is out of order.
This fact has triggered a fresh case of déjà vu and prompted a telling exchange in the White House briefing room on Monday. The parliamentarian is an unelected bureaucrat while Vice President Kamala Harris is the president of the Senate. A CNN reporter asked: Would the White House like to see Harris overrule the official to deliver on a key campaign promise?
“I think our view is that the parliamentarian is who is chosen typically to make a decision in a nonpartisan manner in terms of what can be included in a package that goes through reconciliation, the proper process for this to journey through,” press secretary Jen Psaki responded.
That short answer could signal a massive bucket of cold water on progressives’ hopes.
“Let’s be clear. We can pass a $15 min wage & $2000 checks,” tweeted Rep. Ro Khanna, a close ally of incoming Senate Budget Committee Chairman Bernie Sanders. The California Democrat added that “the decision is not with Senate Parliamentarian but VP Harris, as chair. If the House passes (where we have a majority), & VP Harris rules it in, NO WAY any Senate Dem votes no on final passage.”
If progressives wind up feeling disappointed instead, conservatives can commiserate. Four years ago, it was Sen. Ted Cruz who argued that Mike Pence should disregard the parliamentarian and, as vice president, take a broader view of reconciliation.
“You don’t have to override the parliamentarian or get a new parliamentarian,” Cruz told reporters.
“Under the statute, it is the vice president who rules. It is the presiding officer who makes the decision. The parliamentarian advises on that question.”
Cruz and others lobbied the White House to break with precedent, and a former senior administration official told RealClearPolitics that Pence and then-Majority Leader Mitch McConnell were briefed on the question of disregarding the parliamentarian. “Both were strongly opposed,” the official recalled.
As is true of Biden, McConnell has a strong affinity for Senate traditions and the chamber’s sometimes-arcane rules and procedures. And while the vice president remains president of the Senate, the role has largely become honorific — except for certain occasions, as former Senate parliamentarian Robert Dove explained in 2010.
“No vice president has ever tried to play a role in reconciliation. Basically, since Walter Mondale was vice president, they have kind of been co-opted by the president and given an office down in the West Wing. Their interest in playing Senate politics has become attenuated,” Dove said during a Georgetown Law School symposium.
“That has left the Senate parliamentarian in an extremely powerful position.”
The new president seems to have resigned himself to the fact that, even with control of both houses of Congress, an unelected official will decide whether or not his minimum wage increase can be passed. “My guess is it will not” be included, he told Norah O’Donnell of CBS News on Friday. “… I don’t think it is going to survive.”
Jeff Ubben Seeks To Raise $8BN As He Considers “Meaningful” Exxon Stake
Activist investor Jeff Ubben is looking to raise as much as $8 billion for a hedge fund at his firm Inclusive Capital Partners. Ubben is looking to raise the capital for his Spring Fund II, a successor to his $1.5 billion Spring Fund that he started while at ValueAct, which he founded in 2000, according to Bloomberg.
The goal of the fund is reportedly going to be looking at “impact investing”, which aims to “make systemic changes at companies and sectors to the betterment of society,” the report notes. This, of course, would fit nicely if Ubben was looking to make a major operational, ideological (and PR) shift at an undervalued legacy oil and gas company like Exxon.
Last week we reported that Ubben was considering a “meaningful stake” in Exxon and could, as a result, even wind up with a seat on the board. The news sparked a rally in XOM shares which remain far below year-ago levels.
Ubben was having “ongoing” and “constructive” talks with the Exxon board, according to the report. Other shareholders, including D.E. Shaw which have agitated in the recent past for Exxon – which over the weekend was reported to have considered a merger with Chevron – to do something to push its stock price higher, are supportive of Ubben’s inclusion to the board (for obvious reasons). A decision on Ubben’s inclusion to the board could be made “in coming weeks”, the report said.
Ubben left ValueAct last year to start his own firm that is focused on investments in social and environmental issues. Ubben may be eyeing Exxon not only due to the company’s ripe yield, but also as an opportunity to help guide Exxon out of the fossil fuel era, and to transition it for inclusion into the ESG frenzy.
Other activists have been busy in the name, too. “D.E. Shaw has written the company urging it to cut costs in order to preserve its dividend and called on the company to take steps to improve its environmental reputation” and Engine No. 1 investments has nominated 4 directors to the company’s board.
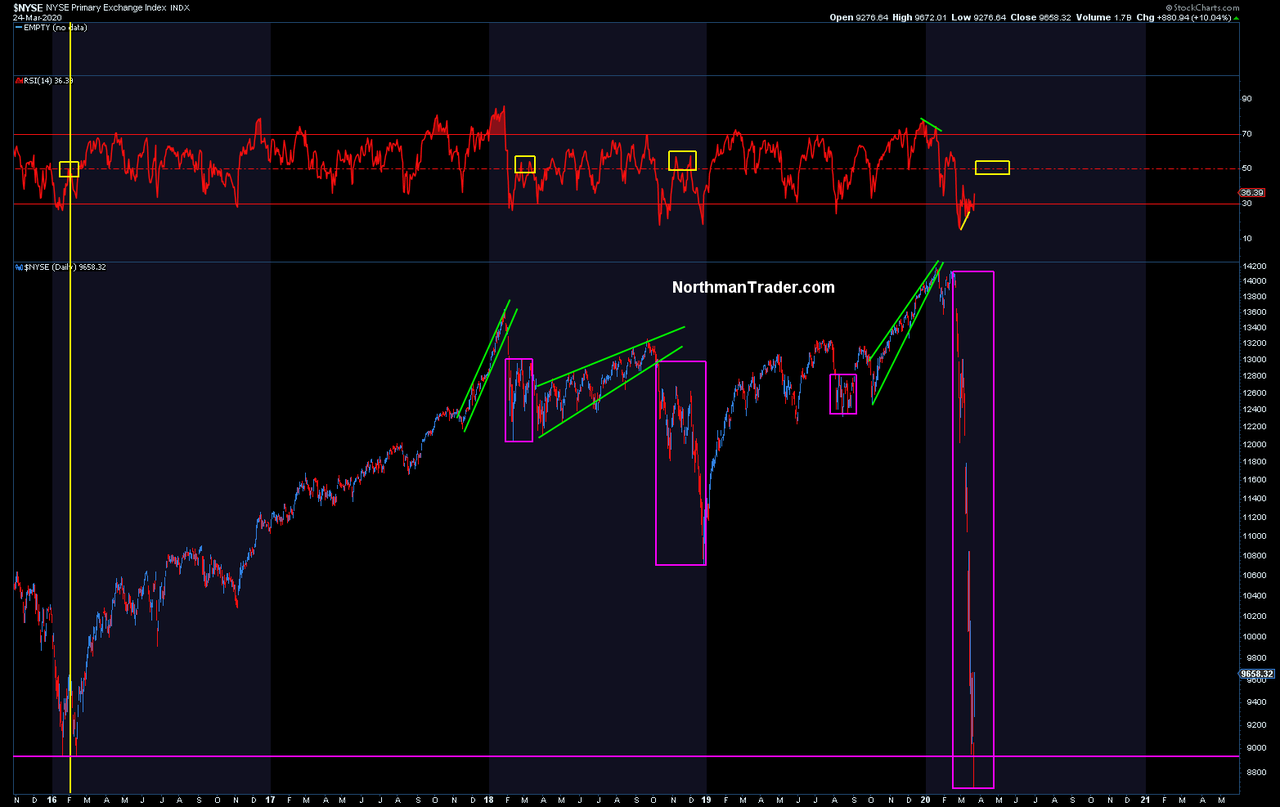
The more things change the more they stay the same. So we had the bounce off of the 50MA and the other signal points we highlighted. The resulting rally brought markets right back to new highs, precisely the year 2000 script we had discussed.
Hence so far no surprises really. A steep rally since November, new all time highs in January, then a swift corrective move into the end of January and then a rally to new highs:
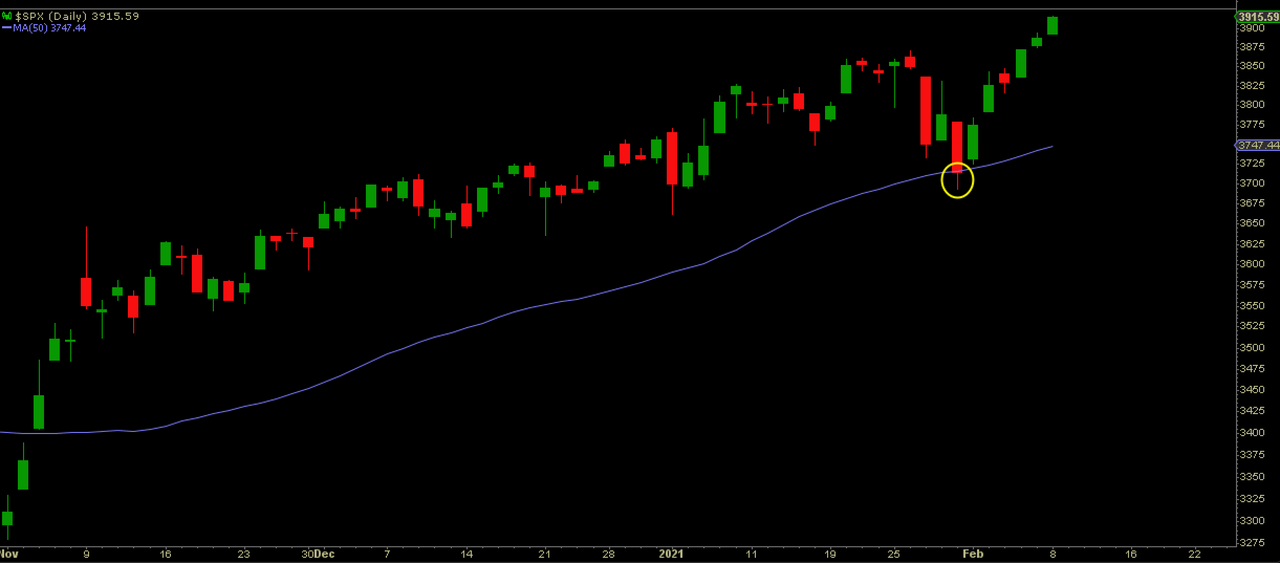
Oh, I’m sorry, that’s the chart from 2019/2020, here’s the current version:
No, this market is really not behaving that much differently from the one that led to the February 2020 top. Back then of course the Fed too was printing running their Repo program having cut rates three times already, now of course printing still $120B a month with rates at zero following the balance blow out to $7.4 trillion.
Numbers aside the structure of the broader market is behaving very similarly to last year, hence it is noteworthy that some of the signals are also virtually the same, in fact suggesting a signal fire of warnings is under way.
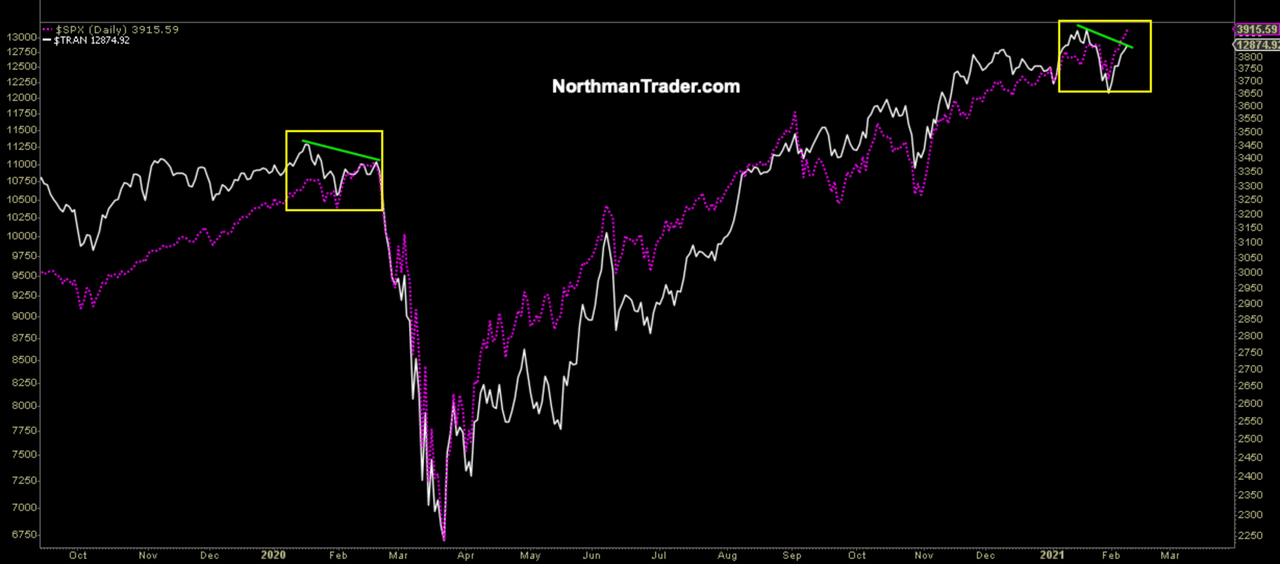
For one note the new highs on a negative divergence as in 2020:
Now that could just be temporary and if markets rally further the divergence could disappear. Yet note transports suddenly lagging, not making new highs while $SPX is, also very much like 2020:
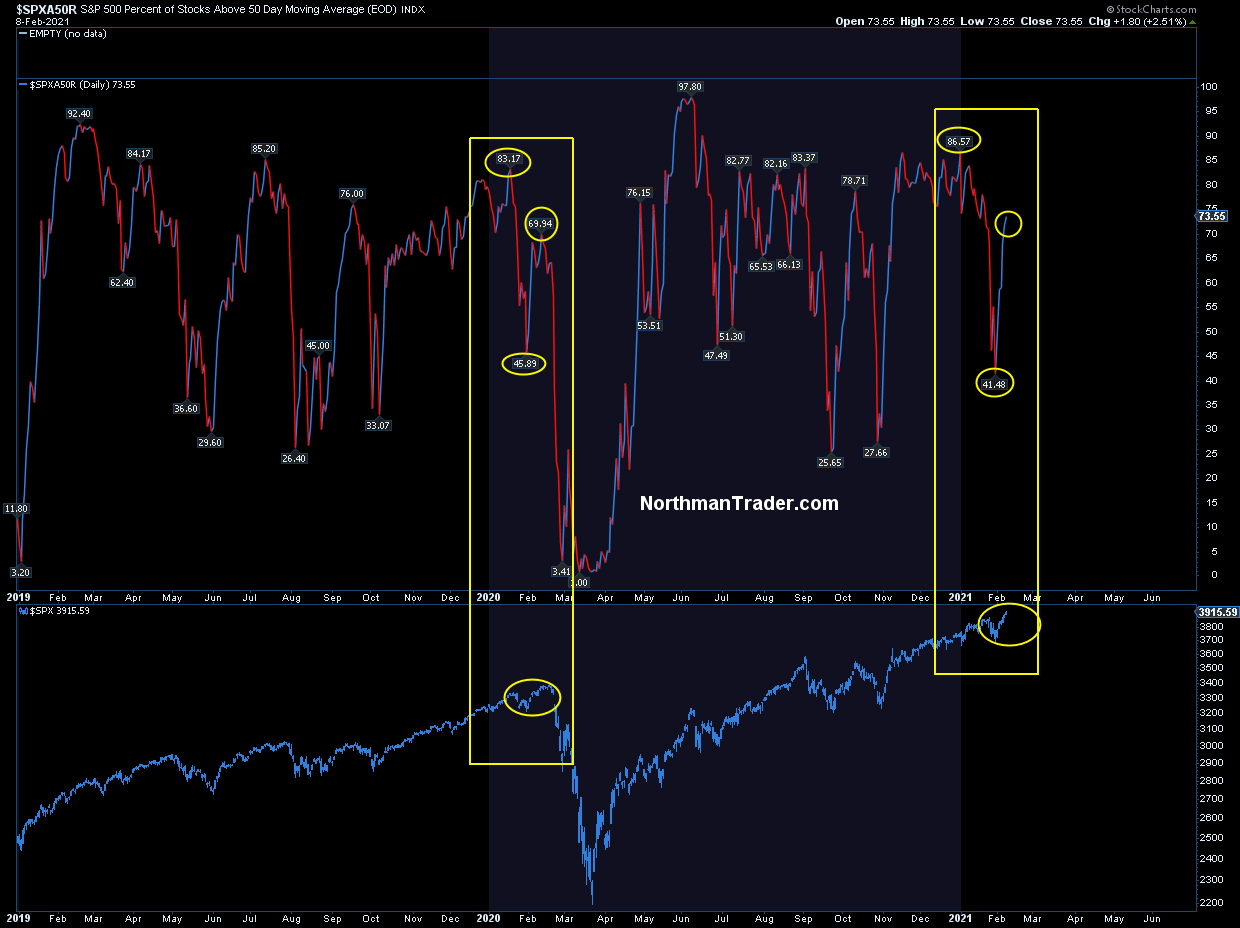
Also notable, on the new highs here we see a similar program running with the $SPX components above their 50MA:
Nearly the same readings compared to January/February 2020 with lower readings versus new index highs. Weird. Same time frame, same behavior, same program.
In February 2020 these highs ultimately gave way to the now long forgotten 35% crash. Crashes are extremely rare, but corrections still do happen, the severity of course dependent on a number of factors, the relevance of which usually only become apparent after the fact.
Yet despite all the similarities there are also important differences to note compared to 2020.
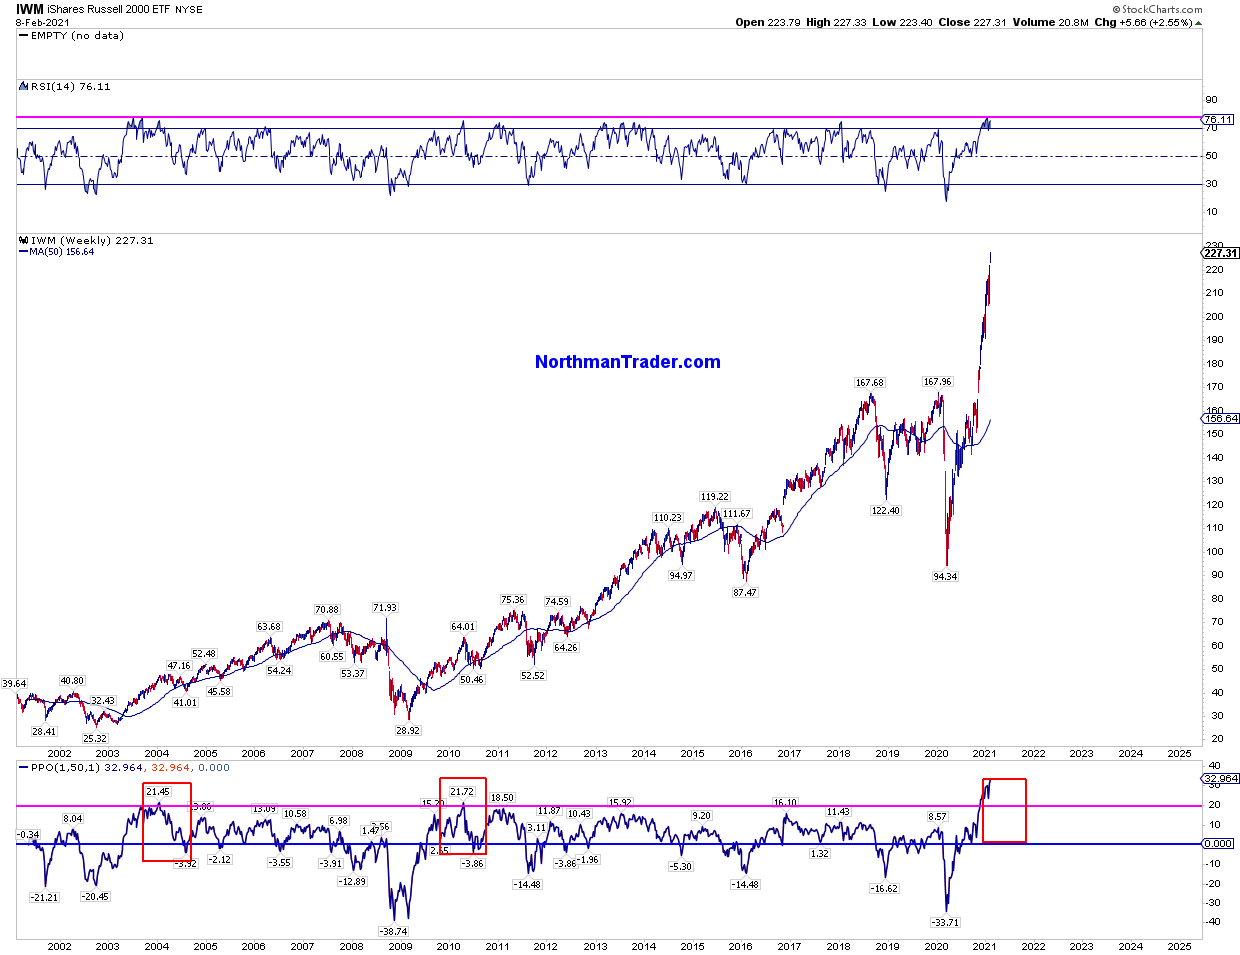
For example, small caps are now at a record 40% extensions above their 200 day moving average and never before has the weekly chart seen such a steep disconnect from the weekly 50 moving average:
However there is no market history, none, that doesn’t see an eventual reconnect with the weekly 50MA, the question of course is the when and where. The moving average is by definition moving and is now trending higher. Just a standard/basic reconnect at this time would constitute a market crash as prices are so historically extended. And be clear: Reconnects can take quite some time to happen, but it’s rare for it not to happen for more than a year.
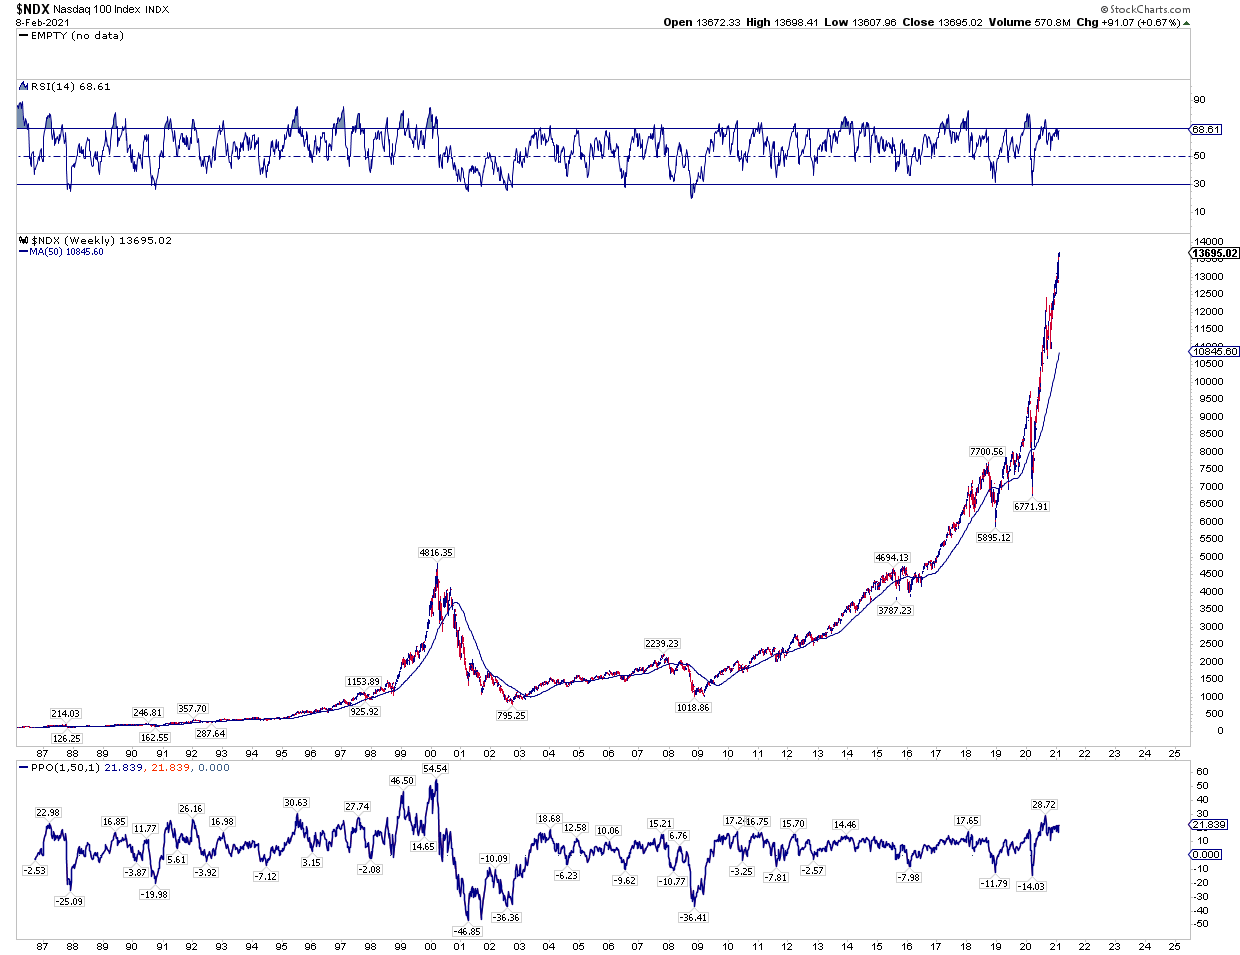
Bulls I suppose can take comfort in the history that extremes can become even more extreme as the tech sector showed in 2000:
So yes, extremes can become more extreme and hence the 4156 $SPX area remains a clear technical possibility for now.
If that’s the hill you want to die on go ahead for all chart history shows extreme extensions don’t last. Rebalancing will come and the severity of the rebalance is also driven by the extreme of the previous disconnect.
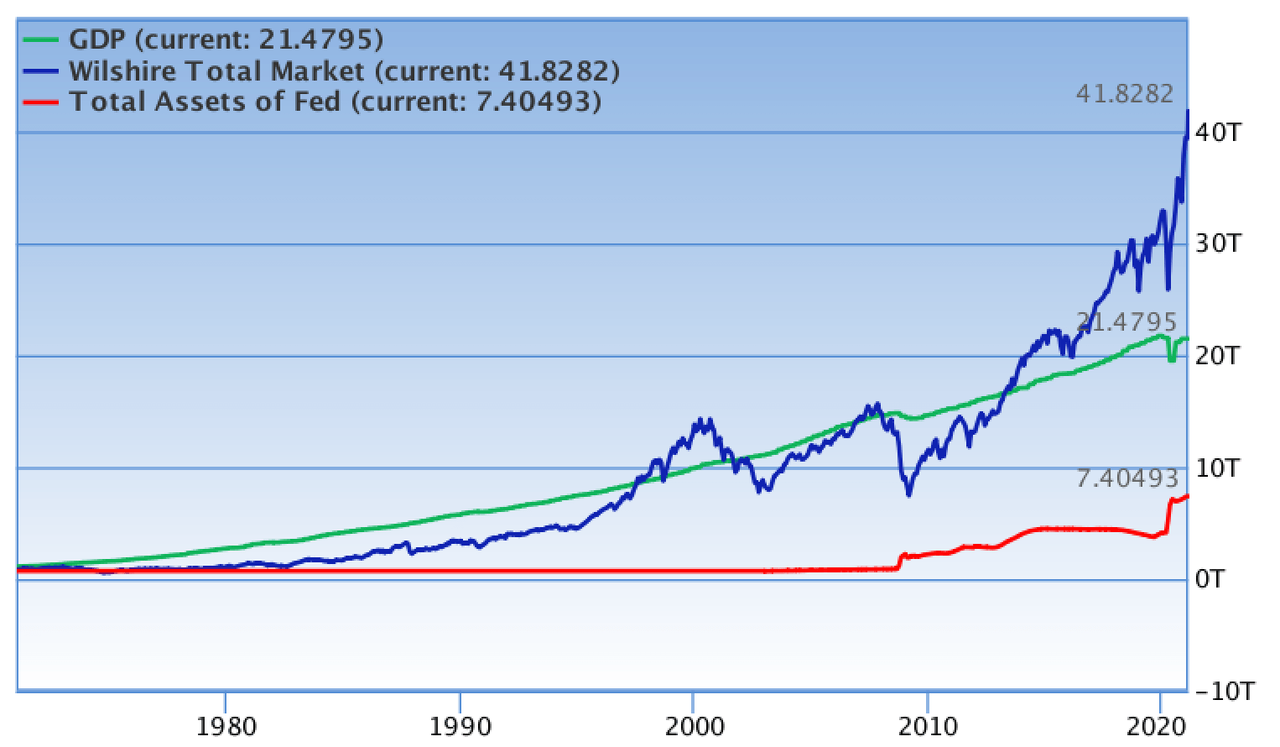
And that’s a critical point for there is yet another difference between now and 2020 and 2000 for that matter: Market cap to GDP now at 194.9% versus 158% in February 2020 and 150% in the year 2000.
Never have we seen markets this disconnected from the economy:
A rational bubble it’s been called because of the exorbitant amount of liquidity flowing through the system distorting everything.
Yet despite all this liquidity this market is behaving in a curious way. It is repeating the same behavior as it did last year before the crash. Except this year it is even more valued and more disconnected from technicals and fundamentals.
Last year the market topped February 19/20 and risk happened fast:
Don’t @ me saying I’m calling for a crash, I’m not. But a sizable correction remains very much overdue for this market that still appears impervious to all valuation concerns and remains among the most complacent markets in memory. In 2020 markets didn’t top until the later part of February. In 2000 markets didn’t top until March. 2021 has yet to show its hand.
But hey, maybe it’s different this time, although analyzing the charts above it appears that the more things change the more they stay the same.
* * *
For the latest public analysis please visit NorthmanTrader. To subscribe to our market products please visit Services.
Dems To Cut Off Stimulus Checks At $200K Household Income: Here’s What Else Is In The Fiscal Package
On Monday afternoon, House Dems released a draft of their fiscal package. Amid the top highlights is that Biden is going for the full $1.9T and is not succumbing to pressure to reduce the size of the bill to accommodate the GOP nor centrist lawmakers who may be at-risk in 2022 elections. Further, the timing appears to be Feb 22 to get a bill completed and sent for a floor vote with the goal of putting the bill into law by early/mid-March.
Following criticism that Joe Biden’s $1.9 trillion stimulus package would benefit the rich, House Democrats agreed that individuals earning more than $100,000 and couples with income above $200,000 will not be eligible for direct payments. Draft legislation released Monday by the House Ways and Means Committee (full summary below) called for $1,400 payments for single people earning $75,000 or married couples earning $150,000. The checks will now completely phase out for individuals making $100,000 or joint taxpayers making $200,000.
The payments will scale down more quickly than previous rounds, where the top levels were determined by the size of the payment and the number of children in the household. The first round of checks, approved in the Cares Act last March, started at $1,200 before they began phasing out.
According to Bloomberg, House Democratic leaders rejected a push by some moderate Democrats to lower the threshold at which payments begin phasing out at $50,000 for an individual and $100,000 per couple. One such proponent was the man who may be the most important Senator for the next two years – Joe Manchin, a West Virginia Democrat – who is critical to the Democrats’ 1-person majority in the Senate, and who has been pushing for lower income caps to qualify for the payments. Manchin told reporters on Monday that he wants to make sure that there is a “hard stop” so people making $250,000 or $300,000 don’t get payments and that the money is directed to people who are “truly in need.”
On the other end, progressives and socialists such a Senators Bernie Sanders have pushed for more inclusive thresholds. Last week, the Senate voted on a measure that would seek to bar “upper-income” people from qualifying for stimulus checks, but didn’t define the term.
Previously, a group of 10 Senate Republicans had proposed to send $1,000 payments to individuals earning as much as $40,000 or married couples earning twice that. Those checks would phase out completely once a single earner makes $50,000 or joint filers earn $100,000.
So what else is in the House Dems version of the fiscal package (via JPM).
EDUCATION AND LABOR PANEL
$130 billion for kindergarten through 12th grade school reopening
$40 billion for higher-education institutions
$39 billion for childcare businesses
$5 billion for extended pandemic food benefits
$4 billion for expanded home-heating assistance
$1.4 billion for senior-care services
Provisions to tighten workplace safety standards for Covid-19
Funding to subsidize health insurance for the newly unemployed, and to address a rise in domestic violence and child abuse
FINANCIAL SERVICES COMMITTEE
$10 billion to use the Defense Production Act to produce masks and other Covid-19 equipment,
$25 billion for rental assistance, largely run through the Treasury Department
$5 billion in assistance for the homeless.
$10 billion for direct assistance to homeowners for mortgage payments, property taxes and utility costs
$14 billion in payroll assistance to airlines, with $1 billion for their contractors
TRANSPORTATION COMMITTEE
$50 billion for the Federal Emergency Management Agency to deal with the Covid-19 disaster
$30 billion for transit
$8 billion for airports
$1.5 billion for Amtrak
CHILD TAX CREDIT
Boosts the annual child credit to $3,600 a year for children five and younger and $3,000 for those six and up.
The money would come in monthly instalments from July through December. The maximum child tax credit is currently $2,000 and is disbursed annually
Single-parent households earning up to $75,000 or couples making $150,000 will get the full credit amounts, which will phase out for incomes above those levels
The credits will be based on a family’s 2020 income.
For now, Democrats are pressing forward with the $15/hour minimum wage which the CBO said would help eliminate poverty while costing up to 1.4mm jobs (Goldman made a similar analysis of the minimum wage impact on the economy). That said, it is unlikely that the minimum wage hike will survive the Reconciliation process’s Byrd Rule which prevents any policies from being included in the budget reconciliation process unless they have a direct budgetary effect. Ironically, according to JPM, the CBO’s finding that the minimum wage increase would add $54 billion over 10 years to the budget deficit could improve the odds that the minimum wage stays in a final bill.
More importantly, expectations for the size of the final package are increasing as there does not appear to significant pushback from moderate Dems to the size and composition of the bill. That said, keep an eye on comments from Senators Manchin and Sinema, as Dems in traditionally GOP states they are more likely to oppose overly Progressive measures.
In response, Goldman revised its stimulus amount forecast and now thinks this amount is likely to be as high as $1.5 trillion (6.8% of GDP), up from the bank’s previous forecast of $1.1 trillion (5% of GDP). This is turn prompted the bank to also hike its GDP forecast for 2021 and 2022 up by about 0.2% each year, to 6.8% and 4.5%respectively, and to move forward its estimate of the first Fed rate hike from late 2024 to early 2024.
The tentative timeline is Feb 22 to get the bill to a floor vote, which target a final passage by early/mid-March.
According to Goldman, congressional leaders are aiming for passage ahead of the March 13 expiration of jobless benefits, but it might take until late March if things do not go smoothly. The relevant congressional committees appear to be aiming to pass their legislation late in the week of February 8 though in some cases this could slip to the following week. The House might be able to pass the combined package by late in the week of Feb. 22 but this might take until the week of March 1.
From there, the timing will depend mainly on how long it takes to get the bill through the Senate. Senate debate on a reconciliation bill is limited to 20 legislative hours but can take longer if there are many amendments. In practice, Senate consideration is likely to take a full week. From there, the time to enactment will depend mainly on whether there are any differences between the House and Senate versions, which would lead to additional negotiations and another round of votes in the House and Senate.
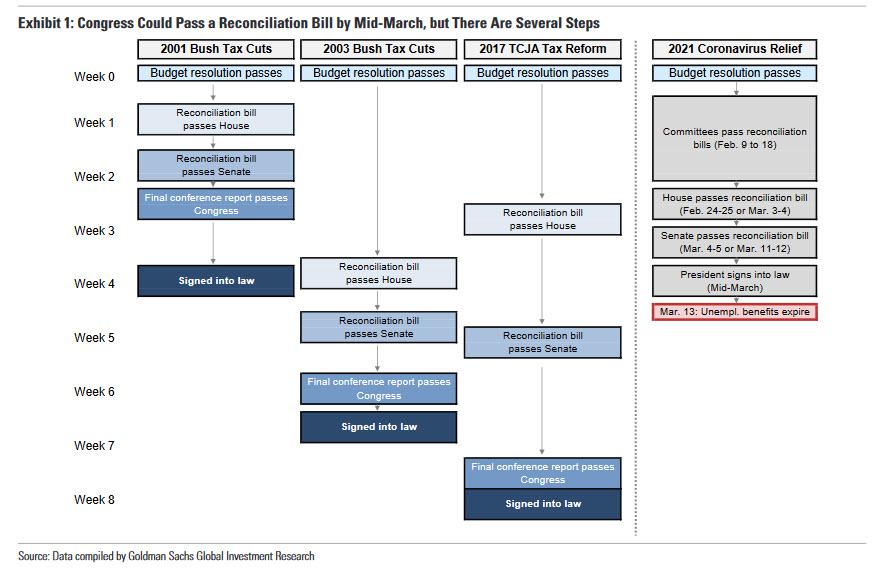
If congressional Democrats in the House and Senate are unanimous in their support for a single pre-negotiated package, Congress should be able to get the bill to the President in early March. In the more likely event that political disagreements arise that must be worked out, enactment in mid- to late March looks likely. Even with those delays, this would be on the quicker side of prior reconciliation bills. As shown in Exhibit 1, it took Congress only four weeks after passing the budget resolution to enact reconciliation legislation in 2001, but in 2003 and 2017 the process took longer.
Finally, from a market standpoint, JPM notes that “the larger the fiscal package, the stronger the support for multiple investment themes, including: Reflation, Cyclical Rally, Reopening, and Value Rally.
Equity sectors to play within these themes include: Banks; Emerging Markets; Energy and Semis.
As JPM concludes, “the completion of earnings season combined with a fiscal package becoming law may create the next leg higher in Equities, adding fuel to the reflation/cyclical trade.”
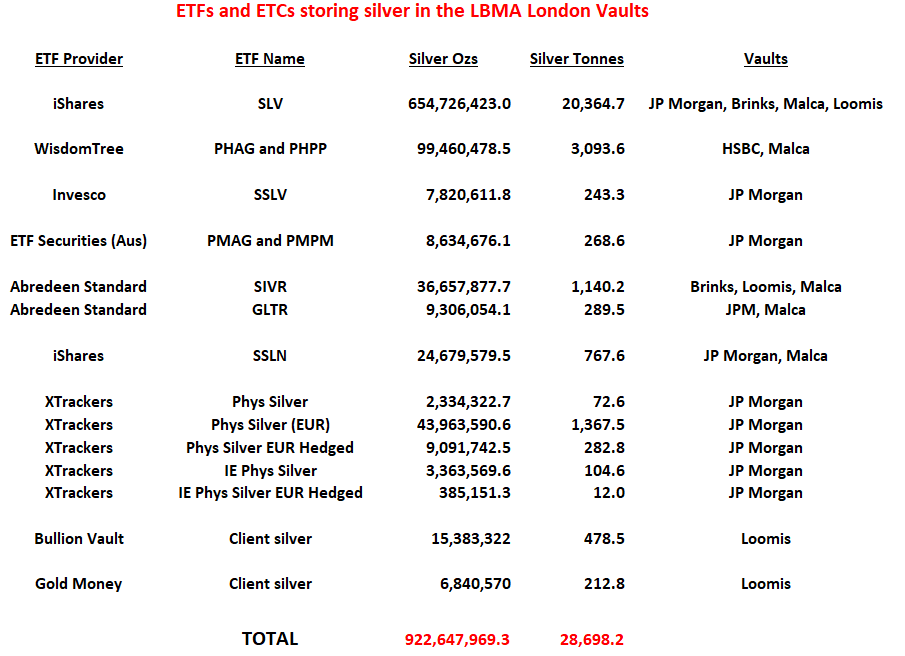
With the ongoing #SilverSqueeze and huge associated dollar inflows into silver-backed Exchange Traded Funds (ETFs), it is now time to look at which of these ETFs store their silver in the LBMA vaults in London, England, and to calculate how much physical silver these combined funds store in those London vaults.
These LBMA London vaults are run by seven vault operators which comprise three bullion banks JP Morgan, HSBC and ICBC Standard Bank – and four security firms – Brinks, Malca-Amit, Loomis and G4S.
While many eyes have been fixated on the mammoth iShares Silver Trust (SLV), that is only part of the picture, and there are 13 additional silver-backed ETFs that store their silver in London that people may not be aware of.
By calculating how much silver the ETFs hold in London , we can determine how much available physical silver remains in the London LBMA vaults that is not already held by these ETFs. This then gives an estimate of how much room these ETFs have before they hit a wall of not being able to source any more silver in the London vaults without having to import it or ship it in. And the answer, as you will see below, is not that much room at all.
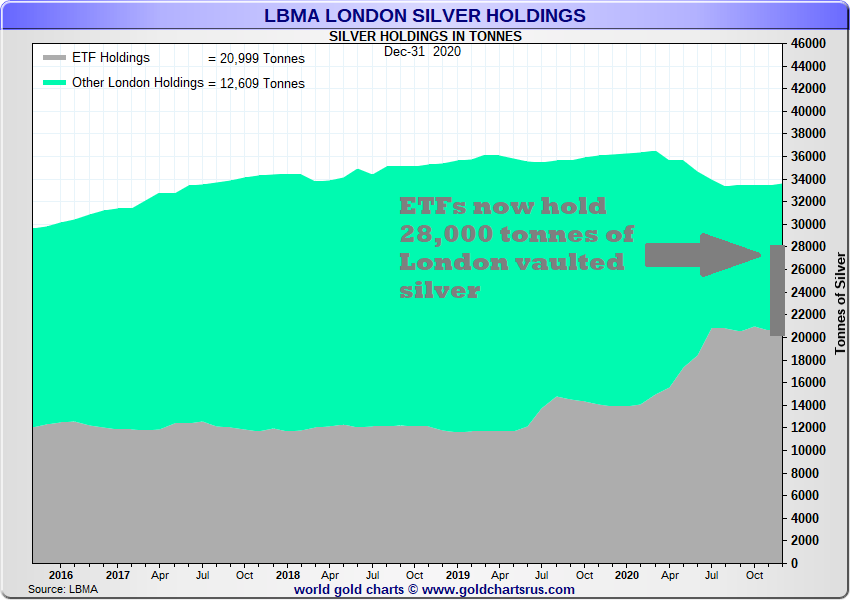
Because out of the 1.08 billion ounces of silver (33,609 tonnes) that the LBMA claims is stored in the London vaults (as per latest LBMA data to end of December 2020), a whooping 83.3% or 28,007 tonnes (900.42 million ozs) is already accounted for by these ETFs. This is based on ETF holdings as of end of day 5 February 2021.
Add in another 22.22 million ozs (691.3 tonnes) of silver held by Bullion Vault (BV) and Gold Money (GM) in the same London vaults, and there are a massive 28,698 tonnes (or 922.65 million ozs) of silver accounted for in the combined ETFs and in the BV/GM holdings. That’s 85.4% of all the silver that the LBMA claims is in the London vaults.
This leaves only 4,911 tonnes of silver from the LBMA total of 33,609 tonnes that is not already accounted for. That’s a mere 14.6% of total London vaulted silver stocks. The criticality of the situation was even more acute based on end of day data from 3 February 2021, when based on the same calculation approach, there was only 4,366.7 tonnes of silver in the LBMA vaults (13% of the total) that were not accounted for by silver ETF and other transparent silver holdings. On that day, a full 87% of all the silver in London was held the ETFs and other transparent holdings.
Reported Silver Holdings
Importantly, these holdings of Exchange Traded Product (ETP) silver inventories are part of reported silver bullion stocks. As the Silver Institute 2019 annual report (written by Refinitiv) explains:
“Identifiable bullion stocks can be separated into two categories: reported and unreported bullion stocks.
Reported stocks consist of industry, exchange, ETP and part of the government stock category.
Unreported stocks … consist mainly of government and custodian vaulted stocks.”
And notably, says the Silver Institute report, the unreported category is almost exclusively made up of custodian vaulted stocks of silver. According to Refinitiv:
“Terminal market inventory finds its way into Europe, driven by refiners off-loading their metal in times when investment demand is weak. The European and U.S. bullion banks in collaboration with major storage providers remain the main facilitators.”
Here, “terminal markets’ refers to commodity markets that are trading centres as opposed to production centres. When custodian vaulted stocks rise, says Refinitiv, it is “partly a reflection of weak investment demand more than anything else”. The converse is also true. When investment demand is strong, the unreported custodian vaulted stocks fall.
And where have we seen investment demand being strong right now? In the physical market of course, all the way from retail to wholesale to mints to refineries. So now is not a time when there will be “refiners off-loading their metal” into vaults because of weak investment demand. In fact the opposite is to be expected.
In short, strong investment demand leads to depleted unreported custodian vaulted stocks. And Exchange Traded Products have at all times to compete with the rest of the market for the pool of available silver in the London vaults of the storage providers.
Allocated Silver held by Wealth Sector
And we haven’t even factored in yet the allocated silver holdings that the wealth sector (investment institutions, family offices and High Net Worth individuals) hold in the LBMA London vaults, silver holdings which are also part of the unreported custodian vaulted stocks category.
And that, according to people I’ve talked to in the market, could be anywhere from 30 million and 50 million ozs (933 tonnes to 1,555 tonnes). Which would leave only between 3,300 tonnes and 3,900 tonnes of silver in the London LBMA vaults which is not held by ETFs and the wealth sector. And that is not a lot of silver for 14 ETFs to compete to secure.
To put this into perspective, over the 3 trading days from Friday 29 January – Tuesday 02 February, the iShares Silver Trust (SLV) just by itself claims to have added 3415 tonnes of silver, of which 1,070 tonnes was on the Friday 29 January, 579 tonnes on Monday 01 February, and another 1765 tonnes on Tuesday 02 February. This 3415 tonnes equates to 14% of annual mine supply and 10% of all the silver that the LBMA claims is in London vaults.
Another 3-4 days of similar magnitude dollar inflows just into SLV would require SLV to source another 3000-4000 plus tonnes of silver, which is mathematically impossible based on the amount of silver said to be in the London vaults. This could cause the SLV to literally seize up and cause all the other silver ETFs with London storage to seize up too. This is assuming no new silver arriving into the London market in quantity at this time. Which is not an unrealistic assumption to make given that there is currently a global demand spike for physical silver. In other words, “terminal market” physical silver inventory would not be “finding its way into Europe” since global investment demand is strong, not weak.
Painting the Tape in Paper Silver
Which is why it now looks like the bullion banks torpedoed the COMEX / LBMA price of silver on Monday 1 February and Tuesday 2 February so as to paint the tape and attempt to break investor sentiment and prevent further inflows into the silver ETFs. But if that was the plan, the bullion banks didn’t succeed, since total ETF holdings only ebbed marginally over the rest of the week following the bullion bank price onslaught.
Its also important to remember that the LBMA data on silver vault stocks in London covers all forms of silver bars and silver coins held in the LBMA vaults, not just the large Good Delivery silver bars http://www.lbma.org.uk/gdl-silver-bar-specifications.
“All physical forms of metal are included: large wholesale bars, coin, kilo bars and small bars.”
However, ETFs are limited by their prospectuses to only purchasing Good Delivery silver bars (which normally weigh 1000 oz each). Therefore, since the LBMA data covers all forms of silver bars and silver coins in the London vaults, the LBMA data of 33,609 tonnes total stock in London may be overstating how much of that is Good Delivery silver bars. Which means that the ETFs have even less leeway in sourcing silver inventory than would at first appear.
Note also that the Bank of England does not hold silver, because central banks do not hold silver at the Bank of England. In fact, central banks rarely if ever hold silver as a reserve asset. So unlike gold, bullion banks cannot borrow silver from central banks to augment supply and firefight demand.
Don’t forget also that professional investors and institutions hold huge quantities of unallocated ‘paper’ silver positions in the London LBMA market, in the form of claims against LBMA bullion banks for silver which is not readily available. This unallocated silver is really ‘silver credit’ or fractionally-backed / unbacked silver positions which have been created by the bullion banks to absorb demand that would otherwise have gone into physical.
As former LBMA CEO Stewart Murray euphemistically said in 2011: “various investors hold very substantial amounts unallocated gold and silver in the London vaults”. But what Murray failed to explain is that unallocated silver does not exist in a vault because it is not physical. It is a merely a paper claim on a bullion bank for a quantity of silver that the bank is obliged to find somewhere if the claimant happened to move to execute the claim.
The Squeeze is On
In short, the scarcity of available silver in the London LBMA vaults is far more advanced than most people think. And with 14 ETFs, and not just SLV, competing for available silver, the bullion banks and storage providers are now in a “Houston, we have a problem” mode. A problem which you will see from a quick review of these 14 silver-backed ETFs and Exchange Traded Products (ETPs) which claim they are fully physically backed with silver stored in LBMA vaults in London. First we will review all the other ETFs, and finally end with the big one SLV. The review below uses a similar framework to the 2017 BullionStar article “How many Silver Bars are in the LBMA Vaults in London?”, and uses some helpful updates last week from Daniel March.
PHAG / PHSP is the WisdomTree Physical Silver fund. It has two ticker codes as it trades on the London Stock Exchange (LSE) in US dollars (PHAG LN) and pounds sterling (PHSP LN). It’s the same product with two lines, so in this analysis is easier to refer to as PHAG.
PHPM / PHPP is the WisdomTree Physical Precious Metals fund. PHPM /PHPP was formerly known as ETFS Physical PM Basket until the WisdomTree acquisition of ETF Securities European business. The silver custodian of PHAG is also HSBC bank plc, London. The WisdomTree Physical Precious Metals product also trades on the LSE in two currencies US dollars (PHPM LN) and pounds sterling (PHPP LN), but is easier to refer to here as PHPM.
As of end of day 5 February, WisdomTree claims the combined silver holdings of PHAG and PMPM total 99,460,478.5 ozs (3,093.64 tonnes) in the form of 102,667 silver bars. The bar list can be seen in XLS format here, ( a link to a zip file opens the latest xls).
The PHAg and PHPM silver is claimed to be split between HSBC’s London vault and Malca-Amit’s London vault, with 43,379,829.9 (1,349.29 tonnes) in the HSBC vault in the form of 44,620 silver bars, and 56,080,648.6 ozs (1,744.35 tonnes) in the Malca-Amit vault in the form of 58,047 silver bars.
Oddly, the WisdomTree website product pages say that PHAG holds 95,579,115 troy oz of silver, and PHPM holds 1,296,137 troy oz of silver, which is a combined total of 96,875,252 ozs, which is 2,585,226.5 ozs less than the combined total reported.
The custodian of SSLV is JPMorgan Chase Bank. The silver owned by SSLV is claimed to be in JP Morgan’s vault in London.
As of end of day 5 February 2021, SSLV claimed to hold 7,820,611.8 troy ozs of silver (243.25 tonnes) in the ‘JPM London V (VLT)’ vault in London, in the form of 8061 silver bars. The 5 February bar list is at the link here.
PMAG is the ETFS Physical Silver product. It is operated by ETF Securities Australia, and also known as ETPMAG. The custodian of the PMAG silver is JPMorgan Chase Bank NA, London.
PMPM is the ETFS Physical Precious Metal Basket. Its also operated by ETF Securities Australia, and also known as ETPMPM (Basket). The custodian of the PMPM silver is also JPMorgan Chase Bank NA, London.
PMAG and PMPM report this silver holdings in a combined report under ETFS Metal Securities Australia Limited. As of 4 February 2021, the latest dated report that has been uploaded to the ETFS Australia website, the combined silver holdings in London of PMAG and PMPM was 8,634,676.1 ozs (268.57 tonnes) in the form of 8,909 silver bars, all claimed to be held in the JP Morgan vault in London. The link to the bar list in XLS format is here.
As of end of day 5 February 2021, SIVR claimed to hold 36,657,877.7 ozs of silver (1,140.21 tonnes) in the form of 37,537 silver bars. Currently, none of the silver of SIVR is held in JP Morgan’s London vault. It’s all claimed to be held in the London vaults of Brinks, Malca-Amit and Loomis. Specifically the SIVR bar list shows all the silver as being held in ‘Brinks Premier Park’, ‘Loomis Int (Viamat)’, and ‘Malca-Amit’.
This storage arrangement is however, very strange, since on 14 August 2020, the last physical audit of SIVR showed that all its silver was held in the JP Morgan vault in London, specifically at that time “32,712 London Good Delivery Silver Bars with a weight of 31,827,933.800 troy ounces”. That’s 989.98 tonnes of silver. See audit report here.
Then why is all of the SIVR silver now in the vaults of sub-custodians and none of the SIVR silver is in the vault of the custodian JP Morgan? Why did 989.98 tonnes of SLRV silver move out of the SIVR vault since 14 August 2020 and is now claimed to be in the vaults of 3 sub-custodians, Brinks, Malca-Amit and Loomis?
As of end of day 5 February 2021, GLTR claimed to hold 9,306,054.1 ozs of silver (289.46 tonnes) in the form of 9,548 silver bars. Currently, this silver is claimed to be stored in the JP Morgan London vault (about 92%) and a Malca-Amit vault (about 8%). Yet there is no recent physical audit report for the GLTR silver on the Aberdeen Standard website.
In total between them, SIVR and GLTR claim to hold 1,429.67 tonnes of silver in the LBMA London vaults.
SSLN – iShares
SSLN is the iShares Physical Silver ETC. The custodian of SSLN is JPMorgan Chase Bank NA, London Branch. Not to be confused with the much larger iShares Silver Trust (SLV). See below for SLV.
As of end of day 5 February 2021, SSLN claimed to hold 24,679,579.5 ozs of silver (767.64 tonnes) in 2 vaults in London, roughly split between the JP Morgan vault London (2/3) and the Malca Amit’s London vault (1/3). The exact figures being ‘JPM V’ vault with 16,947,579 ozs (17,387 silver bars), and Malca-Amit vault with 7,732,000.5 ozs (7,975 silver bars).
The SSLN bar list, which updates the same PDF file each day, can be seen at the link here.
XTrackers – Deutsche Asset Management – now called DWS
Deutsche Bank Asset Management (now called DWS) operates 5 DWS XTrackers which hold physical silver. These are known as the XTracker Physical Silver ETCs. A list of XTracker precious meals ETCs can be seen in the list here.
The custodian of the silver for all of these XTracker ETCs is JP Morgan Chase Bank NA, and the silver is claimed to be in the JP Morgan vault in London.
In total, as of end of day 5 February 2021, these 5 XTrackers hold 1,839.45 tonnes of silver in London. This figure is correct and is based on data directly from the DWS website and from a Deutsche daily Excel sheet of funds and holdings. There are no silver bar lists or audit reports on the DWS website, nor anywhere else.
The silver holdings of each of these XTrackers as of 5 February was as follows:
Ironically, the silver XTrackers can be complicated to keep ‘track’ of, as they are domiciled in a number of jurisdictions (UK and Ireland), trade on various exchanges (LSE and Xetra), trade in various currencies (USD and EUR), and have various metal entitlements per security depending on the particular ETC.
The Xtrackers IE Physical Silver ETC Securities may look like 2 separate XTrackers, but it’s not, because both have the same ISIN, and they just trade as XSLR on LSE, and XSLR on Xetra. So to reiterate, there are 5 silver XTrackers, not 6 as some people might initially think.
Excluding SLV, the other silver-backed ETFs which store their silver in London claim to hold a combined 7,642.23 tonnes of silver in London LBMA vaults, which is 27.2% of all ETF silver in London, 22.7% of all the silver said to be in the London LBMA vaults, and 37.5% of the silver claimed to be in SLV. So any discussion of the #SilverSqueeze must take into account these other 13 ETCs from a total of 6 providers.
Apart from SLV, the biggest silver ETFs which hold their silver in London are PHAG from Wisdomtree with 2974 tonnes, XAD6 XTracker from Deutsche with 1367.45 tonnes, and SIVR from Aberdeen with 1,140.21 tonnes. So next time someone mentions SLV, tell them about PHAG, SIVR, XAD6, and the other ETFs / ETCs.
Other Transparent Silver Holdings
As mentioned above, there are some other silver holdings in the LBMA London vaults which are transparent since they are publicly reported on. These are the silver holdings of customers of Bullion Vault (an LBMA member) and Gold Money. As of 5 February, the reported silver holdings of Bullion Vault in the London vaults of Loomis (mostly in Feltham and a small amount in Shepperton) was 478,474.795 kgs, which is 15,383,322 ozs or 478.5 tonnes. The link to Bullion Vault silver holdings in London is here.
SImilarly, on 5 February, the reported silver holdings of Gold Money in the London LBMA vaults (Loomis) was 212,765.5 kgs, which is 6,840,570 ozs or 212.8 tonnes. The link to Gold Money silver holdings in London is here.
Together the silver holdings of Bullion Vault and Gold Money in London LBMA vaults total 691.3 tonnes.
Does the SLV silver ETF (custodian JP Morgan) have all the silver it claims to have?
Now, if you have digested all of that, let’s look at SLV.
As of end of day 5 February 2021, SLV claims to hold a massive 654,726,423 ozs of silver (20,364.74 tonnes).
Recently, the SLV bar list has been 1 day behind the stated SLV totals. And so the SLV bar list as of end of day Friday 5 February shows SLV’s claimed holdings as of end of day Thursday 4 February, which were a claimed 659,278,427.9 ozs of silver (20,505.85 tonnes) in the form of 675,425 silver bars.
SLV’s bar list is mammoth and runs to 10561 pages, with a filesize of 27 MBs. Luckily, the first page contains all the vault data. Based on the 5 February bar list (which refers to 4 February silver holdings), SLV claims to hold silver over an incredible 7 vaults, 6 of which are in London.
Three of these vaults are operated by Brinks, two vaults are operated by JP Morgan (the SLV custodian), one vault operated by Malca-Amit, and one vault operated by Loomis.
The three Brinks vaults are Brinks London C, Brinks Premier Park (London), and Brinks Unit 7 in Radius Park (London).
Brinks (Premier Park) is located in an industrial estate called Premier Park, off Abbey Road in Park Royal, north-east London, and is actually down the road from the G4S vault which is at 291 Abbey Road, Park Royal. Brinks unit 7 is, as the name suggests in Unit 7 of the industrial park near Hatton Cross tube station, beside Heathrow Airport. Brinks London C could also possibly be in Radius Park, as Brinks occupies a number units in Radius Park, such as units 1 and 3. But Brinks London C could be elsewhere. Note, SLV used to store some of its silver in Brinks London A, back about 7 – 10 years ago.
The JP Morgan London vault is referred to by SLV as JPM London V (which is the same vault as other ETFs use). This may be the JP Morgan vault under John Carpenter St/ Carmelite St in the City of London . Note, SLV used to store some of its silver in a vault called JPM London A back in the day.
The JPM New York vault is under 1 Chase Manhattan Plaza in Manhattan. The Malca Amit vault is referred to as Malca Amit UK (MA) London. This Malca vault is located in Arena Parkway, Hounslow in London, near Heathrow Airport.
The Loomis vault is referred to as Loomis International (UK) Ltd (VIAMAT) London, in Feltham, London, near Heathrow Airport.
Looking at the SLV bar list for 4 February, and the silver holdings distribution by vault, a few things jump out.
Only 27% of the claimed SLV silver is located in the JP Morgan vaults (the custodian vaults). A full 73% of SLV silver is held in the vaults of custodians.
Brinks vaults now claim to hold 48% of SLV silver, the Malca Amit vault holds 22%, and Loomis holds 3%.
Between 29 January and 5 February, 2854 tonnes of silver was claimed (by JP Morgan) to have been added to SLV. Exactly 50% of this silver was claimed to appear in the Brinks Premier Park vault, 18% in the Brinks Radius Park unit 7 vault, and 22% in the Loomis vault, with only 6% from the JP Morgan vault, and only 3% from the Malca-Amit vault
Between the same dates there was no change in the SLV silver claimed to be held in Brinks vault C, nor in JP Morgan vault New York (see below)
As recently as 30 January, there were only 5 vaults listed on the SLV bar list. On that day, Brinks Radius Park was not listed nor was the Loomis vault.
The Loomis vault only appeared on the SLV bar list on 3 February. The Brinks Radius Park unit 7 vault only appeared on the SLV bar list on 2 February.
JP Morgan, the SLV custodian, has had to heavily tap Brinks (specifically Brinks Premier Park vault and Brinks Radius Park vault) and Loomis’ vault for the bulk of the claimed silver inflows
The Brinks Premier Park vault now claims to hold 31% of all SLV silver, followed by 14% for the Brinks London C vault, and 3% for the Brinks Radius Park Unit 7 vault.
Of the 27% of SLV’s claimed silver located in JP Morgan vaults, this is distributed as 11% in JP Morgan London vault and 16% in JP Morgan New York vault.
A Note about SLV and COMEX
Since the big dollar inflows into SLV beginning on 29 January, the silver inventory claimed to be in the JP Morgan New York vault, i.e. 103,176,253 ozs (3,209.21 tonnes) in the form of 102,837 silver bars, has not changed at all.
Furthermore, all silver bars claimed to be held by SLV are in the form of Good Delivery silver bars (usually about 1000 oz in weight). All the SLV silver claimed to be in the JP Morgan New York vault will be in the form of 1000 oz bars.
The flagship silver futures contract on COMEX is the SI 5000 oz contract which is deliverable as 5 * 1000 oz silver bars in COMEX approved vaults in New York.
Currently, as of end of day 5 February, the COMEX daily silver inventory report shows the JP Morgan New York vault as containing 152,946,614.74 ozs (4757.28 tonnes) of Eligible silver. Exactly 103,176,253 ozs (3,209.21 tonnes) of this silver belongs to SLV. Therefore, on the COMEX silver vault report under JP Morgan’s Eligible category, there is only 49,770,361.74 ozs (1548 tonnes) which does not belong to SLV. Something that many people probably never thought of before.
So any calculation of available silver on COMEX has to take this SLV silver into account.
Conclusion
If the above 14 ETFs see continued investment inflows, they will all have to compete for the available silver in London which is not already held within these ETFs. And that available silver is at an historic low, some 3000 tonnes or so. A few more days of inflows like the ones seen over 29 January to 2 February would be a major emergency for these ETF providers, particularly the iShares SLV. Because there is just not that much physical silver left in the vaults of JP Morgan, Brinks, Malca-Amit, Loomis and HSBC, which is not already reported as being in these ETFs.
And lets not forget all the unallocated silver positions which are outstanding which are claims against the bullion banks for silver which they have not got. Anyone with deep enough pockets could now cause a serious run on the remaining available silver stored in London that is not currently attributed to the above ETFs.