The Death Of The Virtuous Cycle

Authored by Michael Lebowitz via RealInvestmentAdvice.com,

Debt allows a consumer (household, business, or government) to pull consumption forward or acquire something today for which they otherwise would have to wait. When the primary objective of fiscal and monetary policy becomes myopically focused on incentivizing consumers to borrow, spend, and pull consumption forward, there will eventually be a painful resolution of the imbalances that such policy creates. The front-loaded benefits of these tactics are radically outweighed by the long-term damage they ultimately cause.

Due to the overwhelming importance that the durability of economic growth has on future asset returns, we take a new approach in this article to drive home a message from our prior article The Death of the Virtuous Cycle. In this article, we use two simple examples to demonstrate how the Virtuous Cycle (VC) and Un-Virtuous Cycle (U-VC) have benefits and costs to society that play out over time.

The Minsky Moment

Before walking you through the examples contrasting the two economic cycles, it is important to put debt into its proper context. Debt can be used productively to benefit the economy in the long term, or it can be used to fulfill materialistic needs and to temporarily stimulate economic growth in the short term. While both uses of debt look the same on a balance sheet, the effect that each has on the borrower and the economy over time is remarkably different.

In the course of his life’s work as an economist, Hyman Minsky focused on the factors that cause financial market fragility and how extreme circumstances eventually resolve themselves. Minsky, who died in 1996, only recently became “famous” as a result of the sub-prime mortgage debacle and ensuing financial crisis in 2008. 

Minsky elaborated on his “stability breeds instability” theory by identifying three types of borrowers and how they evolve to contribute to the accumulation of insolvent debt and inherent instability.

  • Hedge borrowers can make interest and principal payments on debt from current cash flows generated from existing investments.

  • Speculative borrowers can cover the interest on the debt from the investment cash flows but must regularly refinance, or “roll-over,” the debt as they cannot pay off the principal.

  • Ponzi borrowers cannot cover the interest payments or the principal on debt from the investment cash flows, but believe that the appreciation of the investments will be sufficient to refinance outstanding debt obligations when the investment is sold.

Over the past 20 years, investors have been witness to a remarkable sequence of bubbles. The first culminated when an abundance of Ponzi borrowers concentrated their investments in the equity markets and technology stocks in particular. Technology companies, frequently with operating losses, raised capital through stock and debt offerings from investors who believed excessive valuations could expand indefinitely.

The second bubble emerged in housing. Many home buyers acquired houses via mortgages payments they could in no way afford, but believed house prices would rise indefinitely allowing them to service their mortgage obligations via the extraction of equity.

Today, we are witnessing a broader asset price inflation driven by a belief that central banks will engage in extraordinary monetary policy indefinitely to prop up valuations in the hope for the always “just around the corner” wealth effect. Equity markets are near all-time highs and at extreme valuations despite weak economic growth and limited earnings growth. Bond yields are near the lowest levels (highest prices) human civilization has ever seen. Commercial real estate is back at 2007 bubble valuations and real assets such as art, wine, and jewelry are enjoying record-setting bidding at auction houses.

These financial bubbles could not occur in an environment of weak domestic and global economic growth without the migration of debt borrowers from hedge to speculative to Ponzi status.

Compare and Contrast

The tables below summarize two extreme economic models to exhibit how an economy dependent upon “Ponzi” financing compares to one in which savings are prioritized. In both cases, we show how the respective financial decisions influence consumption, profits, and wages.

Table 1, below, is based on the assumption that consumers spend 100% of their wages and borrow an additional amount equivalent to 10% of their income annually for ten years straight. The debt amortizes annually and is therefore retired in full in 20 years.  

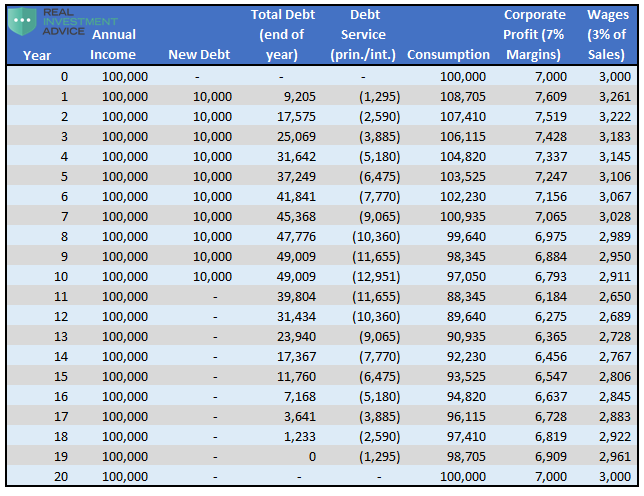
Assumptions: Debt is borrowed each year for the first ten years at a 5% interest rate and ten year term, corporate profits and employee wages are 7% and 3% of consumption respectively, annual income is constant at $100,000 per year. 

Table 2, below, assumes consumers spend 90% of wages, save and invest 10% a year, and do not borrow any money. The table is based on the work of Henry Hazlitt from his book Economics in One Lesson.  

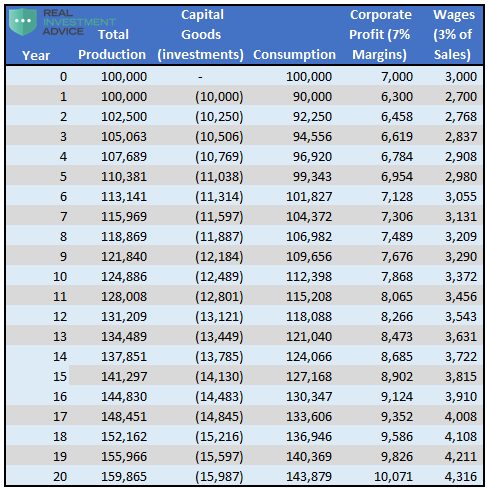
Assumptions: Productivity growth is 2.5% per year, corporate profits and employee wages are 7% and 3% of consumption respectively.

Table 1 is the U-VC and Table 2 is the VC. The tables illustrate that there are immediate economic benefits of borrowing and economic costs of saving. For example, in year one, consumption in Table 1 rises as a result of the new debt ($100,000 to $108,705) and wages and corporate profits follow proportionately. Conversely, table 2 exhibits an initial $10,000 decline in consumption to $90,000, and a similar decline in wages and corporate profits as a result of deferring consumption on 10% of the income that was designated for saving and investing.

After year one, however, the trends begin to reverse. In the U-VC example (Table 1), when new debt is added, debt servicing costs rise, and the marginal benefits of additional debt decline. By year eight, debt service costs ($10,360) are larger than the additional new debt ($10,000). At that point, without lower interest rates or larger borrowings, consumption will fall below the income level.

Conversely, in the VC example (Table 2), savings and investments engender productivity growth, which drives wages, profits, and consumption higher.

The graphs below highlight the consumption and wage trends from both tables.

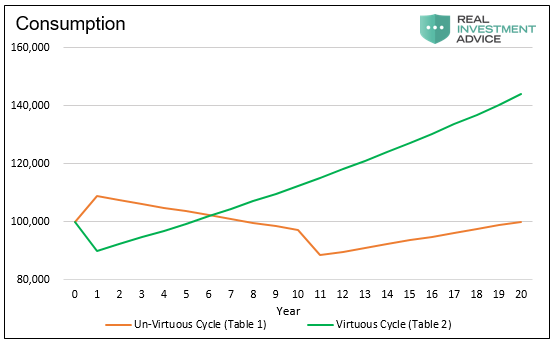
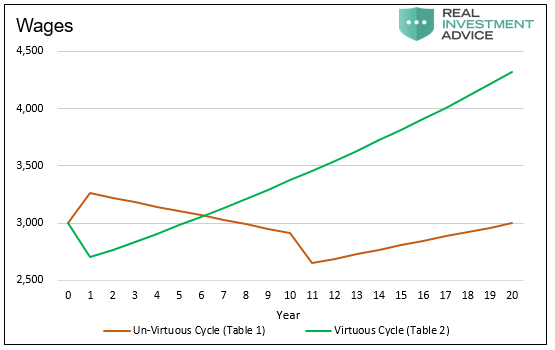
As illustrated in both graphs, the short term justification for promoting the U-VC is prompt economic growth. Equally important, the reason that savings and investments in the VC are admonished is that they require discipline and a period of lesser growth, profits, and wages.

Debt-fueled consumption is an expedient measure to take when economic growth stalls and immediate economic recovery is demanded. While the marginal benefits of such action fade quickly, a longer-term policy that consistently encourages greater levels of debt and lower debt servicing costs can extend the beneficial economic effects for years, fooling many consumers, economists and business leaders into believing these activities are sustainable.

In the tables above, it takes almost seven years before consumption in the VC (Table 2) is greater than in U-VC (Table 1).  However, after that breakeven point, the benefits of a VC become evident as economic growth compounds at an increasing rate, quickly surpassing the stagnating trends occurring under the U-VC.

In the real world, VC or U-VC economies do not exist. Economies tend to exhibit characteristics of both cycles. In the United States, for example, some consumers and corporations are saving, investing, and generating productive economic gains. Productivity gains from years past are still providing benefits as well.  However, over the past 30 years, consumers have increasingly opted to borrow and consume in a Ponzi-like manner and neglect savings. In other words, the U.S. economy has increasingly favored “Ponzi” debt-fueled consumption and denied the benefits of savings and the VC. Then again, U.S. leadership has only encouraged these behavioral patterns through imprudent fiscal and monetary policies.

The U.S. and many other countries are once again approaching what has been deemed the Minsky Moment.  Similar to 2008, this is the point when debt becomes unserviceable and a sharp increase in defaults is unavoidable. Will the Federal Reserve be able to once again reignite “Ponzi” borrowing to suspend that outcome?

Summary

The U.S. and many other countries are forced to deal with the consequences of economic policy actions, borrowing, and consumption behaviors from years past. While the present economic situation is troubling, leadership is obligated to reflect on past choices and move forward with changes that are in the best interest of the country and its entire population. As our title suggests, we can continue to try to pull consumption forward and further harm future growth, or we can save and reward future generations with productivity gains resulting in greater economic growth and prosperity. 

Shifting direction, and “paying forward,” via more savings and investments and the deferral of some consumption, comes with immediate negative consequences to wages, profits, and economic growth. Nothing worth having is easy, as the saying goes. However, over time, the discipline is rewarded, and the economy can be on a more sustainable, prosperous path.

These economic concepts, tables, and graphs extend an accurate diagnosis of the “Death of the Virtuous Cycle.” They are intended to help investment managers better understand the costs and benefits of saving versus borrowing from a macroeconomic perspective. If successful in that endeavor, the substance of this article will afford managers better ideas about how to navigate a very uncertain investment landscape. The implications for the sustainability of economic growth and therefore long term asset returns are profound and the bedrock of all investment decisions. 

via ZeroHedge News http://bit.ly/2wDYyKn Tyler Durden

Majority Of Recent College Grads Don’t Have Jobs Lined Up, Survey Shows

American students carry an aggregate pile of student loan debt equivalent to roughly $1.5 trillion, a generational burden that has helped contribute to plunging birth rates, lower home-ownership rates among young people, and even lower rates of stock ownership, as more young people dedicate more financial resources to paying down debt.

But to gauge exactly how much a students’ finances factor into their decisions about which school to attend and which majors to choose, MidAmerica Nazarene University surveyed 2,000 recent graduates from around the country to learn more about how they financed their degrees, and how much they will owe after graduation.

Given the cost of higher education in the US, the majority of students answered that post-grad job prospects influenced the major they selected (those who answered ‘no’ either really enjoy studying STEM, or majored in gender studies).

J

It might seem surprising given the financial stakes, but the survey also showed that more than 60% of recent grads didn’t have jobs lined up when they received their diplomas.

Job

For those who did choose their careers based on financial considerations, a majority said they would have picked another line of work if finances weren’t a consideration (but hey, we can’t all be artists).

Market

Once upon a time, there wasn’t as much of a correlation between a students’ field of study and their eventual chosen career (investment bankers who studied English at Middlebury College wound up on Wall Street thanks to ‘Uncle Jim’s’ connections). But as the world of higher education becomes increasingly costly and cut throat, situations like this are becoming increasingly rare.

Jobs

One of the more telling data points in the study was the gauge of graduates’ feelings about the job market. Even with unemployment at multi-decade lows, a majority of graduates had a negative outlook on the job market.

Grad

The overwhelming majority of students took out loans to pay for some or all of college, with 71% taking out loans and the average amount borrowed equivalent to just over $25,000.

71

In addition to taking on loans, most college students receive at least some help from family members or other sources, as only one-quarter of respondents said they completely self-financed their degree.

Chart

On average, students expect to pay off their loans in 9.5 years, meaning that most of these students will be in their mid-30s when they finally reach a zero balance.

Imagine what that number would be if students had no help from their families?

via ZeroHedge News http://bit.ly/2wFr3HS Tyler Durden

Quant-tastrophe Looms: Factor Vol Soars Above August 2007 Disaster

For those with short memories, markets don’t always go up and aren’t always liquid enough to allow you to exit before the bagholders. As detailed at the time,  during the week of August 6, 2007, a number of high-profile and highly successful quantitative long/short equity hedge funds experienced unprecedented losses.

The losses at the time were initiated by the rapid unwinding of one or more sizable quantitative equity market-neutral portfolios.

Given the speed and price impact with which this occurred, it was likely the result of a sudden liquidation by a multi-strategy fund or proprietary-trading desk, possibly due to margin calls or a risk reduction.

These initial losses then put pressure on a broader set of long/short and long-only equity portfolios, causing further losses on August 9th by triggering stop-loss and de-leveraging policies.

It was a harrowing time for markets then and, somewhat ominously, Morgan Stanley’s Quant Strategies group is worried that groupthink has infected the quant markets once more as Chris Metli warns that factor volatility has spiked, and for some factors like Momentum this has been one of the most rapid moves higher in volatility on record

Factor volatility is not yet at the peaks seen during the Feb 2016 or October 2018 unwinds, but it’s getting there, and it has eclipsed (and risen faster than) the volatility seen during the August 2007 factor unwind.

QDS noted last week that something wasn’t quite right in the market, and given these violent swings in factors that judgment still holds today.  What’s going on?  At the core it is crowded positioning and valuations across factors and sectors (i.e. Growth and Defensives over-owned while Value and Cyclicals under-owned). 

And despite the increased volatility, positioning doesn’t appear to have become too much cleaner in recent days.

Over the last two weeks, rotations between the super-sectors of Cyclicals (including Financials), Defensives, and Tech have accounted for a historically-high share of total dispersion between stocks in the S&P 500 (prior similar peaks were Oct 2018, April 2018, and June 2017). 

This fact means that investors who have been positioned wrong way on any of these three legs of the market (as many are) have been whipsawed.

There is really no way besides positioning to explain the recent swings, particularly in Cyclicals vs Defensives.  Tuesday’s short squeeze driven rally brought a healthy bid to Cyclicals (which made sense) but then Wednesday that performance reversed with a flight to the ‘safe havens’ of Defensives and Tech – despite a 80 bps rally in the S&P 500. 

As John Storey on the MS Custom Basket team noted “no time in the last 5 years has a 3.5% move in MSZZCYDE been followed by a reversal of -2% or more the next day. We got that today.”  Investors are getting chopped up between covering underweights / shorts and flocking back into old favorites.

This back and forth threatens to push portfolio volatility higher and drive a deleveraging / degrossing.  That is exactly what happened starting in 3Q into 4Q last year. 

While a risk reduction is likely in the cards given higher volatilities, the pace of L/S deleveraging is likely to be more gradual than in 4Q18.  Why?  P/L, timing, and magnitude/duration of the shock.  In the 2018 unwind P/L for many funds had turned negative, it was later in the year, and portfolio volatility had been rising and elevated for some time.  In 2019 many active managers and HFs still have materially positive P/Ls that provide a buffer before deleveraging becomes forced, it is earlier in the year, and at least so far volatility has only been elevated for a short period of time.  Of course any fundamental deterioration in crowded positions could change these dynamics, but for now there is less risk than there was heading into 4Q 2018.  While that may not be enough to stop deleveraging, it does mean it will be more gradual.

Given that positioning is still imbalanced QDS favors shorting over-owned names (i.e. Growth and Tech) as these should prove underperformers in either a more convincing bull or bear market.  Selling Momentum is similar but may be harder without a strong market-bearish view given that a lot of the volatility is coming from the short leg of the trade where positioning is light and susceptible to squeezes. 

At the index level it is evident that the market can go up faster than it can go down given light positioning and high levels of short exposure.  That doesn’t mean the market can’t go lower, just that it will be a trend not a gap

With equity investors still clinging to a Fed driven “bad is good” mindset (see the gap between stock and bonds above) and underestimating the structural impacts of trade disruption and economic nationalism, QDS favors leaning short equities but protecting against squeezes with upside calls.

via ZeroHedge News http://bit.ly/2Is6UdJ Tyler Durden

1 Dead, 22 Injured In West Point Training Accident, Trump Prays For All

While details are sparse for now, West Point has confirmed an accident involving a light medium tactical vehicle occurred “in the vicinity of the Camp Natural Bridge training site,” killing 1 cadet and injuring 22 others.

The US military academy is located in New York, a 45-minute drive away from New York City, according to the academy.

As ABCNews reports, army and local first responders were at the scene treating the injured near the Camp Natural Bridge training site which is on U.S. Military Academy property, officials said.

“One cadet is reported deceased, 20 cadets were injured and two soldiers were injured,” said Lt. Col. Chris Ophardt, a spokesman for the U.S. Military Academy.

“They were involved in an LMTV accident that occurred at approximately 6:45am in the training area off of Route 293, ” he added.

LMTV stands for Light Medium Tactical Vehicla, and is a truck used for personnel or equipment transport.

“The injured have been transported to local hospitals,” said Ophardt. “Details of the incident are under investigation.”

New York Democratic Gov. Andrew Cuomo said in a statement he was directing New York’s Office of Emergency Management “to provide any resources necessary” to assist following the accident.

“On behalf of all New Yorkers, we pray for a speedy recovery for those involved and we share in the sorrow experienced by their loved ones during this extremely difficult time,” Cuomo’s statement said.

President Trump has sent his best wishes:

Finally, CNN notes that while the US looks at winding down various combat operations overseas, the military has been grappling with how to prevent deadly training incidents both at home and abroad.

Between 2006 and 2018, 31.9 percent of all active duty military deaths were the result of accidents, according to a congressional report. Only 16.3 percent of service members who died during that timespan were killed in action.

via ZeroHedge News http://bit.ly/2HXb5Pw Tyler Durden

Heavy Duty Truck Orders Collapse To Worst Numbers Since July 2016, Down 70% In May

A bloated backlog of Class 8 orders as a result of a euphoric mid-2018 continues to weigh on heavy duty truck orders in 2019.

Preliminary North America Class 8 net order data from ACT Research shows that the industry booked just 10,800 units in May, down 27% sequentially, but also lower by an astonishing 70% year-over-year. YTD orders are down 64% compared to the first five months of 2018. 

This chart shows the stunning difference between 2018 orders (black bars) and 2019 orders (red bars). 

Class 8 trucks, which are made by Daimler (Freightliner, Western Star), Paccar (Peterbuilt, Kenworth), Navistar International, and Volvo Group (Mack Trucks, Volvo Trucks), are one of the more common heavy trucks on the road, used for transport, logistics and occasionally (some dump trucks) for industrial purposes. Typical 18 wheelers on the road are generally all Class 8 vehicles, and traditionally are seen as an accurate coincident indicator of trade and logistics trends in the economy.

In addition, a follow up note from JP Morgan noted that Class 5-7 (medium duty) net new orders were down 21% YoY and down 19% sequentially. For May, net orders were 19,300 units, down 21% YoY and down 19% MoM. Despite these trends, JP Morgan still expects 2019 production of ~278,000 units (up 2% YoY).

Kenny Vieth, ACT’s President and Senior Analyst said: “Fraying freight market and rate conditions along with a still-large Class 8 order backlog contributed to the worst NA Class 8 net order performance since July of 2016. May saw NA Class 8 orders fall below the 15,900 units averaged through the year’s first trimester, and year-to-date Class 8 net orders have contracted 64% compared to the first five months of 2018.”

Speaking about the medium duty market, Vieth commented: “While the US manufacturing/freight economy has been droopy since late 2018, the medium-duty market continues to benefit from the underlying strength in the consumer economy. In May, NA Classes 5-7 net orders were 19,300 units, down 21% year-over-year and 19% from April. One has to look back 22 months to find a weaker medium-duty order month on an actual basis or just 2 months when looking at the data on a seasonally adjusted basis.”

In mid-May, we pointed out the dire picture for shipping for the rest of 2019.

The Cass Freight Index report for the month ended April 2019 painted a dire picture for freight heading into the end of the second quarter. The report said that “continued decline” in the freight index remains a concern, pointing out that shipments have fallen 3.4% year over year while expenditures have risen 6.2%. Sequentially on a monthly basis, shipments are down 0.3% while expenditures ticked up 0.7%. 


via ZeroHedge News http://bit.ly/2wGE2ci Tyler Durden

Examining The Discrepancy Between Jobs And Employment

Authored by Mike Shedlock via MishTalk,

In the past year, the BLS says the number of jobs rose by 2.62 million. Employment rose by 1.429 million.

The discrepancy between the increase in jobs and the increase in employment is 1,191,000. On average, over the past year, that’s a discrepancy of 99,250 every month, in favor of jobs.

Household Survey vs. Payroll Survey

The payroll survey (sometimes called the establishment survey) is the headline jobs number, generally released the first Friday of every month. It is based on employer reporting.

The household survey is a phone survey conducted by the BLS. It measures unemployment and many other factors.

Numbers in Perspective

  • In the household survey, if you work as little as 1 hour a week, even selling trinkets on eBay, you are considered employed.

  • If you don’t have a job and fail to look for one, you are not considered unemployed, rather, you drop out of the labor force. Searching want-ads or looking online for jobs does not count. You need to submit a resume or talk to a prospective employer or agency.

  • In the household survey, if you work three part-time jobs, 12 hours each, the BLS considers you a full-time employee.

  • In the payroll survey, three part-time jobs count as three jobs. The BLS attempts to factor this in, but they do not weed out duplicate Social Security numbers. The potential for double-counting jobs in the payroll survey is large.

These distortions and discrepancies artificially lower the unemployment rate, artificially boost full-time employment, and artificially increase the payroll jobs report every month.

Nonfarm Payrolls vs Employment

Over time, the numbers move in sync. There is no clear pattern around recessions. In many years the levels converge before a recession, but ahead of the great recession the numbers diverged.

Nonfarm Payrolls vs Employment Detail

In December of 2009 the difference between payrolls and employment was 8.21 million. This month, the difference is 5.56 million.

Since the lows in December of 2009, the BLS tells us employment rose by 18,632,000. The number of jobs rose by 21,291,000. That’s a difference of 2,659,000.

In the past year alone, the difference between jobs and employment is a whopping 1,191,000. That’s a discrepancy of 99,250 every month, in favor of jobs.

I strongly suggest double-counting of jobs by the BLS when people take extra part-time jobs or shift jobs.

For a closer look at today’s jobs report please see Jobs +263,000 vs. Employment -103,000: Unemployment Rate 3.6% Lowest Since 1969.

via ZeroHedge News http://bit.ly/2EU6VWK Tyler Durden

Stocks Slide As Trump Aide Confirms “Moving Toward Path” To Mexico Tariffs

US equity markets are giving up gains (or extending losses) after White House Deputy Comms Director Mercedes Schlapp said that they were moving toward the path of imposing tariffs on Mexico because they were not offering enough to avert them.

Small Caps and Trannies were already red and the rest of the majors are leaking lower now…

Also being reported is that negotiations with US and Mexico will continue in the afternoon without high officials, and House Ways and Means Committee chair Neal would introduce a resolution of disapproval if Pres. Trump declares tariffs as a national emergency. 

via ZeroHedge News http://bit.ly/2WqvN3p Tyler Durden

“It’s Hard To Be Optimistic” – Homeless Population Jumps In L.A. County To Nearly 59,000

A dramatic rise in homelessness has been reported in Los Angeles County — up 12% in 2018 to over 59,000 — is certainly an odd trend developing given “the greatest economy ever” and booming West Coast economies.

The epicenter of the homeless problem is in the city of Los Angeles, which saw a 16% jump to 36,300, the Los Angeles Homeless Services Authority (LHSA) said.

The LHSA said it assisted 21,631 people in getting off the street into permanent housing last year, a rate that would end the homeless crisis in a matter of years but economic deterioration has simultaneously pushed new families out of their homes.

People who couldn’t find permanent housing ended up in homeless encampments across the city.

“People are being housed out of homelessness and falling into homelessness on a continuous basis,” said Peter Lynn, the authority’s executive director.

Nearly 25% of those counted became homeless for the first time last year, and more than 50% of them mentioned financial stress was the culprit behind their homelessness, LHSA said.

Rising rents, a housing affordability crisis, largest ever wealth gap between rich and poor, deteriorating jobs market, and an economy cycling into a slowdown are some of the complex factors that have recently shifted tens of thousands of people onto the streets of Los Angeles.

“This data is stunning from the perspective that we had hoped that things would be trending differently, but we will not ignore our realities,” Los Angeles County Supervisor Mark Ridley-Thomas told CNN.

“No one can ignore the income insecurity, the financial stress that is being experienced throughout the population. … This is a state that is the wealthiest in the nation, and, at the same time, it is the most impoverished.”

Almost 75% of the homeless people counted lived outdoors, stoking fears of an expanding public health crisis that will certainly explode into the early 2020s.

Skid Row, an area of Downtown Los Angeles, is “ground zero” for the homeless crisis, where homeless encampments line the sidewalks. The smell of human waste permeates the air and violence is common, said Estela Lopez of the Downtown Industrial Business Improvement District.

Lopez said her group collects five to seven tons of garbage per day from the homeless.

County Supervisor Janice Hahn called the developing crisis “disheartening.”

“Even though our data shows we are housing more people than ever, it is hard to be optimistic when that progress is overwhelmed by the number of people falling into homelessness,” Hahn said.

Of those homeless people counted, 24% were millennials, and 7% were baby boomers.

Estimates show about 29% of the homeless counted were mentally ill or had substance abuse issues.

Two-thirds of the homeless on the streets of metro Los Angeles are male, less than one-third are female, and 2% had some other form of gender.

With an economic downturn nearing, Los Angeles County could see rates of homelessness dramatically increase into the early 2020s, overpowering local officials, and lead to a deepening of the public health crisis.

via ZeroHedge News http://bit.ly/2K7Wnrx Tyler Durden

Democrats Want The Post Office To Handle All Your Banking Needs

Authored by Mac Slavo via SHTFplan.com,

Imagine a bank with all the bureaucracy of the United States Post Office AND all the financial savviness of the U.S. government. If you like that idea, you’ll just love Democrats proposal to bank at your local post office.

Socialist lawmakers including U.S. Senator Bernie Sanders and U.S. Representative Alexandria Ocasio-Cortez want Americans to be able to visit their local post office for their banking needs, according to a report by Fox News. Oh, the future looks so bright for this country, huh?

Sanders, an independent from Vermont, and Ocasio-Cortez, a New York Democrat (both tyrannical socialists), see “postal banking” as a potential solution for the estimated 32.6 million U.S. households that are “unbanked” or “underbanked,” meaning they don’t have a checking or savings account and often turn to services like check cashing or payday loans that can harm them financially in the long term. But most of the “underbanked” have chosen to do so and won’t use the Post Office for banking even if leftists insisted.

The reasons most people choose not to use a bank would not be fixed by the Post Office, but amplified.  The Post Office is hardly in a position to become a bank because they lose so much money. The only reason it even exists is that it’s a government agency.  No business could operate like the Post Office and remain afloat.

Socialism has some horrible ideas, and while this one’s not up there with democide, it’s still pretty bad.

But still, socialists insist poor people should bank at the Post Office.  Perhaps Bernie Sanders should lead by example and use the Post Office as his primary bank.  But the multi-millionaire won’t do so, because he’s a hypocrite socialist.

But besides all these facts, this suggestion is stupid for statistical reasons as well. Market Watch reported that new research shows that only a small segment of the population lives closer to a post office than they do a bank, limiting the benefits postal banking could bring. Only about 20% of counties nationwide have more post office locations than they do bank branches, according to a recent study from Ken Tumin, founder of the banking website DepositAccounts, a subsidiary of LendingTree. And these counties are home to just 7.2 million people, roughly 7% of the country’s population. As for the number of counties that have a post office but no bank, the number is even smaller. This is true of roughly 1% of counties across the country and a mere 207,000 people, less than 1% of the nation’s population, live in them.

“Post offices are a less convenient option for most Americans,” Tumin wrote. “However, this fact does not mean the financial and banking needs of a substantial number of adults are well-served.” Besides, more and more people have access to a smartphone or the internet these days, and online banking is more readily available to a wider swath of the population, leading logical humans to question the need for postal banking as a solution.

The U.S. Postal Service is viewed as a good conduit for banking services in part because it already offers some financial services, including money orders and cashing of Treasury checks. There we go! So let’s get the government involved in banking like as they did with student loans.  Look how that turned out.  Only socialists can come up with ideas this completely and epically disastrous for civilization.

Let the government control your money! Look how good they are with the money they steal!

This isn’t a joke either, although it should be! There are actually politicians actively working to make this country look like Venezuela!

via ZeroHedge News http://bit.ly/2wBnceI Tyler Durden

Cummings’ Wife Funneled Money From Charity To For-Profit Company, Financials Reveal

The wife of House Oversight Chairman Elijah Cummings funneled hundreds of thousands of dollars from her charity into her for-profit organization, potentially deriving an “illegal private benefit” for the Washington power couple, reports the Daily Caller‘s Andrew Kerr.

The previously undisclosed cost-sharing arrangement between the two entities controlled by Maya Rockeymoore Cummings was detailed in audited statements obtained by Kerr

Maya Rockeymoore Cummings’s charity, the Center for Global Policy Solutions (CGPS), paid her for-profit venture, Global Policy Solutions LLC, over $250,000 in “management fees” between 2013 and 2015, according to the charity’s audited financial statements covering those years. The management fees were paid in addition to a cost-sharing agreement where the charity pays for its share of equipment, personnel and other expenditures. –Daily Caller

It’s self-dealing. It’s taking the charity’s resources and turning them into personal profits,” according to Tom Anderson in a statement to the Caller. Anderson is an investigator with the National Legal and Policy Center (NPLC), who added “IRS law doesn’t allow a charity for this purpose. This isn’t for the public interest, this is for her personal interest. You can’t do that.”

What’s more, according to a May 20 report in the Washington Examinercompanies which fund Cummings’s charity have interests before her husband’s Congressional committee

The NPLC filed a complaint with the IRS in May, claiming that Rockeymoore Cummings’s charity and LLC are potentially being used by companies to buy favorable treatment with Cummings

“The problem is there are millions of dollars coming into these entities from corporations and special interests with business before Elijah Cummings, and any time you have that, every rule has to be followed or else it opens the door for massive corruption,” said Anderson in a previous statement to the Caller

Others have questioned why Rockeymoore Cummings’s private company is charging a 5% management fee to her charity on top of an existing cost-sharing agreement

Charity Watch President Daniel Borochoff said the funds flowing from Rockeymoore Cummings’s charity from the 5% management fee is problematic given her husband’s regulatory authority over the business interests funding her charity.

“That connection could be made,” Borochoff said. “All the more reason to get rid of that 5% arrangement.”

“My advice to them: get rid of the percentage arrangement and pay the LLC for whatever work its performing, but also to do whatever it can to separate the for-profit from the nonprofit,” he added. –Daily Caller

And while cost-sharing agreements between charities and other entities may be common, according to Chicago attorney Sally Wagenmaker, the management fee Cummings is charging her own charity “raises a potential red flag.” 

The president of conservative watchdog group Capital Research Center agrees, adding “It’s a red flag for a powerful member like Elijah Cummings to have a family member receiving money from entities with issues before his powerful committee.” 

via ZeroHedge News http://bit.ly/2WpEfQo Tyler Durden