Britain’s recently resigned ambassador to the US vouched for the credibility of Christopher Steele – the former MI6 spy who cobbled together a Russian-sourced dossier full of fabrications about Donald Trump.
Photo via the Daily Mail
Sir Kim Darroch, who resigned after confidential memos were leaked in which he slammed President Trump and his administration, told a US official that Steele was “absolutely” legit, according to the Sunday Telegraph.
Today The Sunday Telegraph can also disclose that Sir Kim is said to have vouched for the credibility of Christopher Steele, the author of an explosive dossier of claims about Donald Trump’s ties to Russia, in conversation with at least one US official. Asked whether Mr Steele, a former MI6 officer, was “legit”, Sir Kim replied: “Absolutely”. His comments later appeared in the New Yorker magazine. –Sunday Telegraph
Of note, the suspected leaker has reportedly been identified, and a foreign state has been ruled out as the culprit.
Steele was commissioned by Fusion GPS to produce the infamous dossier ultimately paid for by the Hillary Clinton campaign and the DNC during the 2016 US election. It was later used to secure a FISA spy warrant on one-time Trump campaign aide Carter Page, and later used to smear the president in the court of public opinion.
Interestingly, a top official with the US Justice Department warned the FBI that Steele’s research was inaccurate and was likely biased due to its origins as an opposition research document. As we noted in May, ten days before the FBI used the now-discredited dossier to apply for a Foreign Intelligence Surveillance Act (FISA) warrant to spy on Trump campaign aide Carter Page, Steele met with Deputy Assistant Secretary of State Kathleen Kavalec, who took handwritten notes of the encounter.
Steele told Kavalec that Russia had a “technical/human operation run out of Moscow targeting the election,” which recruited US emigres to “do hacking and recruiting. Steele added that “Payments to those recruited are made out of the Russian consulate in Miami.”
Except that’s a lie – as Kavalec debunked the assertion in a bracketed comment: “It is important to note that there is no Russian consulate in Miami.“
Steele had also been flagged flagged for admitting that his research was political and facing an Election Day deadline, as his client was “keen to see this information come to light prior to November 8.”
Notes and testimony from senior Justice Department official Bruce Ohr make clear Steele admitted early on that he was “desperate” to get Trump defeated in the election, was working in some capacity for the GOP candidate’s opponent, and considered his intelligence raw and untested. Ohr testified that he alerted FBI and other senior Justice officials to these concerns in August 2016. –The Hill
Steele left his MI6 career to found his own company, Orbis Business Intelligence, with another former spy according to the Daily Mail.
via ZeroHedge News https://ift.tt/2JMnCFl Tyler Durden
Economists tell us that within the economy there is a lot of substitutability, and they are correct. However, there are a couple of not-so-minor details that they overlook:
There is no substitute for energy. It is possible to harness energy from another source, or to make a particular object run more efficiently, but the laws of physics prevent us from substituting something else for energy. Energy is required whenever physical changes are made, such as when an object is moved, or a material is heated, or electricity is produced.
Supplemental energy leverages human energy. The reason why the human population is as high as it is today is because pre-humans long ago started learning how to leverage their human energy (available from digesting food) with energy from other sources. Energy from burning biomass was first used over one million years ago. Other types of energy, such as harnessing the energy of animals and capturing wind energy with sails of boats, began to be used later. If we cut back on our total energy consumption in any material way, humans will lose their advantage over other species. Population will likely plummet because of epidemics and fighting over scarce resources.
Many people appear to believe that stimulus programs by governments and central banks can substitute for growth in energy consumption. Others are convinced that efficiency gains can substitute for growing energy consumption. My analysis indicates that workarounds, in the aggregate, don’t keep energy prices high enough for energy producers. Oil prices are at risk, but so are coal and natural gas prices. We end up with a different energy problem than most have expected: energy prices that remain too low for producers. Such a problem can have severe consequences.
Let’s look at a few of the issues involved:
[1] Despite all of the progress being made in reducing birth rates around the globe, the world’s population continues to grow, year after year.
Advanced economies in particular have been reducing birth rates for many years. But despite these lower birthrates, world population continues to rise because of the offsetting impact of increasing life expectancy. The UN estimates that in 2018, world population grew by 1.1%.
[2] This growing world population leads to a growing use of natural resources of every kind.
There are three reasons we might expect growing use of material resources:
(a) The growing world population in Figure 1 needs food, clothing, homes, schools, roads and other goods and services. All of these needs lead to the use of more resources of many different types.
(b) The world economy needs to work around the problems of an increasingly resource-constrained world. Deeper wells and more desalination are required to handle the water needs of a rising population. More intensive agriculture (with more irrigation, fertilization, and pest control) is needed to harvest more food from essentially the same number of arable acres. Metal ores are increasingly depleted, requiring more soil to be moved to extract the ore needed to maintain the use of metals and other minerals. All of these workarounds to accommodate a higher population relative to base resources are likely to add to the economy’s material resource requirements.
(c) Energy products themselves are also subject to limits. Greater energy use is required to extract, process, and transport energy products, leading to higher costs and lower net available quantities.
Somewhat offsetting these rising resource requirements is the inventiveness of humans and the resulting gradual improvements in technology over time.
What does actual resource use look like? UN data summarized by MaterialFlows.net shows that extraction of world material resources does indeed increase most years.
Figure 2. World total extraction of physical materials used by the world economy, calculated using weight in metric tons. Chart is by MaterialFlows.net. Amounts shown are based on the Global Material Flows Database of the UN International Resource Panel. Non-metallic minerals include many types of materials including sand, gravel and stone, as well as minerals such as salt, gypsum and lithium.
[3] The years during which the quantities of material resources cease to grow correspond almost precisely to recessionary years.
If we examine Figure 2, we see flat periods or periods of actual decline at the following points: 1974-75, 1980-1982, 1991, and 2008-2009. These points match up almost exactly with US recessionary periods since 1970:
Figure 3. Dates of US recessions since 1970, as graphed by the Federal Reserve of St. Louis.
The one recessionary period that is missed by the Figure 2 flat periods is the brief recession that occurred about 2001.
[4] World energy consumption (Figure 4) follows a very similar pattern to world resource extraction (Figure 2).
Figure 4. World Energy Consumption by fuel through 2018, based on 2019 BP Statistical Review of World Energy. Quantities are measured in energy equivalence. “Other Renew” includes a number of kinds of renewables, including wind, solar, geothermal, and sawdust burned to provide electricity. Biofuels such as ethanol are included in “Oil.”
Note that the flat periods are almost identical to the flat periods in the extraction of material resources in Figure 2. This is what we would expect, if it takes material resources to make goods and services, and the laws of physics require that energy consumption be used to enable the physical transformations required for these goods and services.
[5] The world economy seems to need an annual growth in world energy consumption of at least 2% per year, to stay away from recession.
There are really two parts to projecting how much energy consumption is needed:
How much growth in energy consumption is required to keep up with growing population?
How much growth in energy consumption is required to keep up with the other needs of a growing economy?
Regarding the first item, if the population growth rate continues at a rate similar to the recent past (or slightly lower), about 1% growth in energy consumption is needed to match population growth.
To estimate how much growth in energy supply is needed to keep up with the other needs of a growing economy, we can look at per capita historical relationships:
Figure 5. Three-year average growth rates of energy consumption and GDP. Energy consumption growth per capita uses amounts provided in BP 2019 Statistical Review of World Energy. World per capita GDP amounts are from the World Bank, using GDP on a 2010 US$ basis.
The average world per capita energy consumption growth rate in non-recessionary periods varies as follows:
All years: 1.5% per year
1970 to present: 1.3% per year
1983 to present: 1.0% per year
Let’s take 1.0% per year as the minimum growth in energy consumption per capita required to keep the economy functioning normally.
If we add this 1% to the 1% per year expected to support continued population growth, the total growth in energy consumption required to keep the economy growing normally is about 2% per year.
Actual reported GDP growth would be expected to be higher than 2%. This occurs because the red line (GDP) is higher than the blue line (energy consumption) on Figure 5. We might estimate the difference to be about 1%. Adding this 1% to the 2% above, total reported world GDP would be expected to be about 3% in a non-recessionary environment.
There are several reasons why reported GDP might be higher than energy consumption growth in Figure 5:
A shift to more of a service economy, using less energy in proportion to GDP growth
Efficiency gains, based on technological changes
Possible intentional overstatement of reported GDP amounts by some countries to help their countries qualify for loans or to otherwise enhance their status
Intentional or unintentional understatement of inflation rates by reporting countries
[6] In the years subsequent to 2011, growth in world energy consumption has fallen behind the 2% per year growth rate required to avoid recession.
Figure 7 shows the extent to which energy consumption growth has fallen behind a target growth rate of 2% since 2011.
Figure 6. Indicated amounts to provide 2% annual growth in energy consumption, as well as actual increases in world energy consumption since 2011. Deficit is calculated as Actual minus Required at 2%. Historical amounts from BP 2019 Statistical Review of World Energy.
[7] The growth rates of oil, coal and nuclear have all slowed to below 2% per year since 2011. While the consumption of natural gas, hydroelectric and other renewables is still growing faster than 2% per year, their surplus growth is less than the deficit of oil, coal and nuclear.
Oil, coal, and nuclear are the types of energy whose growth has lagged below 2% since 2011.
Figure 7. Oil, coal, and nuclear growth rates have lagged behind the target 2% growth rate. Amounts based on data from BP’s 2019 Statistical Review of World Energy.
The situations behind these lagging growth rates vary:
Oil. The slowdown in world oil consumption began in 2005, when the price of oil spiked to the equivalent of $70 per barrel (in 2018$). The relatively higher cost of oil compared with other fuels since 2005 has encouraged conservation and the switching to other fuels.
Coal. China, especially, has experienced lagging coal production since 2012. Production costs have risen because of depleted mines and more distant sources, but coal prices have not risen to match these higher costs. Worldwide, coal has pollution issues, encouraging a switch to other fuels.
Nuclear. Growth has been low or negative since the Fukushima accident in 2011.
Figure 8 shows the types of world energy consumption that have been growing more rapidly than 2% per year since 2011.
Figure 8. Natural gas, hydroelectric, and other renewables (including wind and solar) have been growing more rapidly than 2% since 2011. Amounts based on data from BP’s 2019 Statistical Review of World Energy.
While these types of energy produce some surplus relative to an overall 2% growth rate, their total quantity is not high enough to offset the significant deficit generated by oil, coal, and nuclear.
Also, it is not certain how long the high growth rates for natural gas, hydroelectric, and other renewables can persist. The growth in natural gas may slow because transport costs are high, and consumers are not willing/able to pay for the high delivered cost of natural gas, when distant sources are used. Hydroelectric encounters limits because most of the good sites for dams are already taken. Other renewables also encounter limits, partly because many of the best sites are already taken, and partly because batteries are needed for wind and solar, and there is a limit to how fast battery makers can expand production.
Putting the two groupings together, we obtain the same deficit found in Figure 6.
Figure 9. Comparison of extra energy over targeted 2% growth from natural gas, hydroelectric and other renewables with energy growth deficit from oil, coal and nuclear combined. Amounts based on data from BP’s 2019 Statistical Review of World Energy.
Based on the above discussion, it seems likely that energy consumption growth will tend to lag behind 2% per year for the foreseeable future.
[8] The economy needs to produce its own “demand” for energy products, in order to keep prices high enough for producers. When energy consumption growth is below 2% per year, the danger is that energy prices will fall below the level needed by energy producers.
Workers play a double role in the economy:
They earn wages, based on their jobs, and
They are the purchasers of goods and services.
In fact, low-wage workers (the workers that I sometimes call “non-elite workers”) are especially important, because of their large numbers and their role in buying many items that use significant amounts of energy. If these workers aren’t earning enough, they tend to cut back on their discretionary buying of homes, cars, air conditioners, and even meat. All of these require considerable energy in their production and in their use.
High-wage workers tend to spend their money differently. Most of them have already purchased as many homes and vehicles as they can use. They tend to spend their extra money differently–on services such as private education for their children, or on investments such as shares of stock.
An economy can be configured with “increased complexity” in order to save energy consumption and costs. Such increased complexity can be expected to include larger companies, more specialization and more globalization. Such increased complexity is especially likely if energy prices rise, increasing the benefit of substitution away from the energy products. Increased complexity is also likely if stimulus programs provide inexpensive funds that can be used to buy out other firms and for the purchase of new equipment to replace workers.
The catch is that increased complexity tends to reduce demand for energy products because the new way the economy is configured tends to increase wage disparity. An increasing share of workers are replaced by machines or find themselves needing to compete with workers in low-wage countries, lowering their wages. These lower wages tend to lower the demand of non-elite workers.
If there is no increase in complexity, then the wages of non-elite workers can stay high. The use of growing energy supplies can lead to the use of more and better machines to help non-elite workers, and the benefit of those machines can flow back to non-elite workers in the form of higher wages, reflecting “higher worker productivity.” With the benefit of higher wages, non-elite workers can buy the energy-consuming items that they prefer. Demand stays high for finished goods and services. Indirectly, it also stays high for commodities used in the process of making these finished goods and services. Thus, prices of energy products can be as high as needed, so as to encourage production.
In fact, if we look at average annual inflation-adjusted oil prices, we find that 2011 (the base year in Sections [6] and [7]) had the single highest average price for oil.1 This is what we would expect, if energy consumption growth had been adequate immediately preceding 2011.
Figure 10. Historical inflation-adjusted Brent-equivalent oil prices based on data from 2019 BP Statistical Review of World Energy.
If we think about the situation, it not surprising that the peak in average annual oil prices took place in 2011, and the decline in oil prices has coincided with the growing net deficit shown in Figures 6 and 9. There was really a double loss of demand, as growth in energy use slowed (reducing direct demand for energy products) and as complexity increased (shifting more of the demand to high-wage earners and away from the non-elite workers).
What is even more surprising is that fact that the prices of fuels in general tend to follow a similar pattern (Figure 11). This strongly suggests that demand is an important part of price setting for energy products of all kinds. People cannot buy more goods and services (made and transported with energy products) than they can afford over the long term.
Figure 11. Comparison of changes in oil prices with changes in other energy prices, based on time series of historical energy prices shown in BP’s 2019 Statistical Review of World Energy. The prices in this chart are not inflation-adjusted.
If a person looks at all of these charts (deficits in Figures 6 and 9 and oil and energy prices in general from Figures 10 and 11) for the period 2011 onward, there is a very distinct pattern. There is at first a slow slide down, then a fast slide down, followed (at the end) by an uptick. This is what we should expect, if low energy growth is leading to low prices for energy products in general.
[9] There are two different ways that oil and other energy prices can damage the economy: (a) by rising too high for consumers or (b) by falling too low for producers to have funds for reinvestment, taxes and other needs. The danger at this point is from (b), energy prices falling too low for producers.
Many people believe that the only energy problem that an economy can have is prices that are too high for consumers. In fact, energy prices seemed to be very high in the lead-ups to the 1974-1975 recession, the 1980-1982 recession, and the 2008-2009 recession. Figure 5 shows that the worldwide growth in energy consumption was very high in the lead-up to all three of these recessions. In the two earlier time periods, the US, Europe, and the Soviet Union were all growing their economies, leading to high demand. Preceding the 2008-2009 Great Recession, China was growing its economy very rapidly at the same time the US was providing low-interest rate rates for home purchases, some of them to subprime borrowers. Thus, demand was very high at that time.
The 1974-75 recession and the 1980-1982 recession were fixed by raising interest rates. The world economy was overheating with all of the increased leveraging of human energy with energy products. Higher short-term interest rates helped bring growth in energy prices (as well as food prices, which are very dependent on energy consumption) down to a more manageable level.
Figure 12. Three-month and ten-year interest rates through May 2019, in chart by Federal Reserve of St. Louis.
There was really a two-way interest rate fix related to the Great Recession of 2008-2009. First, when oil and other energy prices started to spike, the US Federal Reserve raised short term interest rates in the mid 2000s. This, by itself, was almost enough to cause recession. When recession started to set in, short-term interest rates were brought back down. Also, in late 2008, when oil prices were very low, the US began using Quantitative Easing to bring longer-term interest rates down, and the price of oil back up.
Figure 13. Monthly Brent oil prices with dates of US beginning and ending Quantitative Easing.
There is one recession that seems to have been the result of low oil prices, perhaps combined with other factors. That is the recession that was associated with the collapse of the central government of the Soviet Union in 1991.
[10] The recession that comes closest to the situation we seem to be heading into is the one that affected the world economy in 1991 and shortly thereafter.
If we look at Figures 2 and 5, we can see that the recession that occurred in 1991 had a moderately severe effect on the world economy. Looking back at what happened, this situation occurred when the central government of the Soviet Union collapsed after 10 years of low oil prices (1982-1991). With these low prices, the Soviet Union had not been earning enough to reinvest in new oil fields. Also, communism had proven to be a fairly inefficient method of operating the economy. The world’s self-organizing economy produced a situation in which the central government of the Soviet Union collapsed. The effect on resource consumption was very severe for the countries most involved with this collapse.
Figure 14. Total extraction of physical materials Eastern Europe, Caucasus and Central Asia, in chart by MaterialFlows.net. Amounts shown are based on the Global Material Flows Database of the UN International Resource Panel.
World oil prices have been falling too low, at least since 2012. The biggest decreases in prices have come since 2014. With energy prices already very low compared to what producers need, there is a need right now for some type of stimulus. With interest rates as low as they are today, it will be very difficult to lower interest rates much further.
Also, as we have seen, debt-related stimulus of is not very effective at raising energy prices unless it actually raises energy consumption. What works much better is energy supply that is cheap and abundant enough that supply can be ramped up at a rate well in excess of 2% per year, to help support the growth of the economy. Suitable energy supply should be inexpensive enough to produce that it can be taxed heavily, in order to help support the rest of the economy.
Unfortunately, we cannot just walk away from economic growth because we have an economy that needs to continue to expand. One part of this need is related to the world’s population, which continues to grow. Another part of this need relates to the large amount of debt that needs to be repaid with interest. We know from recent history (as well as common sense) that when economic growth slows too much, repayment of debt with interest becomes a problem, especially for the most vulnerable borrowers. Economic growth is also needed if businesses are to receive the benefit of economies of scale. Ultimately, an expanding economy can be expected to benefit the price of a company’s stock.
Observations and Conclusions
Perhaps the best way of summing up how my model of the world economy differs from other ones is to compare it to popular other models.
The Peak Oil model says that our energy problem will be an oil supply problem. Some people believe that oil demand will rise endlessly, allowing prices to rise in a pattern following the ever-rising cost of extraction. In the view of Peak Oilers, a particular point of interest is the date when the supply of oil “peaks” and starts to decline. In the view of many, the price of oil will start to skyrocket at that point because of inadequate supply.
To their credit, Peak Oilers did understand that there was an energy bottleneck ahead, but they didn’t understand how it would work. While oil supply is an important issue, and in fact, the first issue that starts affecting the economy, total energy supply is an even more important issue. The turning point that is important is when energy consumption stops growing rapidly enough–that is, greater than the 2% per year needed to support adequate economic growth.
The growth in oil consumption first fell below the 2% level in 2005, which is the year some that some observers have claimed that “conventional” (that is, free flowing, low-cost) oil production peaked. If we look at all types of energy consumption combined, growth fell below the critical 2% level in 2012. Both of these issues have made the world economy more vulnerable to recession. We experienced a recession based on prices that were too high for consumers in 2008-2009. It appears that the next bottleneck may be caused by energy prices that are too low for producers.
Recessions that are based on prices that are too low for the producer are the more severe type. For one thing, such recessions cannot be fixed by a simple interest rate fix. For another, the timing is unpredictable because a problem with low prices for the producer can linger for quite a few years before it actually leads to a major collapse. In fact, individual countries affected by low energy prices, such as Venezuela, can collapse before the overall system collapses.
While the Peak Oil model got some things right and some things wrong, the models used by most conventional economists, including those included in the various IPCC reports, are far more deficient. They assume that energy resources that seem to be in the ground can actually be extracted. They see no limitations caused by prices that are too high for consumers or too low for producers. They do not realize that affordable energy prices can actually fall over time, as the economy weakens.
Conventional economists assume that it is possible for politicians to direct the economy along lines that they prefer, even if doing so contradicts the laws of physics. In particular, they assume that the economy can be made to operate with much less energy consumption than is used today. They assume that we collectively can decide to move away from coal consumption, without having another fuel available that can adequately replace coal in quantity and uses.
History shows that the collapse of economies is very common. Collectively, we have closed our eyes to this possibility ever happening to the world economy in the modern era. If the issue with collapsing demand causing ever-lower energy prices is as severe as my analysis indicates, perhaps we should be examining this scenario more closely.
via ZeroHedge News https://ift.tt/2LQTtqY Tyler Durden
Equal pay for women has been a roaring issue during the Women’s World Cup, reaching its peak when, during the U.S. women’s national team’s victory parade, fans began chanting “e-qual pay”to the same rhythm as the ever-popular “U-S-A.”
This is nothing new.
WNBA players have been demanding equal pay to their male counterparts for years, despite the fact that every team in the NBA is valued at over $1 billion while the entire WNBA has lost at least $10 million every year since its inaugural season. This is untrue. Meritocracy is not the answer.
The Women’s World Cup is no different. When the French men’s team won the FIFA World Cup in 2018, it was paid a hefty $38,000,000. The U.S. women’s team won just $4,000,000 upon its victory. This must be wrong! Women are earning only 10.5 percent of what men earn for the same sport!
Well, maybe not.
The Men’s World Cup generated north of $6,000,000,000 of revenue in 2018, while the Women’s World Cup generated only $131,000,000 in 2019, just over two percent of the men’s revenue. Wait, but the women’s victory payment was 10 percent that of their male counterparts. So women, in terms of percentage of revenue, earned more than men. At first glance it’s unfair in favor of the men, it seems it is actually unfair against men.
We may be tempted to say that Megan Rapinoe does not understand economics.
On Wednesday morning, Megan Rapinoe appeared on CNN and was asked what fans could do to support equal pay. The answer most were probably expecting is along the lines of “Go to your local congressman or congresswoman” or “Keep fighting and never give up” – you know, the typical athlete-activist answers. Rapinoe’s answer was nothing of the sort. She responded:
“Fans can come to games. Obviously, the national team games will be a hot ticket, but we have nine teams in the NWSL. You can go to your league games, you can support that way. You can buy players’ jerseys, you can lend support in that way, you can tell your friends about it, you can become season ticket-holders. I think in terms of that, that’s the easiest way for fans to get involved.”
So, when asked about how fans can support the fight for equal pay, Rapinoe basically said that fans could pay them more. In other words, the answer is market and promotion. Rapinoe implicitly understands that she is being paid her market value, and she obviously understands how the market operates in women’s soccer. So why is she leading a political movement at all? This is perplexing, to say the least. Now, it appears that Rapinoe actually does understand economics, she is just choosing to ignore it in favor of pushing a political agenda.
The U.S. women’s national soccer team has done the incredible. Back-to-back World Cups is no small feat, and the entire country should have enormous pride in what the team has done. Sadly, the victory has been overshadowed by politics, as it should have nothing to do with politics at all.
Why can’t we talk about their accomplishments without the mention of equal pay or gender inequality? Players like Rapinoe should not pick and choose when to think economically and when not to, and there is no reason for any of this nonsense to shroud the incredible accomplishments of the women’s national team.
The market will always be in effect.
via ZeroHedge News https://ift.tt/2xMe1IO Tyler Durden
Having flirted with breaking above 3,000, the S&P finally rose above the key psychological barrier last week, and seems poised to keep rising thanks to the Fed’s signaling of unconditional rate cuts, as equity markets continue to price in a repeat of the 1995/1998 insurance-rate-cuts scenario with even greater confidence (although as noted earlier, Morgan Stanley steadfastly believes markets are wrong for the third time). However, with the prevailing narrative now that of “insurance” cuts, this – as JPM’s Nikolas Panigirtzoglou writes – also assumes that central banks follow the script of 1995/1998 and at the minimum validate market expectations.
What if these assumptions are wrong?
The answer to that question ties in with the question posed by Panigirtzoglou in his latest Flows and Liquidity weekly, which seeks to answer “how much equity upside should we expect in this bullish scenario where the Fed cuts its policy rate by 75bp this year to provide insurance against downside risks similar to what happened in 1995/1998?“
As JPM reminds us, on both prior “insurance” cut occasions, the Fed had over-delivered both in terms of the speed and magnitude of rate cuts, to wit:
In 1995, a month before the first cut, rate markets were pricing around 60bp of rate cuts over 12 months and the Fed delivered 75bp over six months.
In 1998, a month before the first cut, rate markets were pricing around 40bp of rate cuts over 12 months and the Fed delivered 75bp over three months.
In other words, the Fed over-delivered relative to market expectations in both cases and re-steepened the curve, which is a test for the current conjuncture. Will the Fed again overdeliver relative to expectations as in 1995 and 1998 and re-steepen the curve?
In its attempt to answer the key question, and its assessment of what the remaining “potential equity market upside” from here is, JPM opts to focus on an alternative methodology based on position metrics, instead of historical comparisons to 1995/1998 or valuation-related methodologies. In particular, Panigirtzoglou resorts to his previous analysis on cash, bond and equity allocations of non-bank investors globally, in which he compares global M2 with the equities and bonds held by non-bank investors.
Why is global M2 important? Because it reflects the cash balance of non-bank investors, such as households, corporations, pension funds, insurance companies and SWFs. This distinction is important because more than half of fixed income securities are held by central banks, including FX reserve manager, and commercial banks.
According to JPM’s calculations, and by excluding banks – entities that typically invest in bonds rather than equities – the amount of bonds held by the rest of the world, i.e. non-bank entities, is around $32tr. This compares to $55tr of cash and $67.5tr of equities based on DataStream’s global equity index universe. That means that non-bank investors, which invest in both bonds and equities globally, have an implied allocation to bonds of 20.8% currently. This 20.8% bond allocation is above the post Lehman historical average and well above the 19% low seen in September last year. In other words the past months’ bond rally has more than unwound the large bond underweight that had emerged in September last year.
Meanwhile, the mirror image of this unwinding of the previous bond underweight is that the current equity overweight is smaller from that seen in September last year, which at 45.5% represented a post-Lehman high at the time. So, despite equity markets making new highs, investors are not as OW in equities as they were last September simply because bond markets rallied strongly in recent months making them less UW in bonds. Effectively, the past months’ bond rally has been boosting equities by creating more room for investors to increase their equity allocations, something we discussed in parsing the potential for a pension fund driven meltup at the end of last quarter.
This is shown in the chart below which shows that investors globally have an allocation to equities of 43.6% currently, which is somewhere in between the post-Lehman high of 45.5% seen last September and the recent low of 41.8% seen last December.
As the JPM strategist notes, it is important to emphasize that relative to longer term history, this 43.6% represents an overweight equity allocation as it is not only above both the 40% post-Lehman average and the 43% longe-rterm historical average.
It is worth noting that in JPM’s opinion the post-Lehman historical averages are likely more relevant in terms of gauging the magnitude of OWs or UWs, for the following reason:
It is true that in previous cycles the trough in bond allocations has been lower than current levels, and the peak in equity allocations higher. While allocations could theoretically approach their previous cyclical extremes, we would make two observations on why these previous levels are less likely to be achieved.
The first is that since the previous two cycles already, the cyclical peak in equity allocations had been declining, and the cyclical trough in bond allocations had been rising, likely reflecting structural changes over time. Given the structural changes in markets and economies in the post-Lehman environment, this suggests to us that post-Lehman period comparisons are more relevant.
The second observation is that G4 central banks would have to shift to even more aggressive QE programs going forward than those seen over the past decade, in order to induce the non-bank private sector to shed even more bonds from here. That would require aggressive QE by not only the ECB but also the Fed, something that seems unlikely right now.
With this in mind, Panigirtzoglou writes that “one simple way of thinking about the upside for equities from here is to calculate the rise in equity prices needed for investor to become as OW in equities as they were last September.”
As such, and according to JPM’s calculations, global equities would need to rise by 7.9% from here, all else equal, to make investors as OW in equities as last September. In other words, assuming no change in bond valuations from here, any upside for equities should be limited to high single digits.
And while a bearish Morgan Stanley would be puking blood at this point, the JPM strategist – traditionally the most bearish of his bank’s peers – is similarly skeptical that such a spike is possible, and notes that “this equity upside is facing challenges”, of which the following two stand out:
One challenge is a bond selloff. This could emerge as a result of an overhang of long duration positions combined with a rise in bond volatility, a decline in bond liquidity and strong bond supply, “all of which create significant risk of a bond market correction going forward.”
Another challenge is the Fed under-delivering. The above technical factors are not the only potential cause of a bond market correction, which could also happen “because central banks fail to follow the script of 1995/1998 and under deliver vs. market expectations or because economic data such as manufacturing PMIs start recovering over the coming months.” Yes, the risk to stocks is that the economy, gasp, recovers.
Of course, as Q4 of 2018 demonstrated all too vividly, whatever the trigger, any bond selloff would be problematic for equities, and at the minimum it would mechanically in this simple framework reduce the 7.9% upside estimated above. Specifically, a reversal of the bond rally since May would reduce this estimated 7.9% upside from 7.9% to 5.2%.
* * *
One final point made by Panigirtzoglou is to debunk the widely popular, if also widely inaccurate, argument that “bears are everywhere”, which the bulls use as a contrarian indicator to argue for a continued equity melt up.
Well, as with most widely accepted conventions, this one, too, is wrong, and the JPMorgan strategist finds little support for the idea that there are prevalent equity underweights and “bears everywhere”. First, as shown above, investors globally are overweight equities especially compared with the post-Lehman period.
Second, the June performance by hedge funds and other institutional investors points to above average rather than below average equity positions. This is shown in the next chart which depicts the performance of various types of investors against benchmarks. Equity Long/Short hedge funds which represents the most important equity hedge fund universe produced a return of 3.2% in June according to HFR and 9.5% in H1, with the two largest L/S sub-categories (accounting for more than half of total L/S hedge fund AUM) fundamental growth and fundamental value returning 3.9% and 3.5% in June, respectively. This implies a beta at or higher than 0.5, which is the historical average relative to the MSCI AC World index.
What this means, said simply, is that Equity Long/Short hedge funds would struggle to produce such returns if they were underweight equities.
Other investor classes, as also discussed earlier, had notably higher market betas: risk parity funds produced a return of 4.7% in June and 13.4% in H1 beating their benchmark. And CTAs produced a very strong return in June likely benefiting from long positions in both equities and bonds. This is consistent with JPM’s trend-following framework which suggests that CTAs are currently pretty long in both bond and equity futures. It is also consistent with the new highs seen in the spec positions of US equity futures by asset managers and leveraged funds (Chart below).
Notably, these equity futures positions are even higher than last September, which to JPM is evidence suggesting little support for the “Bears everywhere” thesis.
In summary, Panigirtzglou concludes that his position-based analysis “points to limited upside for equities from here even if the 1995/1998 insurance-rate-cuts scenario plays out over the coming months” and, worse, “any equity upside would become even more limited if bond markets fail to sustain their H1 gains.”
via ZeroHedge News https://ift.tt/32qKToP Tyler Durden
The United States of America seems to have a suicide wish as it wanders aimlessly down a continually narrowing path that can only lead to national ruin. Is this a premeditated act of self-annihilation or simply a series of foolish choices?
Before a nation can be effectively destroyed from within it is necessary first that it be owned lock, stock and barrel. An independent, freedom-loving people are less easily controlled than one that is effectively ball and chained, which brings us to the first step in the program.
1. Create a Central Bank
Beginning around 1910, representatives from the leading banking powerhouses – Morgan, Rockefeller, Rothschild, Warburg and Kuhn-Loeb – began meeting in secret at distant retreats, and not for the purpose of philandering with underage girls, mind you. No, these elitists had a totally different sort of crime up their sleeves, and that was to dominate the entire US banking system. And would it really surprise anyone that they succeeded? This was achieved by the passage of the Federal Reserve Act, signed into law by President Woodrow Wilson on Dec. 23, 1913, which took away the constitutional power “to coin money, regulate the value thereof,” as enacted by the US Constitution.
As Anthony C. Sutton summed up the dire situation in his book, The Federal Reserve Conspiracy, “Congress handed over all monetary powers to the Fed in 1913. The Fed is a private bank, owned by banks, and pays dividends on its shares owned only by banks. The Fed is a private Bankers’ Bank.”
Today, the power of ‘printing money’ rests with a private corporation. In fact, the Fed is not actually in the business of printing currency, which is handled by Treasury; instead, it creates bank deposits which are stored at the Fed. This ‘legal’ banking cartel, which can manipulate inflation at will, never has to deal with serious competition, least of all from the US government. Indeed, crotchety Uncle Sam depends on this institutionalized ‘lender of last resort’ for his money supply, which he must return – with excessive interest – thus guaranteeing America’s eternal indebtedness, or until the country simply goes broke.
There were many honorable politicians who fought stringently against the Federal Reserve, before and after the money monster came into being. One of the most memorable challenges came on February 12, 1917 from Senator Charles Lindbergh, who attempted to open articles of impeachment against the ‘conspirators’ of the Act.
Lindbergh accused a number of banking executives of conspiring with each other to “devise a means through social, political and other ways of strategy and by chicanery, to deceive the people of the United States, the Congress, and the President of the United States for the purpose and with the object to secure an act of Congress providing a new monetary and banking system …”
The entire congressional exchange, which is a fascinating read, can be found here.
Today, the problem of an outside agency regulating the US money supply remains as serious an issue as it was in Lindbergh’s day.
This month, Donald Trump harshly criticized the Fed, calling it the “most difficult problem” facing the nation. He was particularly incensed with the independent central bank keeping interest rates high, a move that other leaders before Trump have also expressed frustration over.
Is it too late to ‘end the fed,’ as former US Senator Ron Paul recommended in his 2009 book? Or will it continue to be business as usual for the bankers?
….As well as we are doing from the day after the great Election, when the Market shot right up, it could have been even better – massive additional wealth would have been created, & used very well. Our most difficult problem is not our competitors, it is the Federal Reserve!
Ever since the passage of the Immigration and Nationality Act of 1965, legislation that has single-handedly altered the face of America forever, the United States has become a cauldron, not a salad bowl, of cultural and ethnic differences. Once a nation largely comprised of European immigrants, that demographic is expected to become the minority in a few short decades. And the people just keep coming.
Today, it is automatically assumed that because America got its start as a ‘nation of immigrants’ that it is somehow expected to keep its doors open forever. We are expected to forever comply with the words of the poem, ‘The New Colossus’, written by the Jewish-American Emma Lazarus, engraved on the pedestal of the Statue of Liberty, which says:
“Give me your tired, your poor, Your huddled masses yearning to breathe free, The wretched refuse of your teeming shore. Send these, the homeless, tempest-tossed to me, I lift my lamp beside the golden door!”
It seems the shelf life of that verse expired a long time ago. California can barely take care of San Francisco, let alone America taking care of the world’s “wretched refuse.” Perhaps we would do better than to worry about some tarnished Civil War-era statues of dead Southern generals and think more about editing that plaque.
Yet mass legal migration into the country is no longer considered enough. Even the very concept of a border wall or fence has been derided as “racist,” a grand “monument to white supremacists,” by the radical left.
No nation can last forever when its front door is open to every stranger under the sun.
3. Push Feminism, the Pill and Abortion
In 1960, with the advent of reliable contraception known as “the Pill,” followed up later with nationwide Planned Parenthood abortion clinics, American society entered upon one of its greatest revolutions of all time. Women, now free to engage in noncommittal sexual relations without fear of unwanted pregnancy, celebrated their emancipation by, yes, entering the workforce. But since there were dishes piling up in the sink and hungry mouths to feed, newly radicalized feminists, seeing males as nothing more than nails that need constant pounding, demanded ‘equal rights’ across the board.
Needless to say, this overnight overhaul of longstanding social norms spelt disaster for the family unit. Divorce rates and single-parent households exploded as men and women, now more concerned with career advancement than marriage commitment, seemed more distant from each other than ever before.
Camille Paglia, the American ‘anti-feminist feminist’ academic, has critiqued that part of feminist ideology that has turned men and women into enemies at worst, strangers at least.
“At this point it’s turned into a neurosis,” Paglia said in a 2017 interview.
And just like that, the two most fundamental relations – that between man and woman – have become almost irreparably damaged, while the greatest victims are American society and the all-important family unit.
4. Supersize the military
No other nation state or empire in history has had a greater global military footprint than the United States. But that vast presence – with an estimated 800 bases in 80 countries worldwide – does not necessarily equate to power. In fact, it may be the ultimate source of weakness, the veritable Achilles heel of US strength.
At the pinnacle of its power, the Roman Empire stretched from the Atlantic Ocean all the way to the Euphrates River. Yet, as the Romans discovered the hard way, maintaining such an extensive network requires vast amounts of resources, both physical and financial. Today, whereas more isolationist countries, like Russia and China, have chosen not to travel abroad in search of monsters to destroy (with Russia’s decision to go after Islamic State in Syria as the notable exception), this has allowed them to maintain approximate parity with the US military, and despite the latter’s much higher rate of spending. It could be argued that the United States is too preoccupied with taking out “seven countries in five years,” to quote General Wesley Clark, that it risks falling behind on technological development.
To understand how much the US spends on its military, former US Secretary of Defense Donald Rumsfeld announced on September 10, 2001 that the Pentagon could not trace over 2 trillion dollars in its coffers. How is that remotely possible? Considering that the US national debt now stands at 22.5 trillion dollars, Rumsfeld revealed a level of corruption – for what else could it be – that simply cannot be sustained over the long haul. And with the next financial crisis predicted to be possibly worse than the last, the most dramatic and unexpected effect from such an event could realistically be the US military going into a quick retreat across the planet for simple lack of resources. Whether that would be a blessing in disguise or the precursor to global pandemonium is anyone’s guess. In any case, to believe for a second that the United States can forever stay one step ahead of excessive spending and corruption just because it has a Central Bank to bail it out may prove to be the greatest fallacy of modern times.
5. Promote transgender lifestyles – to children
Personally, like most people, I’ve got no problem with people choosing whatever sexual lifestyle they desire. My only requirement is that they either keep it in the bedroom or get a hotel room. Pretty simple. In these days of sexual oversaturation, however, when the LBGTQ community has been designated an entire month to celebrate their sexual proclivities on the street, while the straight, child-producing majority is essentially ostracized and even linked to – wait for it – “white nationalists,” then it’s safe to say, ‘Houston, we’ve got a problem’.
Today, innocent children as young as five and six years old, still in kindergarten, are being exposed to discussions on transgender issues without their parents’ approval. In March, for example, the Washington Post reported – very supportively, by the way – that kindergarten students in Arlington, Virginia were told stories by a transgender advocate.
“I have a girl brain but a boy body. This is called transgender. I was born this way,” the advocate, Sarah McBride, read to the students from a storybook.
Is this really an appropriate topic of discussion for children, many of whom still believe in Santa Claus? My personal take is that this ‘education’ amounts to a form of pedophilia and should be outlawed across the country through federal legislation. After all, such incredibly complicated conversations would be considered risqué for many high schools, and even college students, to say nothing about kindergarten kids. Having written previously on this topic at length, I can avow that this is just the first stage of the madness. Next comes the chance that some misguided or confused child will get it into their head – possibly due to the subtle influence of something they’ve heard on television, from their parents or in the classroom – that they ‘identify’ with the opposite sex. Heaven forbid that a boy should play with a baby doll, or a girl participate in a game of football!
Now should the parents take their child to a counselor, it is now standard medical practice that the child not be provided psychotherapy. I repeat, not be provided psychotherapy. Instead, the medical practitioner must accept the child’s claim at face value that they really are the opposite sex. In fact, this is now law. This bit of mischief at the child’s expense is called “affirmative care,” despite the fact that nothing has been ‘affirmed’ at this point except that the medical community has lost its mind. From here the fun and games really begin.
“Once the teenage years begin, affirmative care means giving young people cross-sex hormones,” one mother, Elaine, said during a panel discussion on ‘transitioning,’ organized by the Heritage Foundation. “Girls as young as twelve are prescribed testosterone for lifetime usage, while boys are given estrogen. These are serious hormonal treatments that impact brain development, cardiovascular health and may increase the risk of cancer.”
Further ‘treatment’ involves puberty-blocking drugs, mastectomies, vaginal surgery and even fake penises; these are just some of the radical experimental methods being used on children with irreversible life-changing procedures.
Can a society that condones such inhumane treatment of its most vulnerable members survive? It is the opinion here that it cannot. Playing such mind games with impressionable children, and then attempting to turn them into the opposite sex with lifelong use of drugs, coupled with surgical procedures is the very definition of insanity. With all due respect for transgender people, children should not be introduced to questions of a sexual nature until they are considered legal adults.
6. Bury your national history over PC lunacy
The one inviolable aspect of every country is, or should be, its history. This documented record of accumulative deeds and acts, performed by various personalities, is the very foundation stone of any nation. Without it, the country will quickly lose its identity and purpose. Yet that is exactly what is being allowed to happen in the United States, where raw emotions are now king. Whatever alleged victim group screams the loudest over some alleged wrong is declared the winner in this never-ending Olympics of the Emotionally Impaired.
What is now happening is that American history is in the process of being rewritten according to the dictates of what is considered to be ‘politically correct’. Don’t believe it? You don’t need to watch Civil War statues tumbling into the dirt for proof. Just perform a quick Google search on ‘American inventors.’ What appears at the top, in the scrolling bar? Just two inventors of European ancestry are listed in the top ten. No Henry Ford, no Steve Jobs, no Wright Brothers, not even an Albert Einstein. That is no mistake. Yet the people at Google will blame it on the algorithms, of course, as if nobody has been performing searches for ‘Einstein’ or ‘Tesla’ or ‘Ford’ to warrant these individuals their rightful place in the selection. Is ‘machine learning’ really that stupid?
If there is an equivalent in America to Orwell’s ‘Ministry of Truth,’ that place would have to be Silicon Valley, where Liberal-oriented employees are quietly determining what is worthy of public attention and what is not. More often than not, it seems, the conservative right always gets the haircut. This internal slant has already been revealed by Google insiders, like James Damore, the former Google employee who circulated a memo describing the company’s “ideological echo chamber” that actively works to discriminate against conservatives, Whites and men.
More recently, Project Veritas, an investigative group of journalists led by James O’Keefe, captured a former Google executive admitting that the company is working to prevent another ‘Trump situation’ from occurring in 2020.
Today, with Google in the driver’s seat as far as the nation’s history, identity and future is concerned, it has the power to create whatever reality it sees fit. Increasingly, it seems the reality it is giving the American people no longer stands up to the facts. This power, perhaps more than any other, is enough to lead the country astray by simply forgetting who it is and what it stands for. After all, it only takes one generation to ‘reboot’ the national memory.
At that point, it’s game over, your country is history.
via ZeroHedge News https://ift.tt/2XUmJ2E Tyler Durden
Authored by Mike Wilson, chief equity strategist at Morgan Stanley
Breaking Out Is Hard To Do
For the past 18 months our call on US equities has been very consistent. After a massive bull run from April 2013 to January 2018, we suggested the US equity market was about to enter a multi-year consolidation during which the S&P 500 would trade in a wide range between 2400-3000. Since then, that range has defined the price action well with the lows in December coming in around 2350 and several attempts at 3000 on the upside that ultimately failed. We now find ourselves at the upper end of that resistance level once again, as shown in Exhibit 1. Just like in January and September last year, there appears to be growing excitement about the possibility of a break out above 3000.
Each successive attempt to break out over the past 18 months has been for different reasons.
In January 2018, it was about the tax cuts and the extremely positive impact that had on earnings revisions for 2019 and beyond. We argued at the time that the market had already discounted these ensuing revisions back in December, with the highest P/E multiple and lowest equity risk premium on the S&P 500 witnessed since the late 1990s. Indeed, the equity market promptly rejected that first attempt at 3000 with the most dramatic jump in equity volatility since the global recession in 2015.
After a grinding recovery during the spring and summer with a distinctly more defensive leadership, the S&P 500 tried to break out above 3000 once again in September. That time, we warned that higher real interest rates might prove to be the kryptonite for this bull to break out above our pre-determined range. Sure enough, during 4Q, it was the expensive high-multiple growth stocks that took it on the chin, proving once again that valuation does matter, even if the fundamentals are strong.
Of course, interest rates have fallen a long way since then, something our rates strategy team forecasted last fall. While this decline in interest rates has made US stocks more attractive on valuation, the fundamentals are no longer strong. Therefore, despite the marginal break above 3000 this past week, we expect another failure near the sloping red line in Exhibit 1 that connects the two prior highs last year.
The catalyst this time will be the disappointment from growth slowing further toward outright negative numbers on a year-on-year basis, in earnings and maybe even the economy. From our lens, the incoming data clearly show that growth has slowed much more than what the consensus expected this year, yet forecasts remain optimistic for a resurgence in the second half and into 2020.
We remain of the view that the consensus S&P 500 earnings forecasts are still materially too high for both the second half of 2019 and 2020 and that the Fed’s recent signaling of a cut later this month should not be celebrated if it is accompanied by an earnings, and possibly an economic recession in the US.
History is clear on this one. If this is the beginning of a full-blown rate-cutting cycle by the Fed in an attempt to ward off a recession à la 1990, 2001 or 2008, stocks typically don’t do well after the first cut. On the other hand, if the cut is not associated with a further slowdown, but a reacceleration or stabilization in growth, then equity markets have a chance to move higher and finally break above 3000 on a sustained basis.
The consensus appears to be in the latter camp and we remain in the former. This isn’t the first time we’ve been out of consensus over the past year as we approached these levels. The first two times our skepticism proved to be right. We’ll soon find out if breaking out is still hard to do. Have a great Sunday.
via ZeroHedge News https://ift.tt/2XEUTMm Tyler Durden
The complications associated with obesity are tragic and expensive and they have a direct effect on all consumers in a number of ways. Excess weight relative to one’s height is medically linked with early death, heart disease, diabetes, and practically all maladies. Across pretty much all cultures across the globe, obesity is associated with early death.
With these medical consequences of obesity in mind, it’s particularly troubling to note that in the United States, it is on the rise. According to the Centers for Disease Control (CDC), their most recent estimate is that 30.1% of adults are obese as of 2017. The obesity rate in the United States has doubledsince 1990 when 15% of the population was classified as obese. Further, estimates for the costs of obesity range from $147 billion to nearly $210 billion per year. As consumers, we’re footing the bill.
Along with Priceonomics customer ConsumerProtect.org, we thought we’d dig further into this obesity data in the United States and find out which states have the highest rates of obesity and which have the lowest? Where is it increasing the fastest and are there any states that are curbing the problem? And relatedly, which states have the best and worst eating habits and exercise regimes?
We found that West Virginia has the highest obesity rate in the nation while Colorado has the lowest rate. Many of the states with high obesity levels also rank poorly for exercise (Kentucky) and Unhealthy Eating (Mississippi).
***
The CDC defines obesity based on the Body Mass Indicator (BMI) scale and relates one’s height with weight. For adults, a BMI of over 30 qualifies as obese. Put more tangible, for someone who is 5 foot, 9 inches, and weighs 203 pounds or more qualifies as obese. The CDC publishes a number of obesity-related statistics for adults and adolescents segmented at the state level. This data was most recently updated in 2017, which is the data set we used in this analysis.
To start, let’s look at which states have the highest and lowest rates of obesity among adults. The following chart shows the percentage of the population in each state that is classified as obese, sorted from highest to lowest.
The state with the highest levels of obesity in America is West Virginia. Unfortunately, the state with the highest levels of obesity also has the highest diabetes rate in the country and ranks poorly on other health metrics that often accompany obesity. West Virginia just beat out Mississippi, the state with the second highest obesity rate in the country. Mississippi ranks as the state with the lowest life expectancy in America.
On the flip side of the coin, Colorado has the healthiest population in the United States, as measured by body mass index. Just 22.6% in Colorado qualify as obese, approximately 40% less than in West Virginia. The proximity to beautiful outdoors and better eating habits in Colorado result in the lowest BMI scores in the country among its citizens. In Hawaii, the state with the highest life span in the country, has the third lowest obesity rate in the country. On average, people in Hawaii live 6.5 years longer than those in Mississippi. It’s a wonder why healthcare expenses rise so vastly by age and region of the United States.
Now that we’ve established the most and least obese states in America, let’s examine the component parts that drive excess weight — the absence of exercise and healthy eating. The following chart shows the percentage of adults in each state that get zero physical activity during their leisure time outside of work:
When it comes to lack of exercise, Kentucky leads the country in unhealthy habits. 34.4% of adults in Kentucky get zero exercise, which is near twice as much as in Washington where adults get the most exercise in the country.
While the order is slightly different, the list of the most obese states is virtually identical to the states where people are sedentary. What’s more, of the top 10 most sedentary, 8 of them are located in the South.
When it comes to states where people get the most exercise, virtually all of them are places associated with outstanding natural beauty; Washington state leads the nation in exercise, followed by California, Colorado, Alaska, and Utah. Perhaps if you live near the mountains, you’re more likely to go hiking? Notably, however, Alaska rates well on the exercise index, but poorly on the overall obesity index.
Lastly, let’s examine the other component of obesity — healthy eating. Among adults, the CDC tracks eating habits among adults and whether they eat fruits and vegetables. We were extremely interested in ranking states by vegetable consumption, but learned that the CDC classifies french fries and fried potatoes as a vegetable in its analysis! As a result, a state would appear to be very healthy simply if its residents ate french fries every day.
Instead, we looked at the states where people eat the recommended amount of fruit or not, as a proxy for healthy eating. The CDC tracks where people don’t eat enough fruit (one or less serving per day) versus places where people more than that. The following chart ranks the states according to unhealthy eating as defined by having an insufficient amount of fruit in one’s diet:
Not only does Mississippi have the lowest lifespan in the country, but it ranks #1 in unhealthy eating. Nearly all of the states with poor eating habits also top the ranks on the obesity index. Of the top 10 states with poor eating habits, 9 of them are in the South. When it comes to healthy eating, Vermont leads the nation. Given that the state also ranks well when it comes to exercise, it’s not surprising that Vermont has a relatively low obesity rate.
Obesity is a complex social and personal problem with a variety of causes attributable to social and personal habits. In this analysis, we looked at some of the data showing where obesity is the highest in the country. The state with the highest obesity rate is West Virginia, but obesity is on the rise across the nation. This has led some analysts to note that West Virginia is the “canary in the coal mine” for the health in general in the country. The levels of obesity seen in West Virginia and the South may soon be everywhere unless further action is done.
via ZeroHedge News https://ift.tt/2LmMYwK Tyler Durden
Huawei Technologies Co. is expected to slash hundreds of jobs at a US-based R&D subsidiary, according to the Wall Street Journal.
The ‘extensive’ layoffs will affect workers at Futurewei Technologies, which employes around 850 people at labs across the country, including California, Texas and Washington State.
The exact number of layoffs couldn’t be determined, but one of the people said they were expected to be in the hundreds. Some of Huawei’s Chinese employees in the U.S. were being given the option of returning home and staying with the company, another person said. –Wall Street Journal
Following the May 16 decision by the Commerce Department to place Huawei on its so-called ‘entity list,’ which blocks companies from supplying US-sourced technology to Huawei without a license, Futurewei employees have faced difficulties communicating with their China-based colleagues. The company employs over 180,000 people worldwide.
Huawei has been virtually unable to buy critical US components and software for its telecommunications products – including smartphones and cellular base stations which are sold worldwide. Last year alone the company bought $11 billion worth of US tech. It is the largest maker of telecommunications equipment in the world, and the #2 vendor of smartphones – ahead of Apple but behind Samsung.
Analysts say the entity listing poses the most serious threat to Huawei given its reliance on American chips and other technology. Huawei founder Ren Zhengfei said last month that the measure would cost Huawei $30 billion in lost revenue this year and next. And the company’s international smartphone sales fell 40% in the month after the blacklisting was announced, though the decline has since moderated. Huawei had more than $100 billion in revenue last year, according to its annual report. –Wall Street Journal
Under the Commerce Department’s entity listing, “any unlicensed transfer of any technology of any sort by anyone from the U.S. to Huawei is prohibited” according to Obama-era Commerce Department official Kevin Wolf.
Meanwhile, Huawei is also battling a pair of US indictments on charges related to the theft of Intellectual Property (IP) as well as violations of US sanctions on Iran.
That said, while US officials have been lobbying global allies to similarly blacklist Huawei, it appears that the Trump administration may relax some of the restrictions in order to move trade negotiations forward with Beijing.
A reprieve for Huawei appeared to be in sight after President Trump said at the Group of 20 summit at Osaka, Japan, last month that he would allow some tech exports to the company to resume. Beijing sees an easing of restrictions on Huawei as a precondition for any trade deal with Washington.
On Tuesday, Commerce Secretary Wilbur Ross said the U.S. would begin granting export licenses to Huawei suppliers whose sales to the Chinese company don’t put national security at risk. Meanwhile, Treasury Secretary Steven Mnuchin has been urging U.S. suppliers to apply for licenses. –Wall Street Journal
The United States claims that Huawei and its widely used technologies could easily be used by the Chinese government for espionage. The company has pushed back on the claim, insisting that it is an independent company with no government ties.
Last week, journalist and Asia expert Isaac Stone Fish wrote in Washington Post Op-Ed hat more than one Huawei executive have direct ties to the People’s Liberation Army (PLA).
Huawei writes on its website. “Ren joined the People’s Liberation Army Engineering Corps in 1974 and retired nine years later in 1983.” It omits Huawei’s many other links to the PLA, such as how the company built the PLA’s first nationwide communications network in the late 1990s.
…
Consider chief legal officer Song Liuping, who has emerged as the defender of Huawei’s innocence in both the U.S. legal system … a search in Chinese-language media reveals that Song received his bachelor’s, master’s and PhD from the People’s Liberation Army National University of Defense Science and Technology.
…
Song is not the only top official with undisclosed ties to the PLA. Huawei’s websitelists the company’s chairman, Liang Hua, as having received his doctorate from the school now known as the Wuhan University of Technology. Liang received his bachelor’s and master’s from the Chinese military research institute the Northwestern Polytechnical University (NPU), according to an article on that university’s website. That website also shows that Yu Chengdong, the chief executive of one of Huawei’s three business units, Huawei Consumer BG, received his bachelor’s from NPU…
…
imagine the outcry if Google’s Eric Schmidt had received his bachelor’s from West Point but hid that in his bio, or if Google declined to admit that it had ever worked with the Pentagon? –WaPo
Huawei has also fended off claims that the Chinese government has a financial interest in the company. In April, a report from Fullbright University Vietnam and George Washington Law School titled “Who Owns Huawei” suggests “Regardless of who, in a practical sense, owns and controls Huawei, it is clear that the employees do not.”
In response, Huawei held a press conference in which Chief Secretary of the Board of Directors, Jiang Xisheng, said “Most of what the US government says is not true,” adding “Regarding this point, we have responded many times. Though it is not under my charge, one thing is for sure – there is no government capital in Huawei.”
via ZeroHedge News https://ift.tt/2ljL6Je Tyler Durden
Ashton Kutcher, a stupid person who got famous playing the role of a stupid person, tweeted the following the other day:
“Where has the middle gone? Middle class? Politicians who don’t need to be far left or far right? Media the just tells the facts w/o spin? The middle is most! The middle can innovate. The middle can negotiate. Hardworkers with inclusive values = the middle.”
A year ago Kutcher also tweeted a photo of himself sipping from a coffee mug bearing the insignia of the lying, torturing, propagandizing, drug trafficking, coup-staging, warmongering Central Intelligence Agency, with the caption, “Just sending out a morning shout to the men and woman of the intelligence community that keep us safe and protect our country.”
If Kutcher had tweeted a “far left” or “far right” perspective, like that America should be an all-white ethnostate or that racist demonstrators should be physically assaulted in the streets, it would have made international headlines. But tweeting in favor of the CIA, who kill many orders of magnitude more people than America’s fringe white supremacist groups, went almost completely unnoticed.
This will sound normal and obvious to you. But it shouldn’t.
If people could wake up one morning and suddenly see what the ruling power establishment is doing to them every single day, there’d suddenly be vastly more outrage directed at the so-called “centrists”, and a lot less focus on politically impotent fringe organization like white nationalists and Antifa. This is not to say that all fringe ideologies are harmless, just that none of them pose anywhere near the immediate existential threat that is posed by the current order.
There’s an old joke: A duck swims past two fish and calls down, “Hey fellas! How’s the water?” The fish look at each other for a minute and then one of them asks, “What the hell is water?”
People don’t see the dangers of mainstream “centrism” for the same reason fish don’t see water. In reality, the only reason such an ideology gets labeled “centrism” at all is because it has been normalized and made mainstream by generations of plutocratic media propaganda. The ideological group which supports the status quo omnicidal, ecocidal oppression machine by giving you a choice between two warmongering oligarchic parties in fake elections that never make any difference is nowhere near a politically moderate position by any stretch of the imagination.
People like Ashton Kutcher imagine that the so-called “center” is called that because it sits smack dab in the middle of the ideological spectrum between communism and fascism, right in that moderate sweet spot that respects capitalism and private ownership without flying off the deep end into Nazi-like tyranny. In reality, the status quo exists entirely outside any left-right paradigm. It’s neither “left” nor “right” to give total control of the western world to an alliance of plutocrats and opaque government agencies who seek to expand their power and wealth by destroying our ecosystem, waging endless wars, and gradually shoring up more and more control of their citizenry via internet censorship, surveillance and police militarization. It’s just crazy.
I’m picking on Ashton not because he occupies some special place in all this, but because he doesn’t. He’s just an illustration of how blind people have become to the real threat that’s right in front of them, and how normalized insanity has become.
People who identify as “left” see the ruling power establishment as right-wing, people who identify as “right” see the ruling power establishment as left-wing, and people who identify as “center” see themselves as moderates whose normal, healthy way of life is under threat by the “far right” and “far left”. But really all that’s happening is a few assholes fucking over everyone else, which is no more “left” or “right” than a terrorist attack. The left versus right argument doesn’t even make sense until this far more pressing issue has been resolved. A Bernie supporter and a Trump supporter are arguing about left versus right while trapped in a room with a tiger who’s eating them both alive.
A movement towards true health will look like everyone waking up to the reality that we’re all being driven toward extinction via climate collapse or nuclear war by a ruling class who used propaganda to trick us into thinking that its suicidal trajectory was the moderate path. Obviously when we create our new model we won’t all agree with each other about the best direction to take it, but we’ve got to overhaul the old one first.
* * *
The best way to get around the internet censors and make sure you see the stuff I publish is to subscribe to the mailing list for my website, which will get you an email notification for everything I publish. My work is entirely reader-supported, so if you enjoyed this piece please consider sharing it around, liking me on Facebook, following my antics onTwitter, throwing some money into my hat on Patreon orPaypal, purchasing some of my sweet merchandise, buying my new book Rogue Nation: Psychonautical Adventures With Caitlin Johnstone, or my previous book Woke: A Field Guide for Utopia Preppers. For more info on who I am, where I stand, and what I’m trying to do with this platform, click here. Everyone, racist platforms excluded, has my permission to republish or use any part of this work (or anything else I’ve written) in any way they like free of charge.
Climate activists – and anyone else who views porn online – are part of the problem, according to a new report.
A French think-tank, The Shift Project, reveals that adult material accounts for more than 4% of all carbon dioxide emissionslinked to digital technologies, while porn constitutes 27% of all videos viewed online.
Talk about a carbon handprint…
“…viewing pornographic videos in the world in 2018 generated carbon emissions of the same magnitude as that of the residential sector in France,” reads the report.
The authors then shift to a moral argument against porn, suggesting that “one of the problems mentioned regarding the effects of consuming pornography at the societal level is the phenomenon of shifting norms: during the consumption of content by an individual, a trend towards increased violence in the content viewed, for example, has been observed, leading to harmful effects on the individual’s sexuality and their perceptions of physical relationships.”
What’s more, men can’t seem to jerk off without porn.
Catherine Solano, a sexologist, has observed “for several years, that for a large proportion of men, masturbation is inseparable from pornography” (Solano, 2018). The use of pornography and thus the visualization of online pornographic videos are therefore now associated with a utilization governed by highly automatic cognitive mechanisms, which allows the efficient monetization of the products proposed. Today, the economic development of viewing online pornographic videos is therefore built on a cognitive amalgam resulting from the marketing practices of the sector: the association of using pornography with the physical act of sex (Roussilhe, 2019).
Seeing a naked body activates an initial automatic reaction in the brain which arouses interest linked to the evolutive reflex of the possibility of procreation (Solano, 2018). Since we know that our cognitive mechanisms host a bias, called “trigger effect”, that induces inertia in our thought process30 (Marcinkowski, 2019), we can understand that the sexualization of content for the general public introduces pornographic uses within a wider mechanism of influence: exposed to sexualized contents for the general public (advertising, video clips, etc.).
So – men have a pavlovian response to naked women which results in eco-unfriendly masturbation – to increasingly violent content.
via ZeroHedge News https://ift.tt/2XSdRdT Tyler Durden

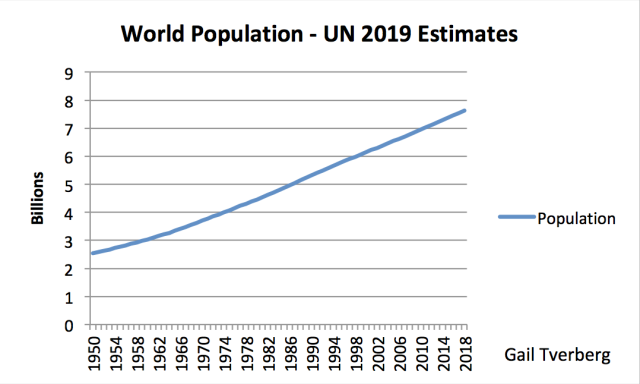
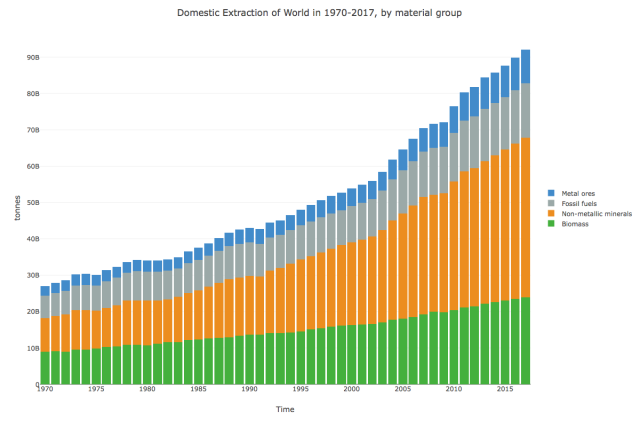
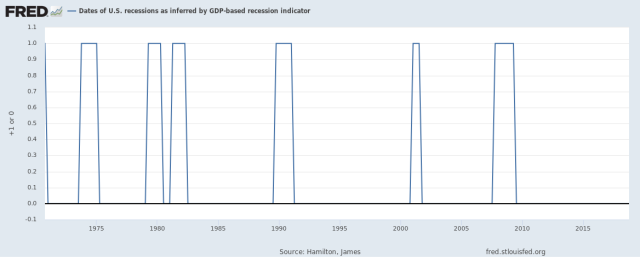
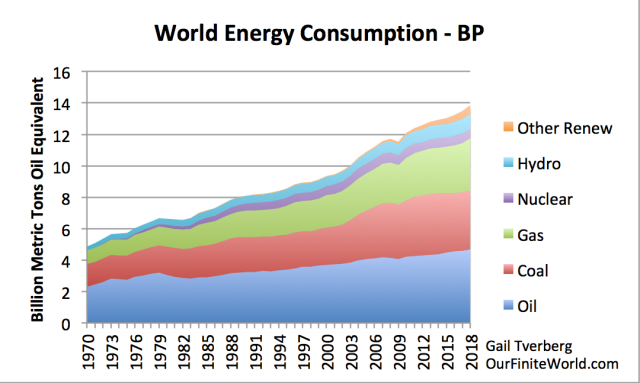
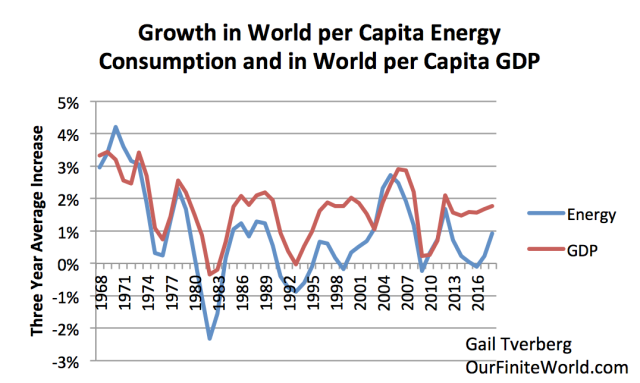
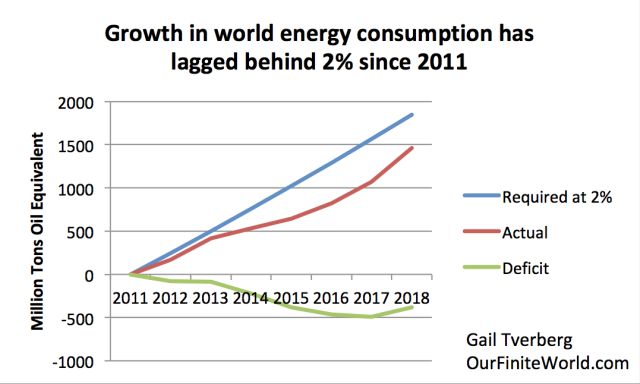
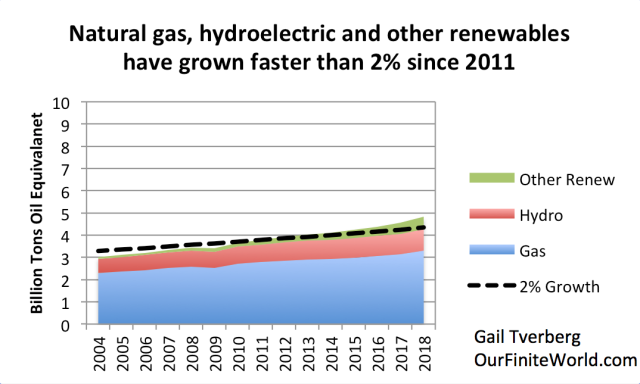
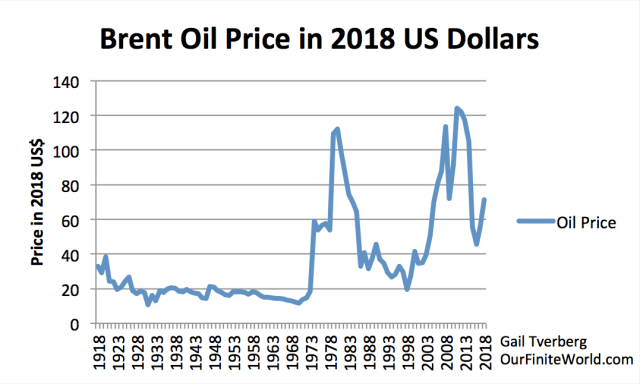
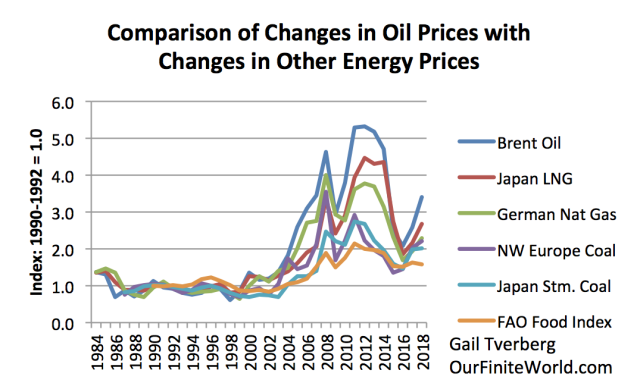
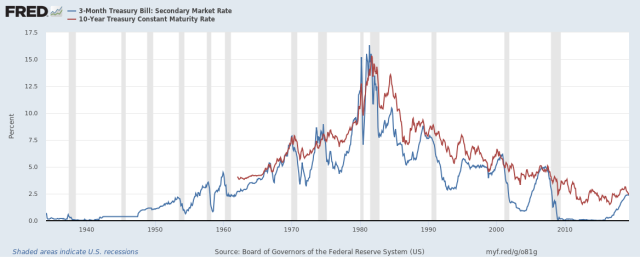
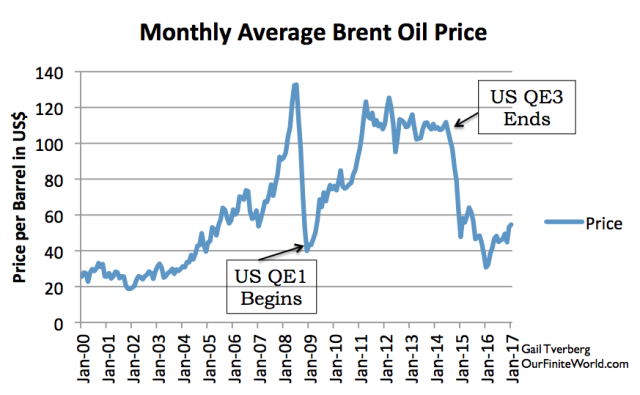
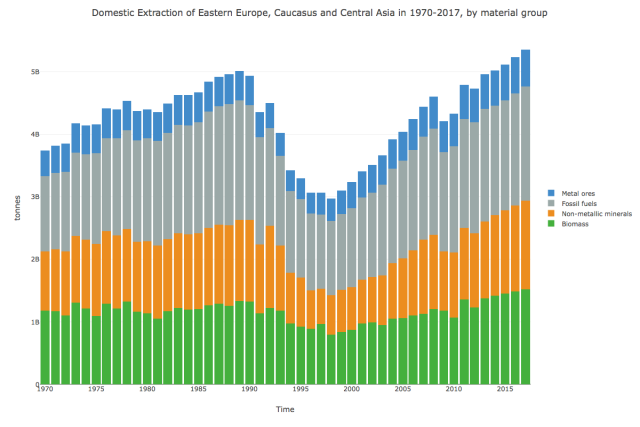

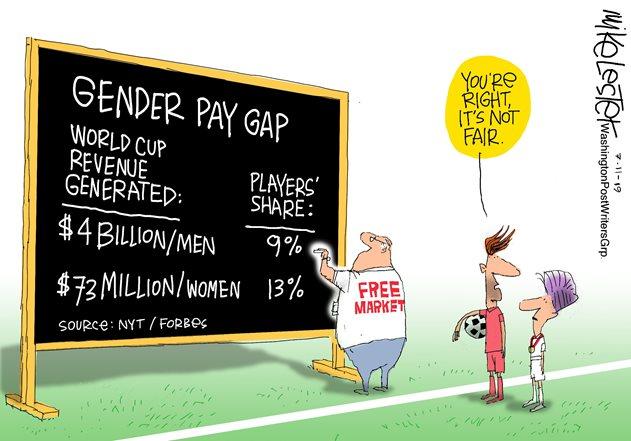

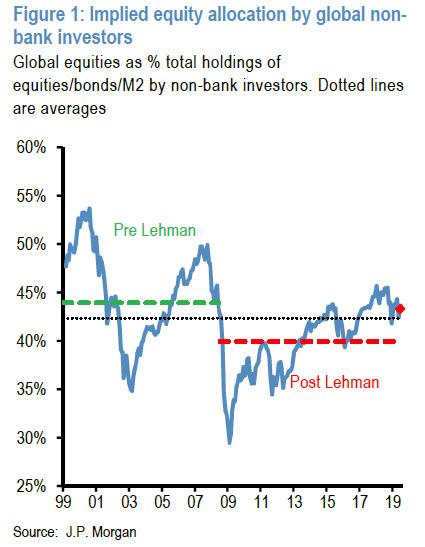
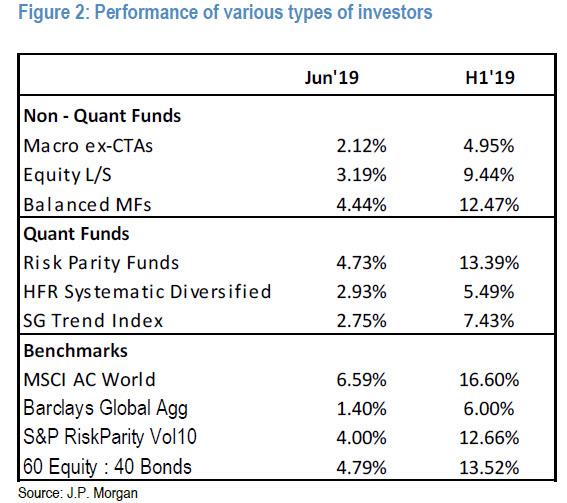
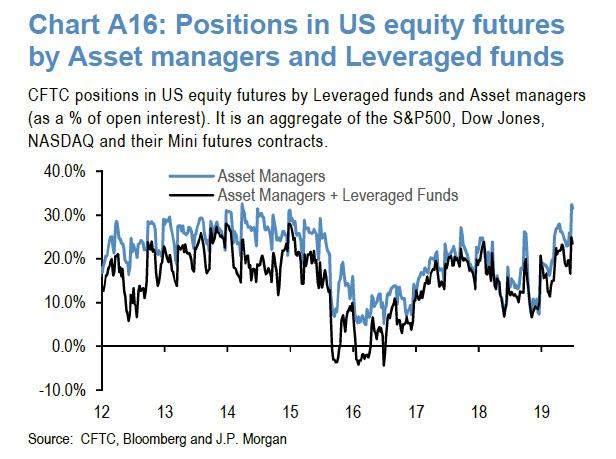
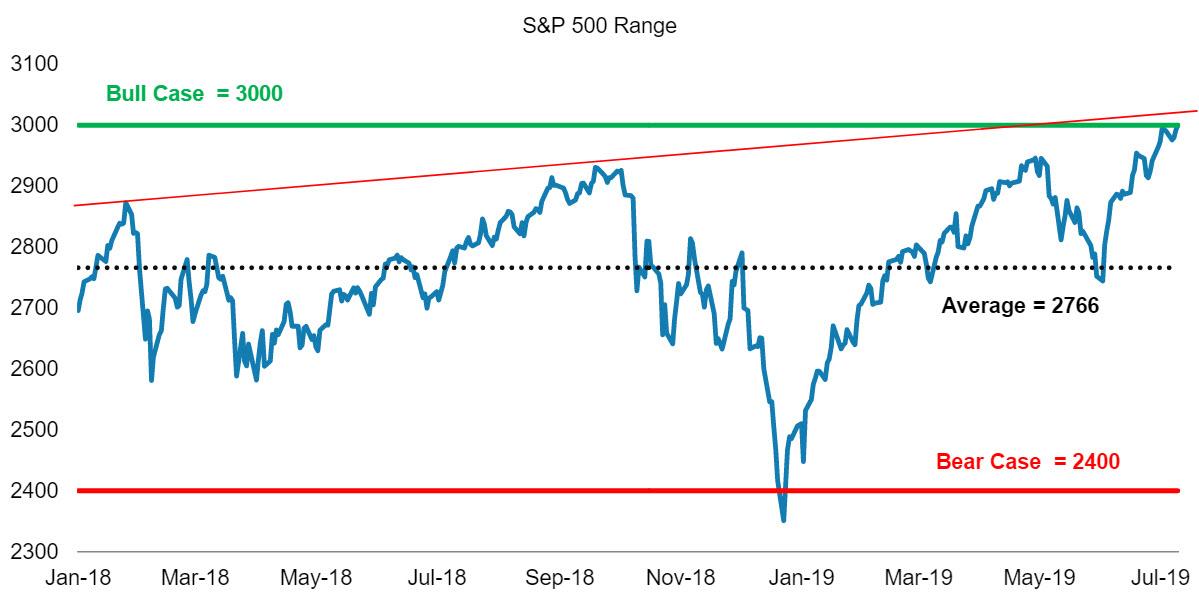


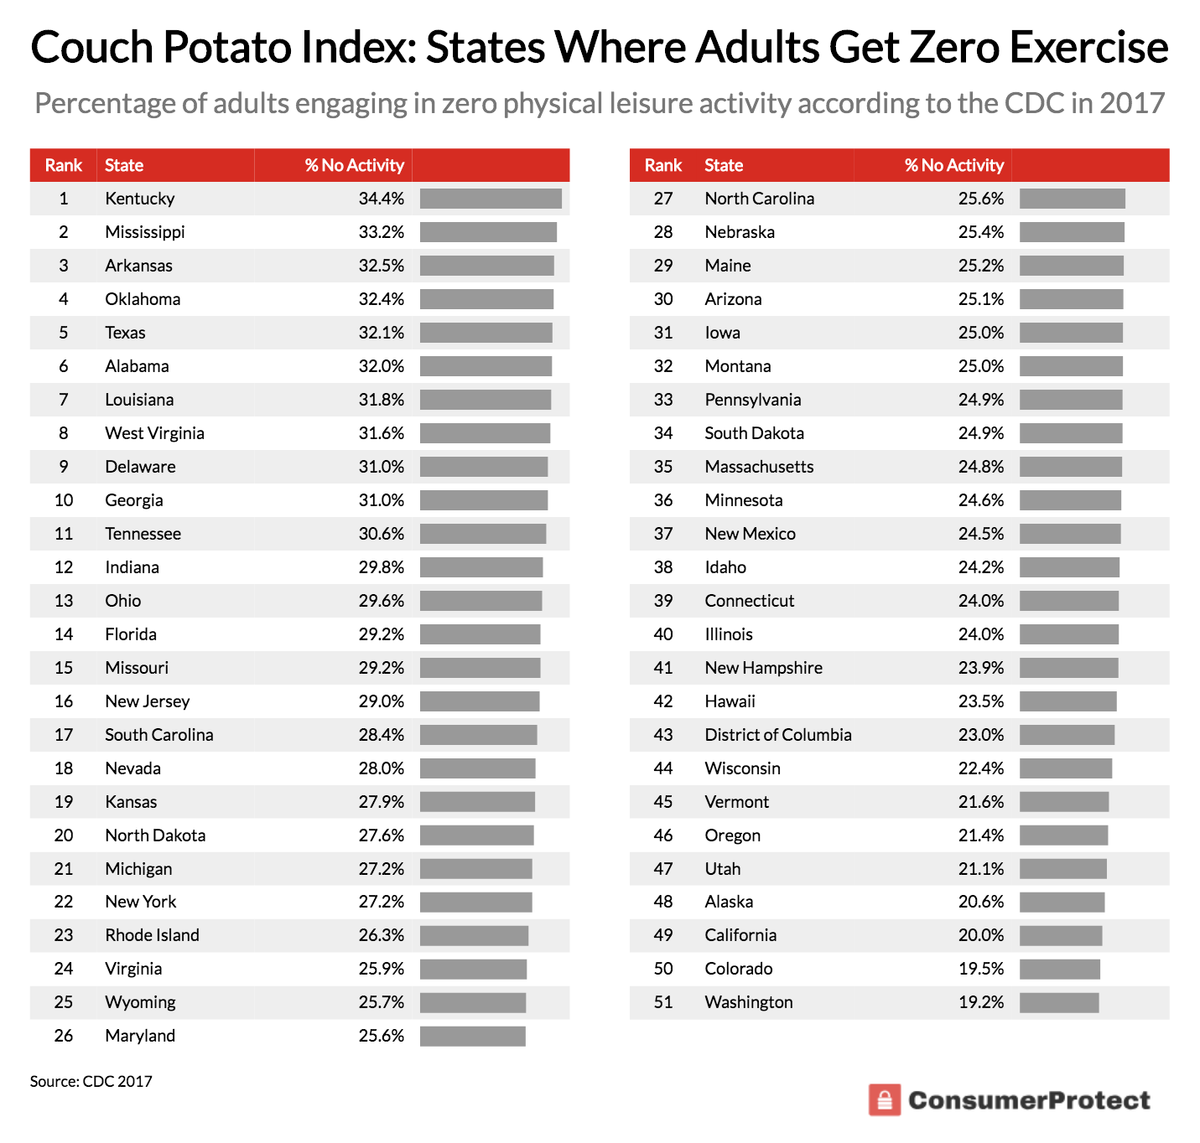
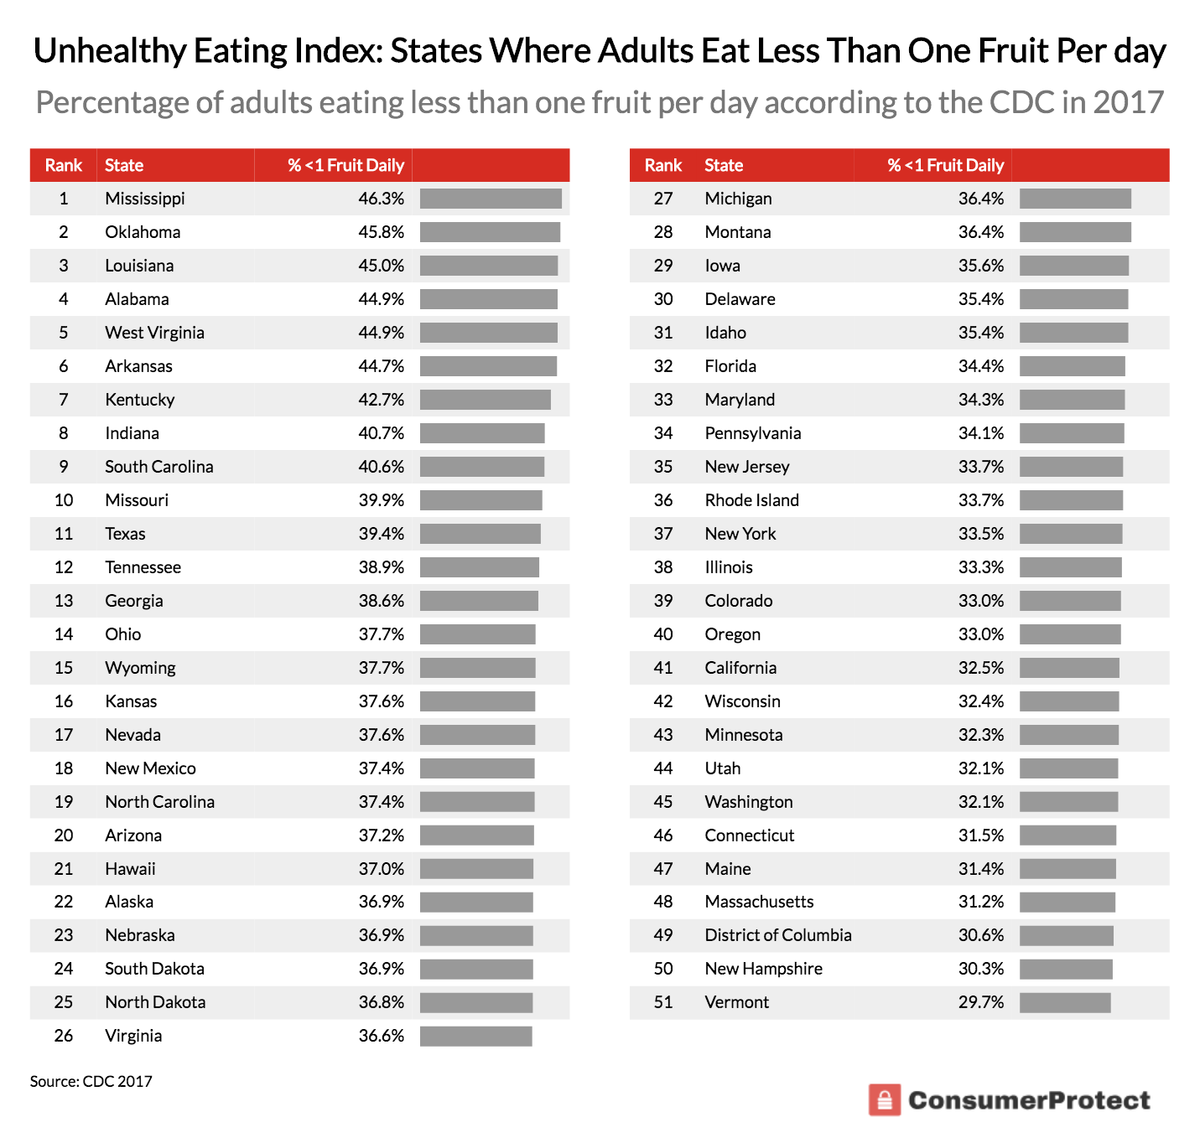


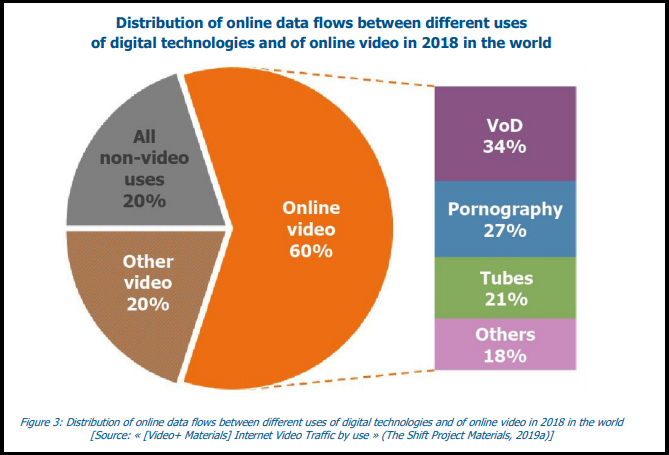

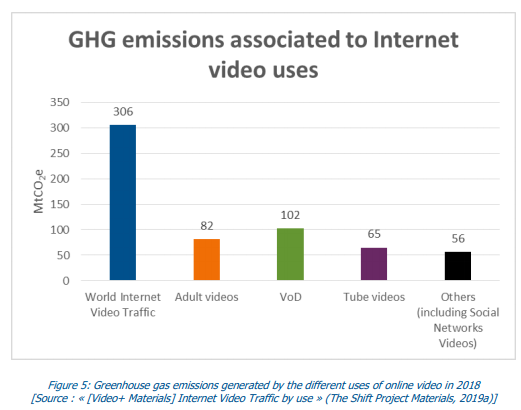
