North America Is Rattling: Alaska’s Suffered 81 Significant Quakes So Far In 2019

Authored by Michael Snyder via The End of The American Dream blog,

Something is happening to our planet. 

The mainstream media is not talking much about this, and the experts assure us that everything is going to be just fine, but the truth is that we have been witnessing an unusual amount of seismic activity all over the world.  Up until just recently, most of the shaking has been elsewhere on the globe, and so it has been easy for most Americans to ignore.  But now North America is rattling, and that isn’t going to be so easy to brush aside.  In fact, 2019 has barely even gotten started and the state of Alaska has already been hit by 81 significant earthquakes

Alaska notoriously experiences a lot of seismic activity, and in the first nine days of 2019 has been shaken by 81 earthquakes of a magnitude 2.5 or higher according to the United States Geological Survey. Of these, five have been magnitude 4.5 or higher, with one reaching magnitude 6.1. This huge quake took place 54km south-southwest of Tanaga Volcano on January 5.

Is this normal?

No, of course it is not normal.  And the heightened seismic activity that has been taking place all along the Ring of Fire is not normal either.  Just ask the people that were devastated by the massive tsunami that just hit Indonesia.

We live at a time when major Earth changes are taking place, and this has tremendous implications for all of us.  In particular, the hundreds of millions of people that live along the perimeter of the Pacific Ocean need to understand that the Ring of Fire has entered a perilous new phase.  If seismic activity continues to escalate, we could soon be talking about major disasters in which millions of people suddenly die.

Sadly, I am not exaggerating about that one bit.

Thankfully the southern coastline of Alaska is not heavily populated, because that is where one of the most dangerous subduction zones in the entire world is located

It is located along the notorious Ring of Fire, a horseshoe-shaped arc in the Pacific Ocean which joins the Pacific and North American plates.

This area – where two of the Earth’s tectonic plates meet – is marked by zones known as subduction zones.

And one of the fastest moving underwater tectonic faults is one which lies in southeastern Alaska according to the USGS.

It is known as “the Denali Fault”, and it has even more destructive potential than the San Andreas Fault does.  The following comes from Wikipedia

The Denali Fault is located in Alaska’s Denali National Parkand to the east. This National Park includes part of a massive mountain range more than 600 miles long. Along the Denali Fault, lateral and vertical offset movement is taking place (as evidenced by many earthquakes in the region).

The steep north face of Denali, known as the Wickersham Wall, rises 15000 feet from its base, and is a result of this relatively recent movement.

If you are wondering, the magnitude 7.0 earthquake that recently shook Anchorage did not happen along the Denali fault.

But it was still the most destructive quake to hit Alaska in many years, and it really shook up many of those that live in the region.  For example, ever since the earthquake happened one little girl will not go to sleep at night without a 100 pound pit bull tucked in right next to her

A little toddler is filmed tucking in her 100lbs pit bull after becoming so scared to sleep without him.

Adalynn Leary became too scared to sleep without her ‘best friend and bodyguard’ since their home in Alaska was hit by a 7.0 magnitude earthquake.

Her father Kyle Leary said that his daughter cuddles Fury as he helps ease her anxiety.

Hopefully that pit bull is well trained, because we have all read about what they can do when they get upset about something.

Anyway, it isn’t just Alaska that has been hit by unusual earthquakes lately.  Earlier this week, the state of Mississippi was struck by a magnitude 3.7 earthquake

A 3.7 magnitude earthquake was reported in Hollandale, Mississippi around 4:30 p.m. Tuesday.

Shaking was felt throughout Washington County, however, according to Emergency Management Division Manager David Burford, there have been no reports of any damage. “The ground shook, but not for long.”

The earthquake was at a depth of 5 kilometers, which is very shallow.

Earthquakes are not supposed to happen in Mississippi.

And last month eastern Tennessee was hit by the largest earthquake that it had experienced in 45 years.

Was that just another “coincidence”, or was it part of an overall trend that is emerging?

Globally, we have seen major earthquakes of at least magnitude 6.0 hit JapanBrazil, and Indonesia over the last several days.

More “coincidences”?

We have entered a period of time when earthquakes are striking in diverse places, and many believe that this is just the beginning.

I understand that the mainstream media is completely obsessed with all things related to President Trump right now, but the changes that are happening to our planet are going to become a bigger and bigger story.

And someday in the not too distant future an absolutely massive seismic event will hit a major population center, and at that point everything will begin to change.

via RSS http://bit.ly/2RNdzFS Tyler Durden

Bezos’ Divorce Could Boost Amazon’s Share Price

It might seem counterintuitive to laymen, but the Bezos’ divorce – and the equitable division of assets that is likely to ensue – may end up boosting Amazon’s share price, particularly if Jeff and MacKenzie are forced to liquidate some of what is currently a 16% stake in the e-commerce behemoth.

That’s because – as Bloomberg explains – if the couple must sell shares as part of their divorce, then those shares will join Amazon’s free float. That would in turn boost Amazon’s weighing in indexes like the S&P 500.

Bezos

If that happens, index-fund managers will need to buy more Amazon shares to account for this change.

Regulatory filings show Jeff Bezos owns almost 79 million shares of the company, worth about $130 billion as of yesterday. If MacKenzie takes a chunk in a settlement – or either party needs to liquidate their assets to meet divorce expenses – those could become part of the company’s freely traded stock. In turn, that could boost the company’s weighting in indexes including the S&P 500 – sending tracker funds on a small Amazon shopping spree.

Considering that Amazon is one of the most liquid stocks traded in the US, it’s unlikely that any selling by the Bezos’ would have much of an impact on the share price. But it could hurt other stocks as index managers liquidate other holdings to buy Amazon.

“From the perspective of the index, you’d need to a sell a little of everything else and buy some Amazon,” said David Dziekanski, a portfolio manager at Toroso Investments. “The equity markets will absorb any Amazon additional shares without much impact on price.”

Amazon, which is the world’s most valuable publicly traded company, has a market cap of just over $800 billion. Compare that with $3.4 trillion pegged to the S&P 500, and another $6.5 trillion use the gauge as a benchmark. Indexes typically use a company’s available float – rather than the number of shares outstanding – to determine weighting (this measure excludes shares owned by the company’s officers).

But S&P methodology also excludes shares owned by “related individuals” of company officers and directors from its float calculation. The index provider declined to comment on whether that category would include ex-spouses, with a spokeswoman adding that the firm doesn’t typically comment on individual companies. More simply, the float could grow if either Bezos sells shares to raise cash. Because let’s face it, even Amazon can’t make divorces cheap.

And since MacKenzie Bezos didn’t sign a prenup, it looks like some of the stock will likely be sold as assets are divided and taxes are paid.

via RSS http://bit.ly/2AJ22xB Tyler Durden

The Crash Of The “Everything Bubble” Started In 2018 – Here’s What Comes Next In 2019

Authored by Brandon Smith via Alt-Market.com,

In 2018, a very significant economic change occurred which sealed the fate of the U.S. economy as well as numerous other economies around the globe. This change was the reversal of central bank policy. The era of stimulus and artificial support of various markets, including stocks, is beginning to fade away as the Federal Reserve pursues policy tightening, including higher interest rates and larger cuts to its balance sheet.

I warned of this change under new Chairman Jerome Powell at the beginning of 2018 in my article ‘New Fed Chairman Will Trigger Stock Market Crash In 2018’. The crash had a false start in February/March, as stocks were saved by massive corporate buybacks through the 2nd and 3rd quarters. However, as interest rates edged higher and Trump’s tax cut cash ran thin, corporate stock buybacks began to dwindle in the final quarter of the year.

As I predicted in September in my article ‘The Everything Bubble: When Will It Finally Crash?’, the crash accelerated in December, as the Fed raised interest rates to their neutral rate of inflation and increased balance sheet cuts to $50 billion per month.  In 2019, this crash will continue as the fed resumes cuts once again in mid-January.

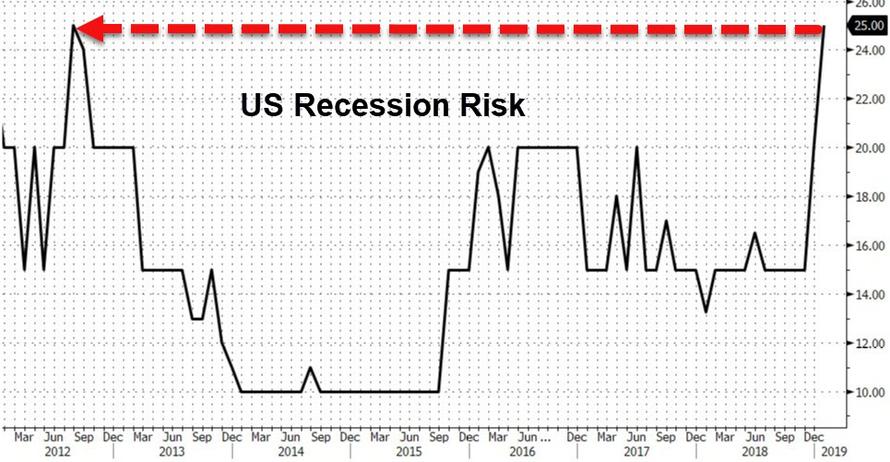
It is important to note that when we speak of a crash in alternative economic circles, we are not only talking about stock markets. Mainstream economists often claim that stocks are a predictive indicator for the future health of the wider economy. This is incorrect. Stocks are actually a trailing indicator; they tend to crash well after all other fundamentals have started to decline.

Housing markets have been plunging in terms of sales as well as value. The Fed’s interest rate hikes are translating to much higher mortgage rates in the wake of overly inflated prices and weaker consumer wages. Corporate buyers in real estate, which have been propping up the housing market for years, are now unable to continue life support. Corporate debt across the board is at all-time highs not seen since the crash of 2008, and with higher interest rates, borrowing cheap capital is no longer an option.

In November 2018, home sales posted the steepest decline in over 7 years.

Auto markets, another major indicator of economic stability, have been plunging in extreme fashion. Autos saw steep declines throughout the last half of 2018, once again as higher Fed interest rates killed easy credit ARM-style car loans.

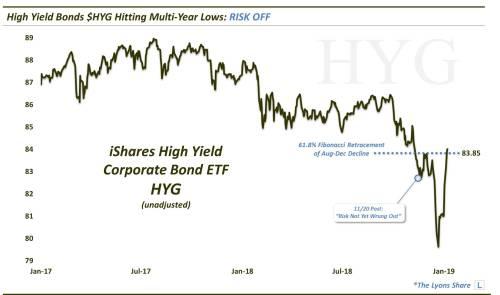
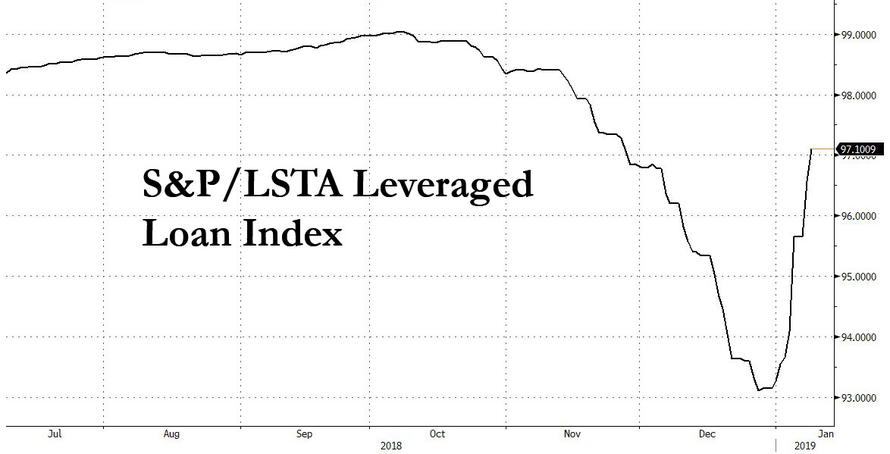
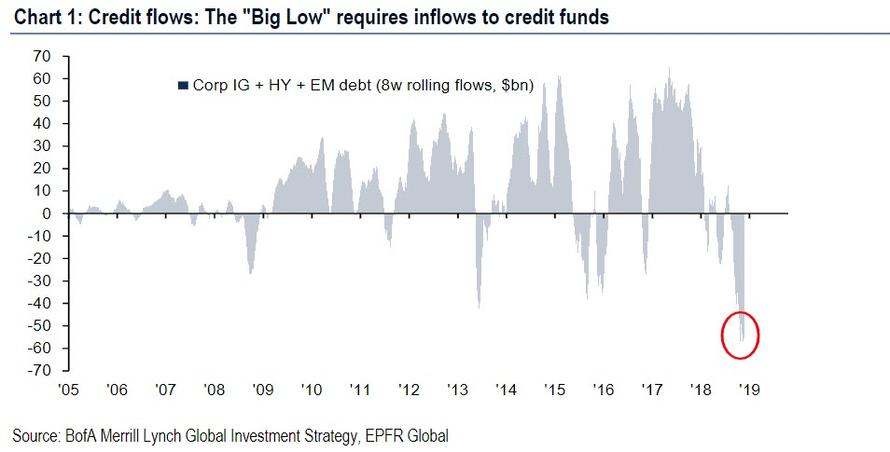
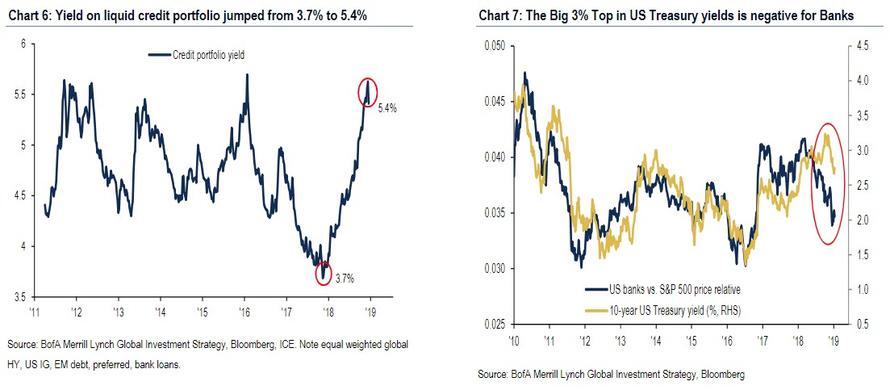
U.S. credit is also drying up as investors pull capital from volatile markets and interest rates rise. Liquidity is disappearing, which means debt is becoming more expensive, or inaccessible to most people and businesses.

A false narrative is being presented in the mainstream on these circumstances – by both the media and central bankers. There has been a considerable amount of “jawboning” by economic authorities and mainstream analysts in an attempt to keep the public distracted from the economic crisis as well as keep the investment world engaged in trading with blinders on. With the propaganda going into overdrive, we must cut through the fog and mirrors, gauging the most important threats within the system and determining when they might escalate.

Make no mistake, as erratic and unstable as 2018 was, 2019 will be far worse.

The Federal Reserve Will Continue Tightening

There is a lie circulating in the media that Jerome Powell and the Fed are “heroic” for “going against” past central bank regimes and removing easy money policies. This is the exact opposite motive behind what is happening. We have to remember that it was the Fed and other central banks that created the initial crash in 2008 through easy money policies. They then deliberately created an even bigger bubble (the “everything bubble”) through more monetary stimulus; a bubble so large that it would collapse the entire U.S. economy including bond markets and the dollar if it ever burst.

This circular process of crisis-stimulus-crisis is one that that the central bank has used for over a century. Former Fed officials like Ben Bernanke and Alan Greenspan have openly admitted to central bank culpability for the Great Depression as well as the crash of 2008. Though, as they do this they also assert that they were “not aware at the time” of the greater danger. I don’t buy that for a second.

In almost every instance during which the Fed created a crash environment, banking institutions were able to use the opportunity to snatch up hard assets for pennies on the dollar, as well as steal more political and social power. During the Great Depression, major banks absorbed thousands of smaller local banks as well as all the assets those banks held. In 2008, banks and corporations enjoyed a deluge of easy money paid for by American taxpayers for generations to come, while also vacuuming up hard assets like distressed home mortgages.

An even greater prize for banking elites is global centralization of economic authority, which is what I believe their goal is as the next engineered crash runs its course. As crisis leads to catastrophe, it will be institutions driven by globalism like the International Monetary Fund (IMF) and Bank for International Settlements (BIS) that step in to “save the day”.

As I have noted time and time again, Jerome Powell is well aware of what will happen as the Fed tightens. He is recorded in the Fed minutes of October 2012 discussing the consequences, including his hint of an impending crash if the Fed shut down stimulus measures, raised interest rates and cut the balance sheet.

Yet, Powell continues tightening all the same, indicating that Fed actions and the results are quite deliberate. Recent statements by Powell have been wrongly interpreted by the mainstream to indicate that the Fed might back off of tightening policies. I predict that this will not happen, at least not until the crash has already run its course.

I expect Powell to continue balance sheet cuts at around $50 billion per month through until perhaps the end of 2019. I also hold to my original prediction last year that the Fed will hike interest rates in 2019, at least two more times, with a hike in March.  The Fed has continued to show a propensity for double talk on “accommodation”, and there is a good reason for this…

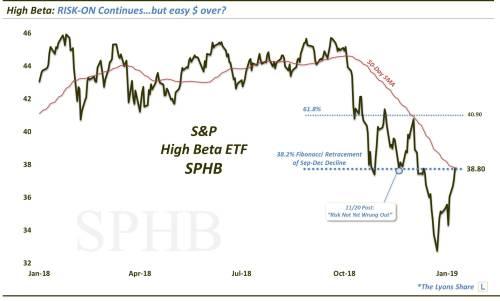
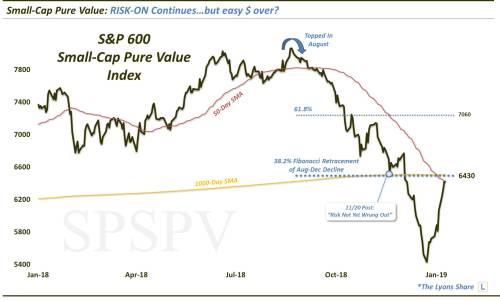
Stock Markets Will Continue to Plunge

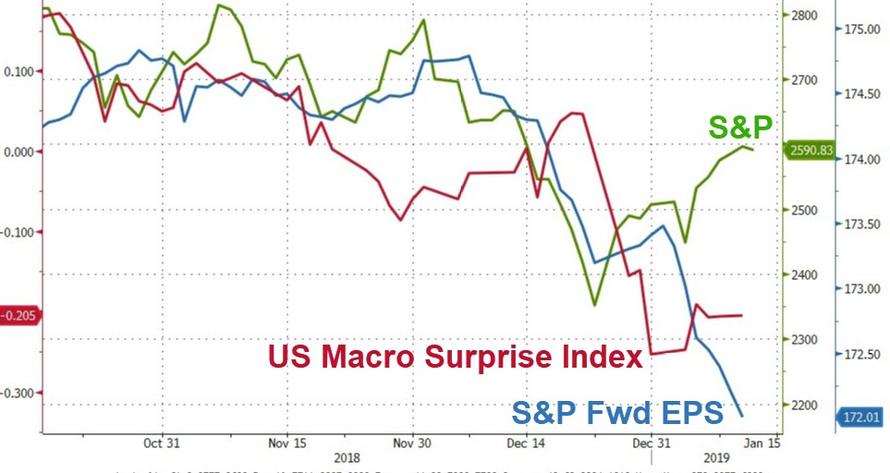
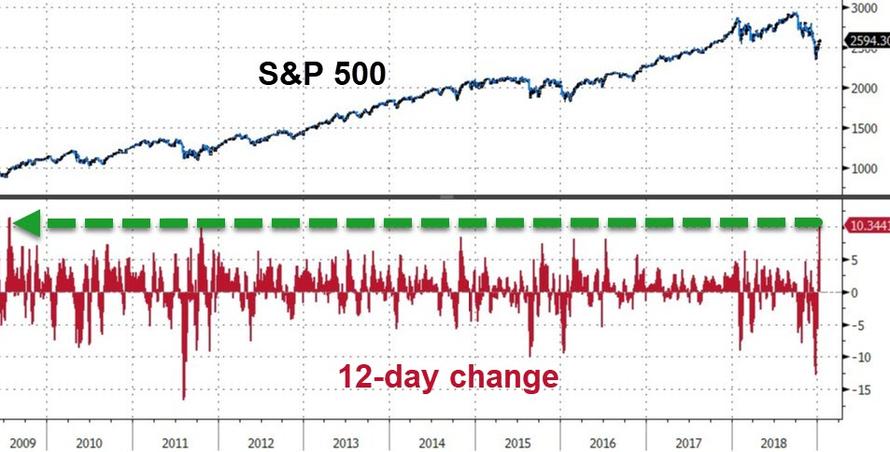
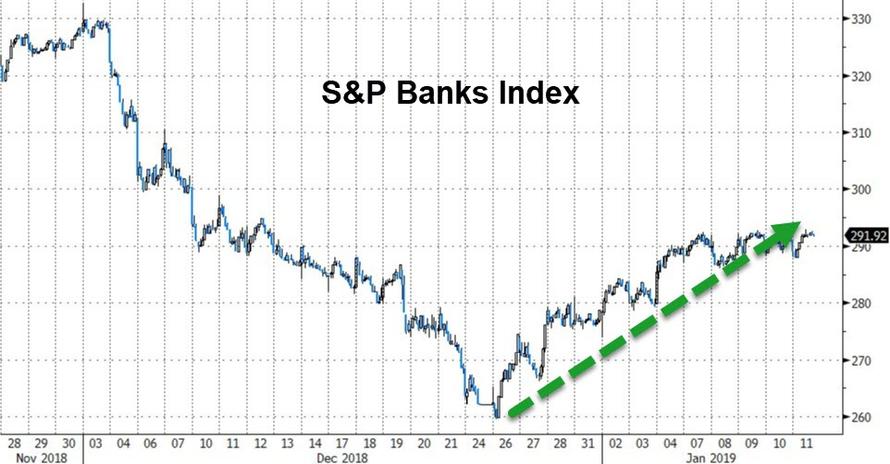
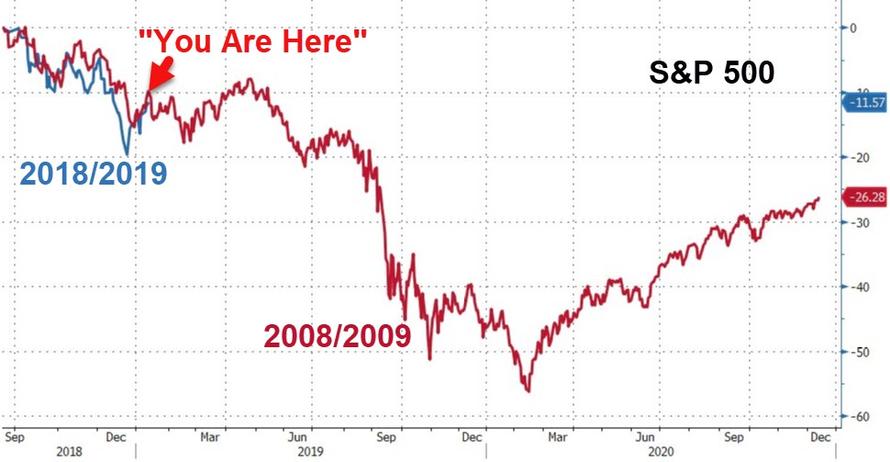
Many alternative economists have been pointing out over the years the direct correlation between the Fed balance sheet and stock market prices. As the Fed bought up assets, the stock market rose exactly in tandem. As the Fed dumps assets, stocks fall with increasing speed and volatility.

If you want a perfect example of this, simply examine the central bank’s FRED balance sheet totals and compare them with a year long graph of the S&P500. Do not only look at the stock plunges, but also the stock rallies.   Dramatic cuts in December facilitated the start of the crash; the recent bounce occurred in part due to end of the year investment by corporate pension funds, searching desperately for yield in an environment where bonds are no longer viable or safe.  However, take note that the first week of January also saw Fed cuts flatline.

What does this mean?  Without a massive alternative capital source like stock buybacks in play, every new large Fed asset cut will result in a steep decline around the middle of each month.  Every pause in cuts will result in a bounce, but to lower highs.  The ceiling for rallies and the expectations of investors will gradually dwindle until the reality that the party is over finally hits them.

The Fed’s recent “dovish” comments, in my view, are completely fraudulent and highly calculated. Because the central bank has cut stimulus and raised interest rates to the point that corporations can no longer afford massive buyback binges, there is nothing left to support stocks except disinformation, blind faith, and a 1-2 week pause in balance sheet cuts.

This is a controlled demolition of the economy and markets. The Fed will jawbone as much as possible to keep the system from imploding too fast, because jawboning is the only tool that is left. In the meantime, Powell will keep cutting assets and raising interest rates on schedule. This will inevitably translate into lower prices in equities as the system is “steam valved” down. Blind faith by investors will only go so far. They will be left holding the bag, right along with pensions.

I expect stocks will resume their steep decline through 2019, and will fall well below support levels seen in 2017. If December’s decline was any indication, as long as the Fed continues its current path of balance sheet cuts, I see the Dow in the 17,000 to 18,000 point range in March-April.

Trump Will Get The Blame For The Crash

Trump’s incessant propensity for taking credit for the bull rally in stocks makes him a perfect scapegoat for the ongoing crash. The acceleration in 2019 will be followed by numerous distractions. While Trump has blamed the Federal Reserve for recent stock instability, he has at the same time blamed his own trade war. Trump has attached the success of his presidency to the success of a stock market that he used to call a “big bubble” created by the Fed.

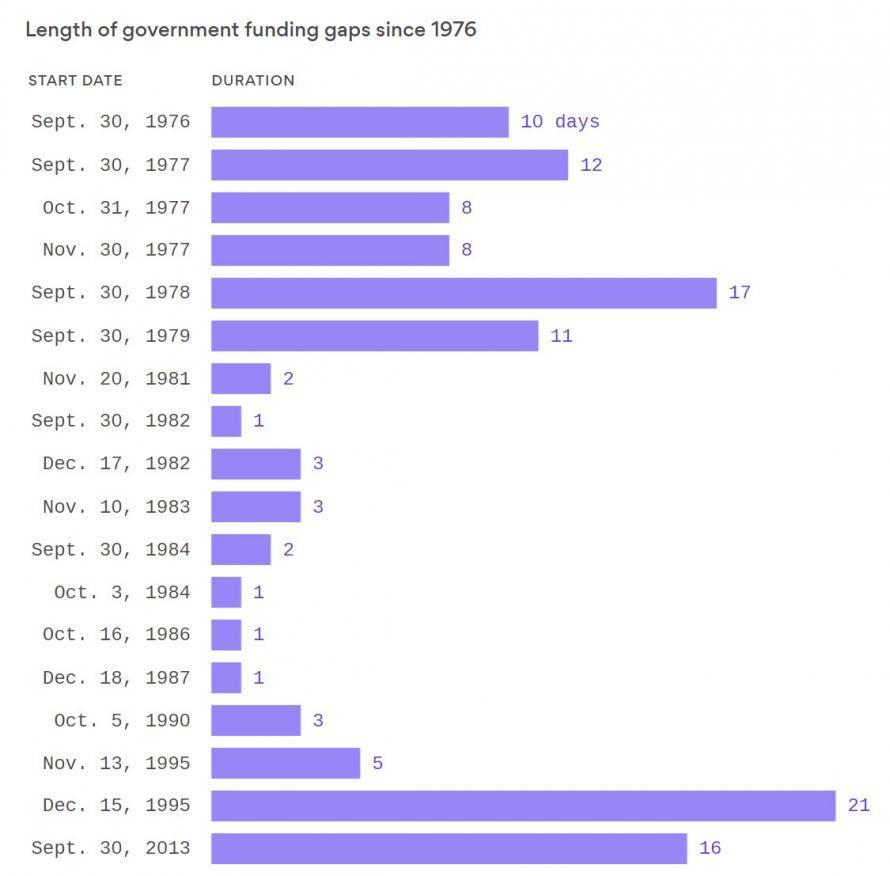
Trump’s trade war along with the government shutdown are just two factors that are already being targeted by the mainstream media and globalist commentators as the causes of the December plunge in equities.

The shutdown might not continue through January if Trump declares a state of emergency and begins the southern border wall, making the budget debate rather moot. That said, I suspect it may continue anyway; this time does feel different.  Consider that if the shutdown enters into February there is the threat that welfare programs like EBT will be delayed, which opens the door to a whole new kind of insanity.  I don’t necessarily have anything against the average person seeking welfare in times of personal crisis.  That said, there are millions of Americans who have made a career out of collecting government aid, and their attitude is often one of entitlement.  If and when their revenue and food source is cut off, their reaction may be violent.

The timing of the current shutdown makes it such a useful distraction away from central bank actions that I would be surprised if it was ended in the near term.  The threat of delays on EBT and government welfare would be a very juicy crisis that could be exploited by central banks and globalists

I predict the trade war will continue through 2019, as it has for the past year. Trump will announce “huge” progress on negotiations with China at times in order to jawbone stocks up, but days or weeks later this progress will once again come into question. I realize this is an easy prediction. The trade war farce has followed a rather predictable pattern lately.

Trump has been extraordinarily helpful to the banking elites in this regard. In fact, the Trump Administration seems to add a new escalation in the trade war a week after every major Fed balance sheet cut or rate hike; just in time for stocks to drop violently due to the Fed dump.

Other Predictions For 2019

A “Hard Brexit”: Look for the Brexit to enter a possible no-deal scenario with the EU followed by an aggressive economic downturn beyond what is already occurring in Europe.  While this outcome appears to be a longshot right now, it makes sense according to the false narrative globalists are building – the narrative that “populists” are a reckless and destructive influence that is leading to economic disaster.

Turkey Leaving NATO: This seems like a done deal already.  Turkey is positioning to couple to Eastern powers like China and Russia through various trade agreements and strategic deals, and abandoning ties to the West.  While this has the potential to drag on for a few more years, I believe it will happen quickly – by the end of 2019.

Martial Law Conditions In France: The “yellow vest” protests are going to continue through 2019, and will probably become more volatile as Emmanuel Macron attempts to tighten control.  Look for protests to grow in spring and summer as the weather warms up.  Macron has not been shy about using his totalitarian toolbox.  I expect him to declare a condition of national emergency with martial law-like powers in place as soon as the end of this year.  Whether or not this was an intended outcome by the globalists Macron so closely associates with, I do not yet know.  We have not heard much in terms of specific demands or ideological views from the Yellow Vests.  Understanding the goals and motives of both sides will determine if there is a false paradigm in play or if the Yellow Vests are a true grassroots movement.

Summary

To summarize, the crash of the “everything bubble” has been deliberately initiated by central bankers. The worst is yet to come in 2019.

Trump has made himself a sacrificial goat for the banking elites, and his administration will be taking the blame by the end of this year regardless of the facts surrounding the Federal Reserve’s program of controlled demolition.  The year of 2018 was the beginning of the next phase of engineered crisis, 2019 will see the crash hit the mainstream consciousness not to mention the doorsteps and wallets of the general public.

*  *  *

If you would like to support the publishing of articles like the one you have just read, visit our donations page here.  We greatly appreciate your patronage.

via RSS http://bit.ly/2RH9Yta Tyler Durden

BTFDove – Stocks Extend Best Run In 10 Years Off Mnuchin Massacre Lows

Slumping macro data, tumbling earnings expectations, and “substantial” Fed balance sheet run off to come, that explains why stocks at near-record levels of extension in the last few weeks…

Of course the algos had plenty to chew on still – Powell BTFDove, China RRR Cut, Trade talk optimism, Mnuchin calls PPT, and Saudis scramble to boost oil higher


Big week for China stocks but it was all dominated by Wednesday morning’s rescue bid…


Italy was Europe’s outperformer on the week…


US Equity markets stalled today but once again that dip was bought…

…and extended the post-Mnuchin Massacre buying frenzy…

That is the greatest 12-day rally for the S&P since July 2009…


On the week, Small Caps surged almost 5% – its best week since Dec 2016…


Biotechs are back in a bull market – soaring over 22% from the Xmas Eve lows…


FANG Stocks are up over 26% from the Mnuchin Massacre lows…


Banks have bounced back but not as much as the high-momo sectors above…


And everything was looking awesome for department stores and retailers until yesterday…


The VIX Index has fallen from the open to the close for 12 consecutive sessions. (h/t @selling_theta) That’s tied for the longest such streak since 2009 (which, at 13, was the longest stretch on record according to data going back to 1992).


Credit spreads compressed further on the week but found some resistance today…


Treasury bond yields were all higher on the week with the long-end underperforming despite a rally into the weekend…


However, 10Y Yields fell back into their 30-year channel – somewhat disrupting the bears’ claims that the bull is over…


The Dollar fell for the 4th week in a row (breaking down to its weakest since September)…


This was the yuan’s best week since 2005!!


Ugly week for cryptos, leaving Bitcoin in the red for 2019…


PMs and Copper trod water on the week as crude prices exploded…


Things initially looked good for WTI’s record win streak early on (ten consecutive daily gains would have marked the longest rally since the contract started trading in 1988), but once $53 was tagged, WTI tumbled…


Gold fell against the dollar and even more so against the yuan on the week…


Finally, amid all this exuberant stock buying and proclamations that “the bottom is in” – recession risk is at a seven year high…

Don’t forget “you are here”…


via RSS http://bit.ly/2FlCPxo Tyler Durden

Trump Makes History: Government Shutdown Will Be Longest On Record

After House Democrats pushed through a series of spending bills in a doomed attempt to end the shutdown (or at least crystallize their virtue-signaling in the Congressional record), the Senate decided to adjourn for the weekend on Friday without taking up debate on any of the bills (which had approximately zero chance of passing the upper chamber and being signed into law by the president), virtually guaranteeing that the partial government shutdown that is currently in its 21st day will surpass a shutdown that ended in December 1995 to become the longest in American history.

The shutdown is the third since the dawn of the Trump administration, but while the earlier shutdowns lasted for days or hours, this one has dragged on for three weeks already. And with Democrats refusing to accede to Trump’s demands for $5.7 billion in border wall funding, it’s possible that it could persist until Trump decides to declare a national emergency to begin construction on the border wall.

Shutdown

Roughly 800,000 federal workers have either been furloughed or are working without pay and have now missed a round of paychecks that were supposed to go out on Friday. Congress has passed a bill to guarantee back pay to all federal workers affected by the shutdown, and it’s awaiting a signature from the president.

But that won’t stop hundreds of thousands of workers from missing rent or mortgage payments, or falling behind on their bills or foregoing groceries.

After struggling on for weeks, the TSA said Friday that it would begin limiting security checkpoints at airports around the country, with Miami International Airport preparing to close an entire concourse. A union representing TSA employees has filed a lawsuit arguing that it’s illegal for the government to ask employees to work without pay, Bloomberg reported.

Separately, a union representing more than 10,000 air-traffic controllers filed suit in federal court in Washington on Friday, charging that it’s illegal to force them and other aviation employees to work without compensation.

The Transportation Security Administration plans to begin closing a handful of security checkpoints at airports around the U.S. as soon as this weekend in response to staff shortages triggered by a partial federal government shutdown now in its third week.

Miami International Airport expects to shut one of its concourses for several days starting Saturday afternoon and will move flights to other gates, according to a statement by the airport.

Ahead of their first missed paycheck this week, the TSA saw a spike in employees calling out sick, as more than 50,000 workers have been going without pay since Dec. 22, the day the shutdown began.

But that’s not all: Hundreds of affordable housing contracts that have expired during the shutdown mean that thousands of low-income senior citizens will go without essential services like repairs to HUD-funded homes, according to NBC News.

The few federal employees left at HUD have been scouring the books, looking for a last-minute solution to fund hundreds of affordable housing contracts that have expired under the shutdown.

More than 200 of the contracts that expired in December are for properties, like San Jose Manor II, that provide rental assistance for the elderly, according to LeadingAge, an association for nonprofit providers of aging services. Known as Section 202, the program houses about 400,000 low-income elderly people as part of HUD’s Section 8 Project-Based Rental Assistance.

Though it’s worth noting that HUD has found money to service other low-income housing contracts. Meanwhile, as volunteers have flocked to national parks to pick up trash and attend to the routine upkeep, CNN reported that vandals cut down a protected Joshua Trees in Joshua Tree national park in California.

As the fallout from the shutdown worsens, President Trump is reportedly considering a plan to use disaster-relief funding earmarked for California and Puerto Rico to order the Army Corps. of Engineers to begin building a large swath of the wall – though Congressional Republicans are split on whether this is a good idea (WSJ’s editorial board recently opined that using a national emergency as a subtext to build the wall would set a “bad precedent”).

Still, there’s at least one silver lining: Stocks have climbed more than 10% since the shutdown began – defying analysts’ warnings, though Fed Chairman Jerome Powell warned yesterday that it could negatively impact GDP growth for Q1.

In fact, according to an estimate from S&P Global Ratings, if the shutdown persists for another two weeks, the cost to the US economy will exceed $6 billion – more than the $5.7 billion Trump is asking of Congress, CNBC  reported.

via RSS http://bit.ly/2AJLXI7 Tyler Durden

Macquarie: Enjoy The Rally, But We’ll Revisit The Lows Of 2018

Earlier this week we asked if, just like in early 2016, a new “Shanghai Accord” was coming.

Implicitly responding to our rhetorical inquiry, Macquarie’s Victor Shvets published a report titled “Shanghai redux & Benjamin Graham” in which he agrees with us that “investors seem to be increasingly expecting that a new Shanghai Accord (a laFeb ’16) is on the horizon” an assessment which be in line with Macquarie’s view that asset-based economies are “utterly dependent on ample (excessive) liquidity, persistently low (declining over time) cost of capital, contained volatilities and regular public-sector-inspired reflationary momentums” which can be achieved only by pumping liquidity at a faster clip than nominal GDP, tightly co-ordinating monetary policies and China pumping a reflationary pulse while avoiding extreme geopolitical outcomes.

That – according to Shvetz – is exactly what occurred in early ’16, giving us two years of synchronized growth, collapse of volatilities and a weaker US$. This ended in ’18, and in ‘19 the rubber truly hits the road.

So with all that said, is a Shanghai Accord 2.0 indeed coming? Well, not so fast, because as Shvets explains below, while such an outcome is likely, “more pain needs to be endured first.” Here’s why:

The climb down by all parties (including the Fed) has always been as close as one gets to an absolute certainty. The only question that we have been raising is one of timing and how much pain would need to be endured. Neither CBs nor China are yet embracing our bleak view of the future of ever diminishing windows of acceptable cost of capital and volatilities, as private sectors atrophy under pressure of technological evolution and financialization. Instead, we see everyone (from IMF to PBoC) debating debt sustainability, reforms and returning to private sector primacy. Hence, neither US, Fed nor China want to ‘overreact’; as a result, they run the constant risk of ‘under-reacting’.

There’s more, because as the macro strategist further explains, “this time around, there are also significant differences with late ’15.”

  • First, the commodity complex (CRB), is ~20% higher.
  • Second, wage pressures in most key economies, though relatively tame, are stronger.
  • Third, inflation rates are higher (G7 CPI is ~1.9% vs 0.6% in Feb ’16), while China’s PPI is no longer negative (-5.3% in Jan ’16 vs 0.9% today).
  • Fourth, investors need to take into account far more unpredictable and nationalistic political background.
  • Fifth, Europe is potentially facing a revolution. But as in ’15, all measures of liquidity have turned negative, and global momentum is ebbing.

These in turn cause regular ‘heart palpitations’, testing ever higher levels of volatilities, while regularly closing market access for the most vulnerable players according to Macquarie.

What does this mean? According to Shvets, since today’s environment is more complex than early 2016, “we might have to revisit the 2018 lows” before some tangible action is taken, and here’s why.

We believe there is a high probability that investors might revisit lows of late ’18 as policy-makers dither. It seems unlikely that China would embark on a sufficiently large stimulus until later in ’19. As the state is on both sides of any transaction, nothing moves until the state significantly raises spending. At the same time, we don’t believe that just ending balance sheet reduction and pausing (Fed) is sufficient. Also, Europe might be paralysed until elections and changes in key portfolios (including ECB). The threshold required to go from normalization to liquidity injections is high; hence, pain is likely to rise.

Yet ultimately, Shvets contends that since no one is in a mutual suicide pact, the Macquarie strategist stays constructive for later ’19, yet concludes with the following lament that markets no longer function at all:

“If Benjamin Graham today applied to be a fund manager, he probably would be rejected. Investors no longer invest, but try to optimise (with limited success) against unpredictable & rapidly re-pricing signals.”

via RSS http://bit.ly/2SQSckg Tyler Durden

Risk-On Move Set To Dim?

Via Dana Lyons’ Tumblr,

The following is a complementary look at some of the evidence behind our recommendation to TLS members to trim some of their recently added long exposure.

Risk indicators are on the rise, but it may be time to take some risk off.

The so-called “risk-on” move in stocks continues, with the market building on gains made since we issued our “once a decade” short-term buying opportunity a few weeks ago. However, while the risk-on bounce certainly may have further to go, the evidence is starting to pile up in favor of at least reducing some long stock exposure at this juncture. Some of that evidence relates to various “risk indicators” tied to the stock market that we like to monitor.

As we have mentioned in the past, in analyzing risk in the market, we predominantly rely on quantitative models that we’ve developed over the years. However, there are other indicators that we’ve found helpful in instructing us as to the “risk-on” vs. “risk-off” situation in the market, including high yield bonds, high-beta stocks and small-cap pure value stocks. These indicators can provide helpful clues as to the potential strength or durability of market rallies.

For example, in mid-August, we noted the following regarding the gathering risk being signaled by these indicators.

“Taking stock of the combination of these 3 “risk-on/risk-off” measures, we find adequate reason for some concern. There are certainly enough positives in the market to maintain moderate long exposure to stocks. Furthermore, the broad market would appear to be setting up for a breakout to new highs. However, given the status of these risk indicators, an aggressive play on the potential breakout is probably not warranted. Furthermore, should the broad market break out, and these risk measures fail to follow along, it could be an indication of a likely failed, or temporary, breakout.”

Indeed, the broad stock market would break out to new highs in the final days of August — and immediately fail from there. The failure would, of course, precipitate the sharp fall selloff.

In late November, we shared another post assessing the message behind the behavior of these risk indicators. While stocks had already sold off a significant amount, our conclusion based on poor action in these risk indicators was that further downside was likely prior to a substantial low:

“While the stock market correction has certainly wrung out some of the excess risk that we were warning about in late summer, it does not appear to be enough to yet lay the foundation for an intermediate-term low and a new durable rally. The status of the 3 key risk indicators above each indicate a continued elevated level of risk in the stock market at this time. Therefore, our focus would not yet be on significantly increasing equity exposure in anticipation of an impending successful re-test of the October low. Rather, we will continue to be more focused in the near-term on reducing exposure, or hedging into any near-term market strength.”

Obviously the market plunge would continue — and even accelerate — throughout the month of December.

The first signs of life from the risk indicators occurred early this year as the market was attempting to find a bottom. Often it begins with some resilience in these measures, even in the face of overall market weakness. We tweeted evidence of that resilience during the first 2 days of the year when the market gapped down hard on consecutive days, yet the risk indicators held up well:

Sure enough, that resilience led to a 3%-4% jump in stocks the next day — and a continued rally since.

So what message are these risk indicators signaling now? Well, as we said, while the market can certainly continue its rally — especially given how washed-out it got — the prospects of adding significant risk at the current time are not nearly as attractive as they were just a few weeks ago. In fact, given the proximity of prices on each of the risk indicator charts, it seems an opportune time to remove some equity risk — in particular, if you added aggressively a few weeks ago. Here’s what we’re looking at.

High-Beta: (Status: RISK ON…but hitting resistance)

We normally focus on the “high-beta” area of the market in relation to the “low-volatility” area. At the moment, that ratio is still in a downtrend, signaling risk-off. However, on an absolute basis, high beta, as measured by the Invesco S&P 500 High Beta ETF (SPHB), has been on a solid run. It is some 15% off of its late December low.

That run, though, has brought it up to several layers of potential resistance near the 38.80 level, including:

  • The 38.2% Fibonacci Retracement of its September-December Decline
  • Its 50-Day Simple Moving Average
  • The Breakdown Level of its former lows from October-December

This might not be the end of the high-beta bounce — but this level very well could cause a temporary pause. Thus, it is a good spot, in our view, to remove some long exposure here.

Small-Cap Pure Value (Status: RISK ON…but hitting resistance)

When it comes to market “styles” (e.g., small, mid, large-cap and growth vs. value), the small-cap pure value style traditionally has the highest beta. And like the “high-beta” stock segment mentioned above, the S&P 600 Small-Cap Pure Value Index (SPSPV) typically leads the way in a legitimate risk-on market rally — and lower in a risk-off move. For example, the SPSPV led the market drawdown, first by topping in August, then with its relentless plunge.

Like the high-beta space, though, it too is enjoying a huge bounce — close to 20%, in fact, from its December low. However, it also is testing several layers of potential resistance near the 6430 level, including:

  • The 38.2% Fibonacci Retracement of its August-December Decline
  • Its 50-Day Simple Moving Average
  • Its 1000-Day (200-Week) Simple Moving Average

Again, while this resistance doesn’t have to be the death-knell of this bounce, it does signal to us a prudent spot to take some profits in this area as the going may get a bit tougher from here.

High Yield Bonds (Status: RISK ON…but hitting resistance)

Lastly, we have the high yield bond market. As high yield represents the riskiest of all bonds, the space actually trades in concert with equities much of the time. Thus, when high yield bonds are rallying, it is indicative of risk-taking, which generally includes a rallying stock market. That has been the case over the past few weeks, following a relentless autumn decline that hardly paused until the late December lows. As measured by the iShares High Yield Bond ETF (HYG), the space is up over 5% in just 2 weeks, an enormous move for high yield bonds.

However, like the prior 2 indicators, the HYG is also encountering potential resistance near the 83.85 level, including the important 61.8% Fibonacci Retracement of its August-December decline.

If you happen to be long this space, it makes sense to us to de-risk, or remove some exposure here as well.

*Bonus*: VIX (Status: Testing support)

While the volatility market isn’t necessarily one of the “risk indicators” that we track, it certainly can be useful in gauging appropriate risk. Presently, the S&P 500 Volatility Index, or VIX, is testing what may be key support near 20 in the form of the 61.8% Fibonacci Retracement of its August-December rise (stock volatility expectations generally move opposite price).

Should the VIX hold here, at least temporarily, it could signal at least a pause in the stock market bounce.

Aggregate Conclusion: RISK ON — but take some off

The stock market may well continue in the short or intermediate-term. However, to the extent that there was “easy” risk-on money to be made at the late December lows in the market — that has likely been realized. The proximity of the risk indicators suggest that the going may get tougher for stocks from here. Thus, while it doesn’t mean that we need to completely switch to risk-off mode, it does make sense to at least dim the risk-on levels a little bit here.

*  *  *

For updates on these risk indicators as well as market levels, timing and investment selection, continue to monitor our Daily Strategy Session videos. If you are interested in an “all-access” pass to our research and investment moves, we invite you to further check out The Lyons Share. Given an treacherous emerging market climate, there has never been a better time to reap the benefits of our risk-managed approach. Thanks for reading!

via RSS http://bit.ly/2Fs8jkE Tyler Durden

World Rolls Eyes As Musk Claims Tesla’s New Roadster Will “Do Something Like” Hovering

At this point, it’s difficult to even figure out what the lede is for this story: that Elon Musk Tweeted out something that sounds absurd or that the media instantly picked it up and ran with it without much inquiry as to its validity.

Regardless, on Wednesday, after being prompted by an animated GIF of the famous time machine from Back to the Future 2, Musk took to Twitter to make the claim that that the new Tesla Roadster will “do something like” hovering off the ground. Here is Musk’s Tweet from Wednesday:

And naturally, nobody on the internet could figure out whether or not Musk was being serious…

until he replied that he was not joking around. 

Musk also went on to say that the car will be able to accelerate “at the limit of human endurance” and that it would be able to cover a quarter-mile in less than eight seconds. What most people don’t know is that this is not the first time that Musk has hinted about a SpaceX option for the new Tesla Roadster. Back in June, he said “Maybe they will even allow a Tesla to fly…”:

Of course, both Musk and the media immediately had their skeptics and debunkers on Twitter. Musk’s claim that the car will “use SpaceX cold gas thruster system with ultrahigh pressure air in a composite over-wrapped pressure vessel in place of the 2 rear seats” invited critiques from one mechanical designer, while others just cracked jokes:

The company has been planning on bringing a new Roadster to the market that will be the quickest and fastest production car ever made. They have planned for a release in 2020 and – surprise the company is already taking reservations for the $200,000 base version of the car with $50,000 deposits.

We can’t wait to see if reservation holders are given the new hovering capabilities that they’ve now been promised by Musk. We also can’t help but wonder if Tesla’s new General Counsel approved this Tweet from Musk before it was put out. Oh, and by the way, have we mentioned that the company has yet to produce a $35,000 base price Model 3, as was promised years ago?

via RSS http://bit.ly/2FmgFeb Tyler Durden

The Moment Powell First Realized The Fed Is Held Hostage By The Market

When Chair Powell last Friday shocked traders when he said that, contrary to what he had said just two weeks prior during the December FOMC press conference, the Fed could be “patient”, rate hikes could, in fact “pause”, and the Fed’s balance sheet reduction is not in fact on “autopilot”, the Powell Put finally emerged for the first time, and the result has been a torrid rally ever since.

It also prompted an avalanche of accusations that Powell folded like a cheap suit, held hostage by traders who pushed stocks low enough to i) test where the Powell Put strike price is and ii) force the Fed to halt its rate hikes, something it has now effectively done.

And yet, being held hostage, or captive, by the market is nothing new to Powell; in fact, it was way back when in March 2013, ahead of the Fed’s taper announcement, that the Fed chair first realized that it was not the Fed that controls the market, but rather – after years of ZIRP and QE – the Fed had become a hostage of the market’s every whim.

What follows is one of Powell’s recurring warnings about the size of the Fed’s growing balance sheet, in which he not only argued about the potential for massive book losses when rates pike (and associate political risks), and that the lack of clarity around when the Fed would stop its asset purchases was itself a financial stability risk, but explicitly stating what Powell himself would experience nearly 6 years later: that the Fed is now a puppet to the market.

With inflation under control, I have the same two main concerns as others.  The first is that our policies will push the markets too hard, and that the result will be an unexpectedly sharp increase in rates as normalization approaches and damage to the real economy.  I see that risk as manageable for now but increasing materially with the size of the balance sheet.

I also see it as principally a risk of market dynamics and not one that is easily captured by our model.  The second major cost, again, is that of the realization of losses, low remittances, and depleted capital.  And I want to say that I think this scenario captures my concern.  It’s in one of the many memos.

We buy another $500 billion, which gets us to $1 trillion starting on January  1, 2014.  Rates are 100 basis points higher. The first part of that is a near certainty at this point, it seems to me, at least in the market’s expectation. The second is quite plausible. That gives us five years of zero remittances, $300 billion in losses, and we sprout a deferred asset of $63 billion in 2019.  I’m very uncomfortable with that for the political risk reasons that have been elaborated.

* * *

I have one final point, which is to ask, what is the plan if the economy does not cooperate? We are at $4 trillion in expectation now. That is where the balance sheet stops in expectation now.  If we have two bad employment reports, the markets are going to move that number way out. We’re headed for $5 trillion, as others have mentioned.  And the idea that President Kocherlakota said and Governor Duke echoed— that we ’re now a captive of the market — is somewhat chilling to me.  I think we need to regain control of this, or we will be moving out on that if the economy doesn’t cooperate.  There’s some material part of the probability distribution that is not covered by a plan, in my view.  The way to get at it is to increase flexibility, starting now, around the plan for the existing prongs: the costs and the risks, and what constitutes a substantial improvement.  I think both of those need to be communicated better to the public in a way that increases our flexibility to do something, because if the economy doesn’t cooperate, I don’t know what we do.  The problem has been, and is, the open-endedness of the plan.  And I would say , in closing, that the risks may be manageable at $4 trillion, but at $5 trillion , you’re in a different league.  There has to be convexity in this.

And so, almost six years after Powell first defined precisely how the Fed is now a captive of the market in March 2013, Fed Chair Powell just got to experience it first hand.

via RSS http://bit.ly/2Rmw6cJ Tyler Durden

“Definitely Risk On” As Investors Plow Billions Into Risk Assets

After record equity fund outflows in December, which saw hedge funds throw in the towel and liquidate hitting any bid they could find, which resulted in the worst December for the S&P since the great depression, “there’s definitely been a change in tone, and it’s definitely risk on,” portfolio manager Matt Kennedy at Angel Oak Capital Advisors told Bloomberg. “This reversal has reinstilled some of the confidence the market had prior to October that the expansion can continue.”

Sure enough, according to the latest EPFR data collated by Bank of America, in the week after the bank’s “Buy Signal” was triggered on January 3, there was a whopping $7.2 billion inflows into bonds, $6.2 billion into equities, and $1.1 billion into gold as investors scrambled to reallocated funds to both risk assets and safe havens.

As BofA notes, investors bought a little bit of everything including international equity funds ($3.8bn), government bonds ($3.6bn), EM bonds ($2.4bn), EM stocks ($2.4bn), and HY bonds ($1.5bn), even as they still sold financial stocks ($1.5bn), IG bonds ($1.4bn), and tech stocks ($0.6bn), although one wouldn’t know it by looking at the performance of FANG stocks in the first two weeks of the year.

Furthermore, as BofA’s chief investment strategist Michael Hartnett notes, investor feedback to the bank’s “buy signal” was initial skepticism on size & duration of rally and obsession with “is this the Big Low?” which however quickly morphed into “chase via stocks in EM & US”… if not Europe. Additionally, few are bullish tech & financials suggesting that the recent rally in tech has been largely a short squeeze. Meanwhile “leadership” remains a major issue, as do fears that we are in a “late-cycle”, coupled with questions on “what can sustain rally?”

For now, however, these questions remain on the back burner as BTFD has returned with a bang in a week that saw the first high-yield bond issue in six weeks as Targa Resources came to market with a $750MM bond issue, ending a record 40-day drought for bonds. And lo and behold, the offering was so greatly oversubscribed, the final deal was doubled in size to $1.5 billion.

There was also a burst of euphoria in the IG space where investors ignored the latest fallen angle as PG&E was cut 5 notches by both S&P and Moody’s to deep junk, and poured in nearly $40 billion of orders for a bond offering from AB Inbev on Thursday. This also lead InBev to upsize its offering to $15.5 billion.

More importantly, leveraged loan outflows are abating, and after several weeks of record outflow, last week saw just $0.4BN in bank loan outflows, helping prices recover across the board as investors regain confidence that the economic expansion has more room to run.

And as one would expect, banks are seizing the opportunity to offload risky corporate loans that they were unable to sell in December, enticing buyers with discounts and better terms.

Still, as Bloomberg notes, the rally has many strategists asking “how long it will last.” Leveraged loans are unlikely to continue the ride because the best of the credit cycle is behind us, Bank of America said this week. In the high-yield market, where spreads have tightened by a whopping 75 basis points since the end of the year, any further rally “is likely to be limited and more gradual,” UBS strategists said this week. In the high-yield market,  where spreads have tightened 75 basis points since the end of the year, any further rally “is likely to be limited and more gradual,” UBS strategists said this week.

Attempting to answer the $6.4 trillion question (roughly the size of the IG market), i.e., “what sustains the risk rally”, BofA’s Hartnett offers two possible answer:

  • Inflows to credit funds signaling Fed has short-circuited vicious cycle of higher credit spreads & weaker growth; past 8 weeks has seen a significant $62bn of outflows from IG+HY+EM debt (Chart 1).

  • “Green shoots” in Asia/European macro as oil collapse/policy stimulus works signaling global PMI’s (latest 51.5) not entering “bust” territory (sub-50) & global EPS growth stays positive 2019 (Asian exports & activity best lead indicators – Chart 3).

So until we await these two signals to hit, Hartnett has two trade recos: Own the “Credit” theme, Rent the “Cyclical” theme.

  • Rates have peaked: Fed has capitulated; inflation expectations are falling; moment of Maximum Quantitative Tightening will be end-March (CB balance sheets growth to trough in Mar’19 @ -$0.4tn YoY – Chart 4); note EM credit already leading EM stocks higher (Chart 5).

  • Own “credit” theme: yield of blended portfolio of global HY, EM $-debt, US IG, US bank loans, US preferred jumped from 3.7% to 5.4% past year – now attractive (Chart 6); 3% “big top” in yields negative banks (Chart 7), very positive homebuilding stocks & small cap too.

via RSS http://bit.ly/2ROfrhW Tyler Durden