“Did He Wear A Wire?”: Former Trump Campaign Advisor Pleaded Guilty To Lying To FBI

It's only 10:30 am on the East Coast and already today is shaping up to be one of the most consequential days of the Trump presidency.

In addition to the news that former Trump campaign executive Paul Manafort and his longtime deputy, Rick Gates, have been indicted on 12 counts including tax fraud, money laundering, failing to register as a lobbyist for a foreign country, and conspiring against the US, unsealed court documents have revealed that former Trump campaign adviser George Papadopoulos pleaded guilty on Oct. 5 to making false statements to the FBI.

Noting that the Russian government often uses foreign intermediaries to accomplish its foreign policy goals, the FBI said it investigated Papadopoulos, who served as a foreign adviser for the Trump campaign starting on March 2016 and continuing through most of the campaign, for any such contacts. This investigation included an interview in January 2017. According to the indictment, there is probable cause to believe that on Jan. 27, Papadopoulos made material false statements and omitted material facts to the FBI regarding his interactions during the campaign with foreign contacts, including Russian nationals.

Specifically, he falsely described his interactions with a certain foreign contact, identified as a professor, who discussed "dirt" related to emails concering then-presiential candidate Hillary Clinton, when in fact, he had repeated communications with that contact while serving as an adviser on the campaign.

Papadopoulos also shut down a Facebook account following a second interview in February. The account included communications with foreigners including Russian nationals – thereby obstructing the FBI's investigation. 

A self-described energy consultant, Papadopoulos was the youngest and least experienced member of the small foreign policy team Trump abruptly formed last March after coming under criticism for his lack of foreign policy expertise. Furthermore, the Washington Post reported that in at least half a dozen email requests sent between March and September 2016, adviser George Papadopoulos urged Trump or senior members of his campaign to meet with Russian officials. Some of those emails were read to the newspaper by a person with access to them.

These newly surfaced emails mark the latest in a long string of examples of the Trump team’s efforts to establish direct communication with Russia during the 2016 race.

In one, Papadopoulos offered to arrange “a meeting between us and the Russian leadership to discuss US-Russia ties under President Trump,” as quoted by the Post.

The question now is what has Papadopoulos "given" the government as part of the plea agreement, and whather he has "flipped" on Trump:

Former US Attorney Preet Bharara says the FBI appears to have found a cooperating witnes in Pap – which is significant.

In his plea agreement, the government says it will offer leniency to Pap in exchange for his cooperation, and that sentencing will be delayed before cooperation is completed.

Finally, as The Smoking Gun asks, "did George Papadopoulos agree to wear a wire or make any FBI-monitored calls?"

Here's Pap's plea agreeement:


….and the criminal complaint
 

via http://ift.tt/2zYj3lD Tyler Durden

The World’s Five Largest Bond Markets Are Syncing Up For Disaster

Another major economy is facing the ugly prospect of rising inflation.

A central theme in our analysis of The Everything Bubble is that Central Bankers are focused on only one thing: maintaining the bull market in bonds at all costs.

The reasons are as follows:

1)   Bonds are what finance the Government’s massive entitlement spending/ welfare programs.

2)   With massive ownership of bonds thanks to over $15 trillion in QE, Central Banks are extremely exposed should bonds collapse (and yes, Central Banks can go bust).

With that in mind, we’ve been guiding our clients to focus on the dangers of rising bond yields due to surging inflation globally. Rising bond yields= falling bond prices. Falling bond prices=the bond bubble could burst.

And a bursting bond bubble= SYSTEMIC reset as entire countries go broke (think Greece in 2010).

On that note, China is the latest major economy to see its bond yields rise as inflation takes hold.  Yields on China's 10-Year Government bond are breaking out to the upside as I write this.

With China now experiencing higher bond yields (higher borrowing costs in the bond market), all FIVE of the world's largest bond markets are warning of rising inflation: the US's, Japan's, Germany's, and the United Kingdom's bonds are all flashing "DANGER" with multi-year breakouts occurring in their 10-year bond yields.

The above chart is telling us in very simple terms: the bond market is VERY worried about rising inflation. And if Central Banks don’t move to stop hit now by ending their QE programs and hiking rates, we’re in for a VERY dangerous time in the markets.

Put simply, BIG INFLATION is THE BIG MONEY trend today. And smart investors will use it to generate literal fortunes.

Imagine if you'd prepared your portfolio for a collapse in Tech Stocks in 2000… or a collapse in banks in 2008? Imagine just how much money you could have made with the right investments.

THAT is the kind of potential we have today. And if you're not already taking steps to prepare for this, it's time to get a move on.

We just published a Special Investment Report concerning FIVE secret investments you can use to make inflation pay ou as it rips through the financial system in the months ahead

The report is titled Survive the Inflationary Storm. And it explains in very simply terms how to make inflation PAY YOU.

We are making just 100 copies available to the public.

To pick up yours, swing by:

http://ift.tt/2knowyr

Best Regards

Graham Summers

Chief Market Strategist

Phoenix Capital Research

via http://ift.tt/2ifgYK5 Phoenix Capital Research

“Sacre Beurre” – Global Butter Prices Triple As Shortages Hit France

 It’s not received much attention, but global butter prices have roughly tripled since Summer 2016 as production cuts have hit supply…

According to Bloomberg, global butter prices have almost tripled to 7,000 euros ($8,144) a ton from 2,500 euros in 2016, according to Agritel, an Paris-based farming consultancy. In Europe, prices peaked at about 6,500 euros a ton in September, the highest since the European Commission began collecting such data in 2000…The problem can be traced to the end of (EU) milk-production quotas in April 2015 that led to a glut early last year in Europe, and a drastic drop in prices. This prompted production cuts by spring this year. The reduction coincided with other global milk products exporters curbing their own output: the U.S. stopped selling abroad to address higher domestic demand while New Zealand, the world’s biggest dairy exporter, experienced lower production due to droughts, Pierre Begoc, an Agritel analyst, said in a phone interview.

This chart, from the Global Dairy Trade’s website shows that butter prices (in dollars) remain close to the recent high. 

Bloomberg notes that the world’s biggest per capita consuming nation, France, is experiencing shortages.

France’s much-loved croissant au beurre has run up against the forces of global markets. Finding butter for the breakfast staple has become a challenge across France. Soaring global demand and falling supplies have boosted butter prices, and with French supermarkets unwilling to pay more for the dairy product, producers are taking their wares across the border. That has left the French, the world’s biggest per-capita consumers of butter, short of a key ingredient for their sauces and tarts. “The issue is purely French and is related to the fact that there’s a price war raging between French retailers,” Thierry Roquefeuil, chairman of the milk-producers’ federation FNPL, said in a phone interview from his farm near Figeac, in Southwestern France. “French retailers refuse to increase prices, even by few cents, even for butter. Dairy producers see that there’s an outside demand at higher prices so they sell abroad, and rightfully so.”

It's become a political issue in France.

While France’s Food Retailers’ Federation is underplaying the shortages as a temporary logistical problem linked in part to people hoarding butter, the issue made it last week to the floor of the French parliament. Questioned by lawmakers, Agriculture Minister Stephane Travert said he hoped a deal could soon be found between retailers and dairy producers. “I want to reassure all the consumers that soon butter will find its way back to shop shelves and consumers won’t be deprived of this French commodity that does honor to French tables and is the pride of French dairy production,” Travert said in the National Assembly on Wednesday. A report released Saturday by the consulting firm Nielsen showed that 30 percent of butter demand in French supermarkets wasn’t met between Oct. 16 and Oct. 22. The proportion was as high as 46 percent in some stores, mostly due to hoarding, it said.

Bloomberg delves into the shift in supply and demand dynamics in more detail.  

“The butter shortage in French supermarkets is the direct consequence of the 2016 milk crisis which prompted a 3 percent drop in production,” Xavier Hollandtsni , a Kedge Business School strategy teacher and an expert on agricultural matters, said in a note Thursday.


The butter market also encountered a push from the demand side. Butter and cheese remain the dairy products in highest demand, especially in Asia, according to Agritel’s Begoc.


“Global demand started to pick up, with China starting to buy again after having stopped for a few months to tap into its stocks, leading to a substantial rise in milk and butter prices,” Begoc said. French retailers have not adapted to the new market reality and have kept a cap on prices, Roquefeuil said. For French dairy companies, it’s easier to export to countries such as Germany, where retailers are willing to pay a higher price, he said. “There’s an evolution of butter consumption,” he said. “Demand is strong and the industry has to adapt to the new consumption.”

Below is a photograph of empty shelves in a French supermarket in the last few days, courtesy of the BBC.

The BBC report asks,

Can it really be true that the French are running out of butter? That the country with the second biggest dairy sector in Europe (after Germany) is incapable of providing households with such basic culinary fare?

And concludes…

The answer is yes… and no.

Yes – there are indeed butter shortages in French shops. Shelves are emptying. Supermarket own-brands have become scarce, and often it is only possible to find more expensive varieties for sale. A sign in my local supermarket reads: "The butter market is facing an unprecedented shortfall in raw materials which is causing supply problems to this store." There is no butter crisis. If you need butter, you will find it. But it is obvious to all that the system is not functioning as it should do. Something is going wrong…

In other countries like Germany, supermarkets have responded to the changing world butter market by putting up their prices. In France, the cost to the shopper of a pack of butter has barely changed. This is because butter prices are set annually in France, in negotiations between supermarkets and producers. The next round of talks is not due until February, so until then the supermarkets are only offering to pay what was agreed nine months ago – when butter was much cheaper. French producers are not foolish. They can see that the world market is much more attractive than the domestic market. So they are saying "non" to the supermarkets, and selling their stock abroad. So this is why the answer to the question – is there a shortage of butter in France? – is both yes and no.

Once the current hoarding by consumers abates, Bloomberg expects butter to return to French supermarkets. However, Pierre Begoc of the Agritel consultancy expects that butter prices will only “head down slightly”, as milk production recovers. It’s another example of the theme of rising costs for essentials items that never seem fully reflected in official CPI statistics. Indeed, we are confident that government bean counters have perfected methods to substitute, or hedonically adjust, unhelpful threefold price increases.

via http://ift.tt/2iLJhUm Tyler Durden

European Bond Yields Are Crashing

It appears Draghi has done it again. Since last week's dovish ECB QE taper, European sovereign bond yields have plunged and today are accelerating notably lower with Italian 10Y yields crashing 10bps to 2017 lows


This is the lowest yield since the start of the year…


Even Spanish debt is bid…


And Catalan debt is also being bought..


However, Spain is at its riskiest compared to Italy in 12 months…

Once again Draghi proves – "It's not the economy, stupid"

via http://ift.tt/2z1QZzD Tyler Durden

The “Fat Pitch” & Miss

Authored by Lance Roberts via RealInvestmentAdvice.com,

While I remain long and invested in the markets on behalf of my clients, I focus and write about the significant risks that are currently present. I am fully aware a laissez-faire attitude towards these risks is ultimately likely to destroy large portions of my clients hard-earned, and irreplaceable, investment capital.

Note: Myself, and everyone that writes for Real Investment Advice, do so under our actual name. We pride ourselves on our transparency, and our responsibility, to all that read our work. We value our loyal following and work diligently to improve upon the original ideas and research we share.

This past week, I was treated to a chart from “The Fat Pitch” blog, by Urban Carmel, which took several pieces of my previous writings out of context to try and suggest that I somehow had “missed the market.”

“Yet, throughout this period, investors with even a passing interest in financial news have regularly seen commentary from experienced managers that the stock market is highly likely to plunge now. The irony of equity investing is this: if you knew nothing about the stock market and did not follow any financial news, you have probably made a very handsome return on your investment, but if you tried to be a little bit smarter and read any commentary from experienced managers, you probably performed poorly.”

While I certainly appreciate the “buy and hold” crowd trying to justify why you should just take a blind approach and hold on for the ride, I struggle because I am all too aware when market shifts occur, as proven in 2000 and 2008, years of gains can be wiped out in months.

By taking commentary out of context from the managers noted above, it misses the actual investment management process being undertaken by myself as well as some of the other individuals listed. What he left off the chart above from myself are prescient market calls such as:

  • December 2007:  “We are, or are about to be, in the worst recession since the ‘Great Depression.'”
  • February 2009: “Here are 8-reasons for a bull market.”
  • March 2012: “Coming This Fall, The Best Time To Invest”
  • March 2013: “Time to get out of Gold.” 
  • June 2013: “Pimco says bond bull market is over, I say it is still alive”
  • April 2014: “Time to get out of Energy.”
  • August 2015: “Why This Time Could Be Different” (Warned of the coming 2015-16 correction)
  • October 2016: Technically Speaking: 2400 or Bust

You get the idea.

And yes, as noted in the chart above, I did warn about things that didn’t come to pass, such as the correction in 2015-2016 was only a 20% decline, and despite plenty of economic evidence which suggests it was a “mini-recession,” it was never officially labeled that way…yet.

So, I was wrong. I apologize.

Importantly, however, by reducing equity risk during the 2015-2016 period, I saved my clients the stress of the decline and preserved their investment capital which was reallocated back to the equity markets when the correction passed.

There have also been times along the way that portfolios I manage were underweight equity when, in hindsight, completely ignoring risks, would have provided a slightly better rate of return. That too, is an acceptable outcome given the potentially devastating consequences. Successful investment professionals must adhere to discipline and respect one’s evaluation of risk, even at the cost of missing some upside.

That is what “managing a portfolio” means, and also why client’s pay me to do it.

If simply “buying and holding” an index is indeed the way to manage money, as suggested by Carmel, then why would you ever “pay a fee” to someone to do that for you? You can do it yourself from roughly 0.25-0.30% at Vanguard.

You Don’t Have The Time

The reason this is so important, as I have exhaustively written about, is the math of loss, and time

While writers like Urban Carmel, and many others promulgate the idea of “buy and hold” investing, they misunderstand, and more importantly dismiss, the mathematics of the investing cycle despite claiming an “evidence based investing” approach.

To wit from Urban Carmel:

“In the past 193 years, US equities have suffered an annual loss greater than 20% just 9 times, a “base rate” of 4.7%. The “base rate” is the probability you would assign to an outcome if you knew nothing other than how often it was statistically likely to happen (from basehitinvesting.com).”

Now, those statistics are absolutely right. The issue is that looking at percentages is incredibly deceiving. Being up 80%, and then down 50%, doesn’t leave you 30% ahead, but rather 10% behind. More importantly, you have lost precious time, often measured in years, in your wealth accumulation process. As I previously discussed in “The World’s Most Deceptive Chart.” 

“The first chart shows the S&P 500 from 1900 to present and I have drawn my measurement lines for the bull and bear market periods.”

The table to the right is the most critical. The table shows the actual point gain and point loss for each period. As you will note, there are periods when the entire previous point gains have been either entirely, or almost entirely, destroyed.


The next two charts are a rebuild of the first chart above in both percentage and point movements.


Again, even on an inflation-adjusted, total return, basis when viewing the bull/bear periods in terms of percentage gains and losses, it would seem as if bear markets were not worth worrying about.”

“However, when reconstructed on a point gain/loss basis, the ugly truth is revealed.”

This was a point Michael Batnick addressed, but dismissed:

“However, ‘stocks usually go up’ also implies that sometimes stocks go down, and sometimes they go down a lot, which is supported by the *chart below. This is why it can also pay for financial pundits to play on the bearish side. Usually they’re wrong, but when they’re right, they get to say “I told you so.” They saw what few others did, and this can provide them with an open invite from the media for the rest of their career.”

“The fact that stocks usually go up makes permabulls look like idiots once in a while and permabears look like geniuses once in a while.”

What Michael misses is that while markets DO rise the majority of the time, the drawdowns that follow wipe out a large chunk, and sometimes all, of the previous gains.

No Excuses

For actual portfolio managers, it is never about being able to say “I told you so.” 

It is about NOT having to face a client who are in, or near, retirement and trying to explain how the loss of 20, 30 or 40% of their capital will eventually come back.

Why should the client be upset they just witnessed a significant chunk of their life savings vanish? The mainstream “buy and hold” crowd will simply rely on the excuse:

“Well…NO ONE could have seen that coming.” 

Not only is that oft-used comment simply not true, it is complete negligence of their duty as the clients fiduciary.

Me…I am no one important. I run a small portfolio of clients in Houston and simply write about what I am doing for them. However, there are many very smart managers from Ray Dalio, to James Grant, Jeremy Grantham, Howard Marks, Mark Yusko, Jesse Felder, and Michael Lebowitz all suggesting “something wicked this way comes.”

You have been sufficiently warned.

It may not be today, next month or even next year.

“Bull markets are built on optimism and die on exuberance.”

But they all die. Simply ignoring history won’t make the damage any less catastrophic

Of course, given that investors are just “mere mortals” and do not have an infinite amount of time to reach their financial goals, the end of bull market cycles matter, and they matter a lot.

While “perma-bulls” may enjoy taking stabs at portfolio managers that take their risk management and capital preservation responsibilities very seriously, it should be done without taking those comments out of context.

Have I warned of risks in the markets?

Absolutely.

Does that mean I have somehow been sitting in “cash” this whole time and “missing out?” 

Absolutely Not.

Every single week I publish a newsletter on our site which updates our risk management analysis and exposure model. The model adjusts equity risk relative to the price trends and risks prevalent in the market. As you will notice, more often than not, the risk reduction provided protection against declines, protecting capital and reducing volatility. (If you would like access to it to see for yourself CLICK HERE and it will be in your inbox next week.)

I have constructed an analysis of the model above showing a 60/40 stock/bond allocation risk-adjusted as compared to just “buying and holding” an index.

To date, the “buy and hold” crowd still have not made up for the ground they have repeatedly lost along the way. Sure, they made money, but not as much as by just simply managing risk to some degree along the way with significantly reduced volatility.

Importantly, we are all trying to predict the future. No one will ever be right all the time.

Lord knows I have more than once in my career written a “mea culpa,” and I am sure that I will write many more before I am done with this business.

However, what I will never have to do is look at a client across my desk and tell them “not to worry” about the 40% decline in their portfolio.

Yes, you will eventually get back to even if you don’t die first. But, getting back to even is NOT the same as achieving your financial goals.

Chasing an arbitrary index that is 100% invested in the equity market requires you to take on far more risk than you most likely want or can afford. Two massive bear markets over the last decade have left many individuals further away from retirement goals than they ever imagined. Furthermore, all investors lost something far more valuable than money – the TIME that was needed to reach their retirement goals.

But when you begin to see and hear the excuses of:

“Well….no one could have seen that coming.” 

Just remember, you deserve better.

via http://ift.tt/2igElmz Tyler Durden

“Bond Bears Have Had Their Fun”: Why One Trader Expects A Sharp Move Lower In Yields Next

Having correctly predicted the dovish relent by the ECB’s QE taper announcement last week, whose explicit “open-endedness” appeared to surprise many of his hawkish Wall Street colleagues, overnight Bloomberg macro commentators Mark Cudmore looked at bond yields and concluded that “bond bears have had their fun”, as “almost all upcoming risk events are skewed to drive 10-year Treasury yields lower rather than higher.

Among the key catalysts cited include the Fed’s next chair, where the “dovish option”, Powell appears to be a shoo-in, while tax reform is starting to once again look shaky: “The main reason 10-year yields aren’t already lower is due to optimism that a viable House tax bill will be released this week. “Optimism” and “viable” being the key words in that sentence.” According to Cudmore, “while we may see a tax plan this week, we’re still a very long way from having stimulative tax cuts passed, let alone flow into the economy. With optimism riding so high, disappointment seems more likely than a positive surprise.”

Then there is the “known unknown” of geopolitics: “we also have the real and imminent possibility of a renewed haven bid for Treasuries. Not only is there uncertainty about the Russia probe, with speculation that the first arrests could come as soon as Monday, but Trump is about to jet off to Asia, where he’ll have plenty of opportunities to riff on his pet topics of unfair trade and North Korea’s nukes.”

That said, Cudmore is confident one can ignore technicals at this point where much of the upside has already been priced in:

Economic data can provide some noise and volatility in both directions this week, but barring a major shock, the readings will be subsumed by other news.

As for technicals, he writes that “there was a bizarre amount of excitement around the 2.4% level in 10-year yields, thanks mainly to some prominent fund managers. But we were above that arbitrary level several days in May and for most of December through March.” And while he concedes that he is no technician “it seems that most fundamental catalysts are lined up to knock 10-year Treasury yields substantially lower.

In concludion, “bond bears have had their fun. Almost all upcoming risk events are skewed to drive 10-year Treasury yields lower rather than higher.

Judging by the recent move, and change in momentum, Cudmore may be right.

Full Macro View note below:

Everything Set for Treasury Yields to Slump: Macro View


Bond bears have had their fun. Almost all upcoming risk events are skewed to drive 10-year Treasury yields lower rather than higher. 


Whoever Trump nominates to be Fed chair, the decision is unlikely to support 10-year yields that have erroneously shifted higher on speculation John Taylor might be the pick. The two favorites, once again, are Powell and Yellen, who are perceived as dovish.


Even if Taylor is victorious, any headline jump in long-end yields won’t sustain. The fact that he’s seen as hawkish will prompt the curve to flatten sharply as premature hikes become feared. So the short-end may rise, but 10-year yields are likely to fall further under Taylor than anyone else.


The Fed will always retain optionality, and won’t guarantee a December interest rate hike this week. With such a move more than 85% priced in by rates markets, if there’s to be any surprise out of the FOMC meeting, it can only be dovish.


The main reason 10-year yields aren’t already lower is due to optimism that a viable House tax bill will be released this week. “Optimism” and “viable” being the key words in that sentence.

While we may see a tax plan this week, we’re still a very long way from having stimulative tax cuts passed, let alone flow into the economy. With optimism riding so high, disappointment seems more likely than a positive surprise.


Separately, we also have the real and imminent possibility of a renewed haven bid for Treasuries. Not only is there uncertainty about the Russia probe, with speculation that the first arrests could come as soon as Monday, but Trump is about to jet off to Asia, where he’ll have plenty of opportunities to riff on his pet topics of unfair trade and North Korea’s nukes.


Economic data can provide some noise and volatility in both directions this week, but barring a major shock, the readings will be subsumed by other news.


There was a bizarre amount of excitement around the 2.4% level in 10-year yields, thanks mainly to some prominent fund managers. But we were above that arbitrary level several days in May and for most of December through March.


I’m no technician but it seems that most fundamental catalysts are lined up to knock 10-year Treasury yields substantially lower.

via http://ift.tt/2gN7161 Tyler Durden

Falling Discount, Gold and Silver Get Powelled, Report 29 Oct 2017

Warren Buffet famously proposed the analogy of a machine that produces one dollar per year in perpetuity. He asks how much would you pay for this machine? Clearly it is worth something more than $1.00. And it’s equally clear that it’s not worth $1,000. The value is somewhere in between. But where?

This leads to the concept of discount (which we mentioned in Falling Productivity of Debt two weeks ago). A dollar to be paid next year is worth less than a dollar in the hand today. One reason is that we are mortal beings. In order to be alive next year, we must remain alive every single day between now and then. There are natural reasons for time preference—the desire to have a good today, and not postpone it. We are also not omniscient. Something may come up, such as an illness, which forces us to consume what we did not plan to consume.

Another reason is, of course, risk. Unlike the magic machine in our example, a business enterprise may cease to make money for any number reasons including a new competitor or changing customer preferences.

For many reasons, a dollar to be paid next year is not worth a dollar today. A dollar to be paid in ten years is worth even less. Future payments must be discounted. The discount is related to the interest rate, and it shares many of the same causes.

It can be quoted as a yield, if you look at earnings divided by share price. We aren’t going to go through the formula to discount future earnings into perpetuity here. However, the math works out. The current P/E ratio of S&P 500 stocks is 25.74. This is the same as saying the E/P ratio is 3.89%. If you discount a dollar of earnings every year into perpetuity, at 3.89%, you get 25.74. So we use discount rate and earnings yield equivalently, depending on context and the point we want to make.

The higher the price of the share, the lower the yield. With each halving of discount rate and hence earnings yield, the share price doubles. A nifty trick to create free money, eh? Just somehow lower rates and yields across the economy…

It should not be surprising that discount has been falling along with the interest rate. Let’s look at earnings yield again (ignoring dividend yield which is under the control of corporations, who have broad discretion to set the dividend, and hence not as clear a signal).
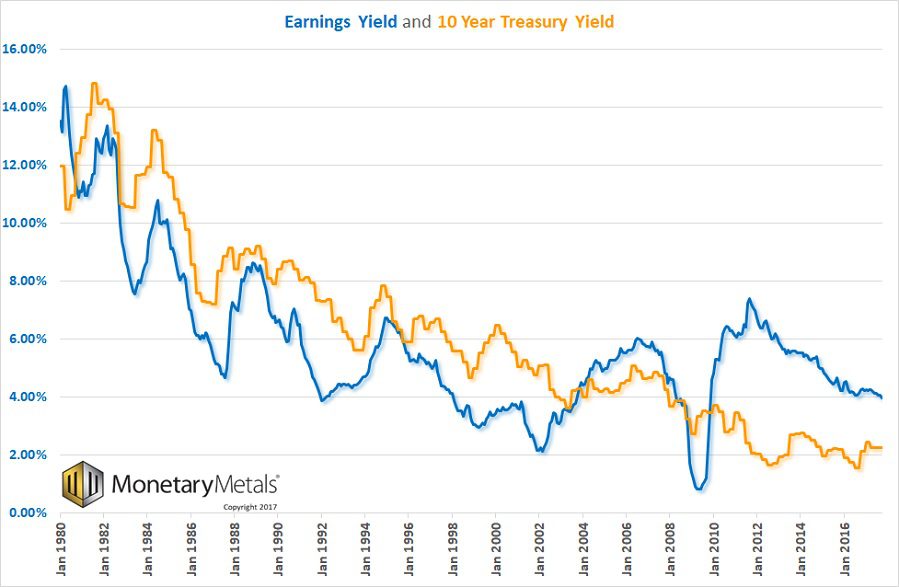
This chart is showing three things. First and most obvious, the earnings yield on stocks falls with the interest rate (as does marginal productivity of debt as we showed last week). And it makes sense, the more the Fed pushes down interest, then equities become more attractive. At least until their yields are pulled down closer to Treasury yields.

Second, yield purchasing power is falling. This is not how many groceries you could buy if you liquidate your stocks (as the mainstream view would have you think). It is how many groceries you can buy with the earnings of the businesses you own. Stocks are partial ownership of businesses, and as a shareholder you have a portion of the earnings. As yield purchasing power falls, it takes more and more capital to generate enough income to buy food. At the current level of 3.89%, if you need $50,000 a year to live, you need about $1.3 million worth of S&P shares.

And it’s actually worse than that. Corporations do not pay 100% of their profits to shareholders. At present, they pay out a bit under half of their profits. To live on the dividends, you would need about $2.7 million worth of shares. But as we noted above, equities incur significant risk that the business will become less profitable. Debt must be paid. Dividends are optional.

Third, and you probably saw this coming, discount is falling. The market price of that dollar of earnings way out in the futures, years away, is rising. It is saying that a dollar to be earned by the corporation in a decade, is worth over 67 cents today. And a dividend to be paid out in a decade is worth 83 cents.

I hardly think we would be alarmists or perma-bears to say that at such a low discount, investors have a razor thin margin of safety. This is without getting into the rising debt level to maintain even this profit. Nor the problem of borrowing to pay dividends.

We want to underscore one final point here. When the Fed pushes down interest rates, it manipulates discount and hence measurement of both time and risk. It is toying with powerful forces, which should not be toyed with. All the king’s horses and all the king’s men know little about the damage they wreak. They focus only on the rate at which consumer prices are rising, or perhaps GDP. Meanwhile, investors are forced to pretend that a bird 10 bushes away is worth almost as much as a bird in the hand.

We can only shake our heads again, and refer to the impotence of governments to repeal natural law with legislative law. We can only point to the example of King Canute. The tide did not roll back for his command, nor does time preference and discount bend to the will of King Fed.

We love to hate the expression “it’s not a problem until it’s a problem,” but it seems so apropos to the unsustainable trends of falling discount, rising corporate debt, and falling marginal productivity of debt.

The above, by the way, describes a process of consumption of capital. Of eating the seed corn (two processes, if you count corporate borrowing to pay dividends). With each new speculator buying shares at ever-higher prices, there is a transfer of wealth from the buyer to the seller. The seller receives it as income, and spends some of it. The sellers are consuming some of the buyers’ wealth. These buyers fork over their wealth in the expectation that new buyers will come along soon, and give them even more wealth.

This is also known as the wealth effect, without any apparent irony. The people it harms most, the owners of capital, seem to like it. The way a junkie seems to like heroin. It may be destroying him, but the euphoria blots out other considerations.

We will close with two separate thoughts about gold. These thoughts should be kept separate, as far too often proponents of buying gold (e.g. dealers) mix up monetary economics with the driver to buy the metal.

One, in a free market for money (aka gold standard), no one has the power to manipulate interest rates, hence asset prices, yield purchasing power, and discount rates. The time preference of the savers has real teeth. This is the principle virtue of the gold standard (not static consumer prices, aka inflation, which is neither possible nor desirable).

Two, the falling marginal productivity of debt and falling discount is pathological. If one wants to avoid (well, minimize) one’s exposure, then one buys gold. Not out of hopes of a higher price (and the same seed-corn eating process of speculation described above). But simply as the alternative to equities with too little discount, and bonds with too little interest.


The prices of the metals dropped a bit more this week, -$7 and -$0.16.

We all know the dollar is going down, that it is the stated policy of the Federal Reserve to make it go down. We all know that gold has been valued for thousands of years. So why do we measure the timeless metal in terms of paper currency? It should be the other way around. We therefore encourage people to think of the price of the dollar measured in gold, rather than the price of gold measured in dollars.

This week, the dollar was up to 24.43 milligrams of gold.

On Friday, we had a curious thing. A report came out that Jerome Powell, who is on the Board of Governors of the Federal Reserve, is now the leading candidate to replace Janet Yellen as Chairman. This was deemed by the market to be good for gold and especially silver. Powell is not only an establishment guy, he has been part of the decision making body which has brought you the monetary policy which has caused/coincided with the drop in the price of gold from $1,558 when he took office.

Presumably the reason why he is a candidate, and the reason why the gold market bid up the price of gold, is that he will continue the current central plan. This plan could be charitably dubbed “monetary largesse”. Notwithstanding the theory held by both the mainstream Fed apologists and alternative Fed critics, this policy has not resulted in skyrocketing prices of either consumer goods or gold. But no matter, the likely appointment of the mainstream insider (as opposed to the other leading candidate, John Taylor, who is an academic and not a Fed official) is good news. For gold. For now.

Despite that this same policy over the last 6 years has caused /coincided with falling and more recently sideways or weakly rising gold price action, Powell is deemed good for gold. Speaking of more recent weak rising price action, we know technical traders who see the small size of this move as proof of another down leg to come in the price.

In the short term, of course, the price will bang about due to such Kremlinology. In the long term, equally of course, the price will change due to the fundamentals. That is what this Report is all about. We have invested in many years of research and development (and a license to a tick history database that contains every bid and offer with sub-millisecond resolution, going back to 1996). The output of our data science work are graphs showing the internal structure of the market, with unprecedented accuracy and clarity.

Below, we will discuss both the long-term big picture supply and demand fundamentals, and the intraday action around the Powell news. But first, here are the charts of the prices of gold and silver, and the gold-silver ratio.
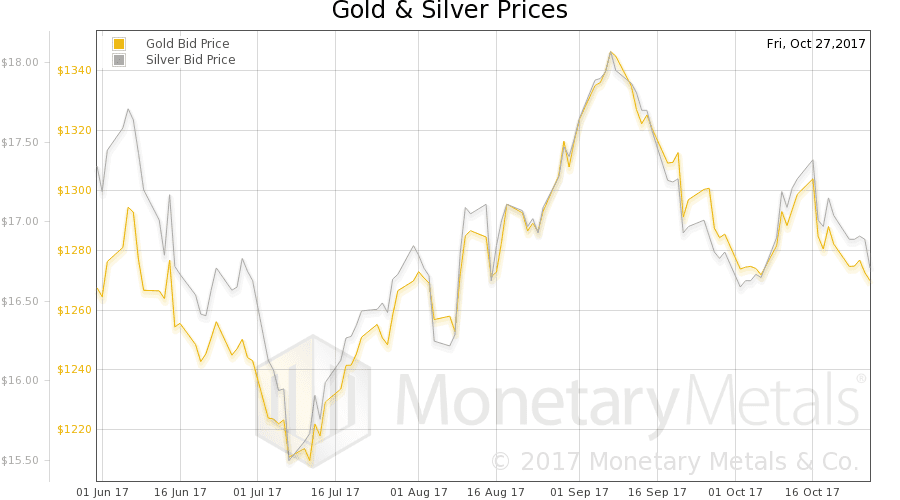
Next, this is a graph of the gold price measured in silver, otherwise known as the gold to silver ratio. The ratio rose.
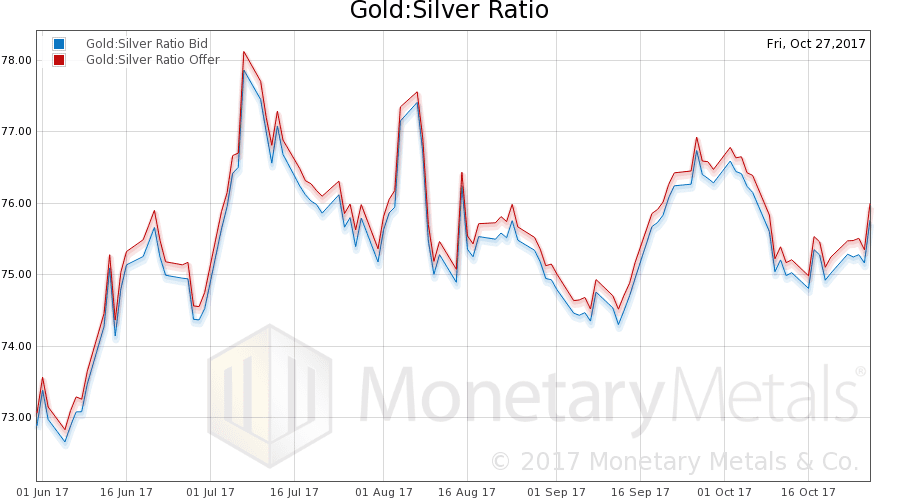
In this graph, we show both bid and offer prices for the gold-silver ratio. If you were to sell gold on the bid and buy silver at the ask, that is the lower bid price. Conversely, if you sold silver on the bid and bought gold at the offer, that is the higher offer price.

For each metal, we will look at a graph of the basis and cobasis overlaid with the price of the dollar in terms of the respective metal. It will make it easier to provide brief commentary. The dollar will be represented in green, the basis in blue and cobasis in red.

Here is the gold graph showing gold basis and cobasis with the price of the dollar in gold terms.
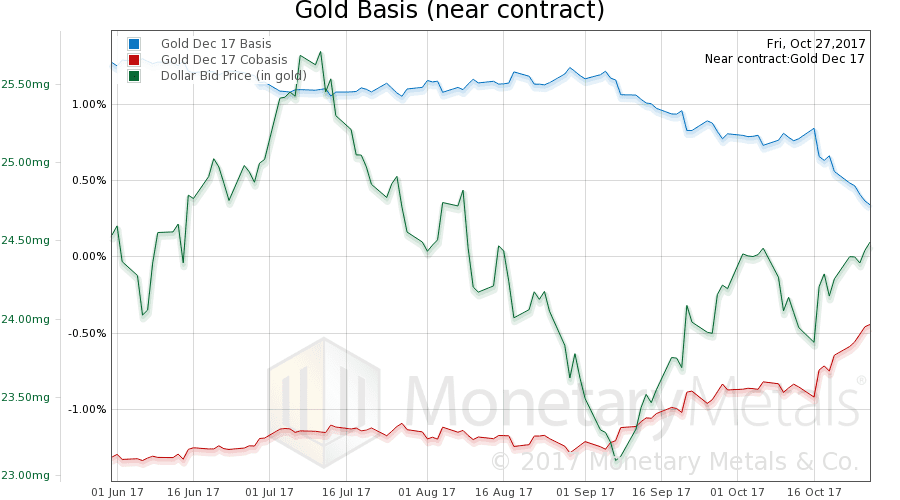
We see a rising cobasis (our measure of scarcity) along with a rising price of the dollar (i.e. falling price of gold, in dollar terms). This is not surprising; it is the typical pattern nowadays.

Our calculated Monetary Metals gold fundamental price fell $10 to $1,347.

Now let’s look at silver.
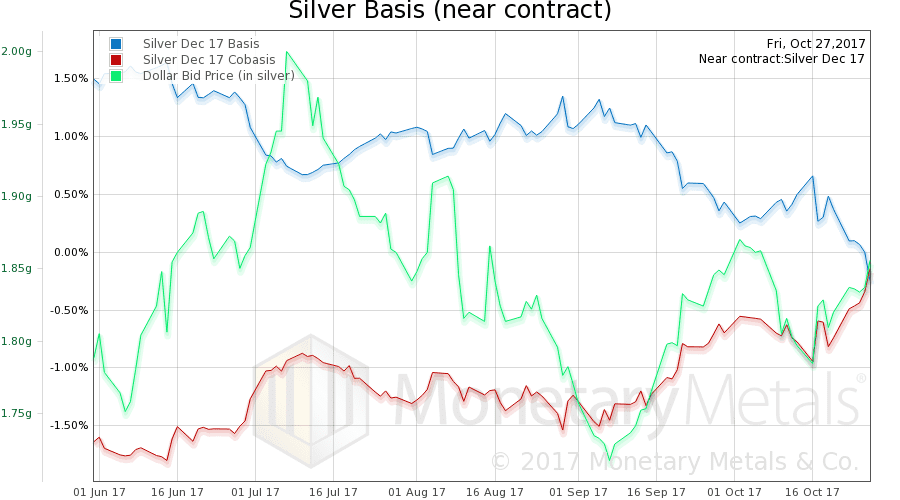
We also see a rising cobasis along with rising price of the dollar in silver terms (i.e. falling price of silver in dollar terms). Much of this rise is the mechanics of the contract roll, as traders start to sell the contract before expiry and buy the next month.

Our calculated Monetary Metals silver fundamental price fell $0.05 to $17.03.

Now, on to Friday’s “Powell Spike”. Somebody thought Powell would be good for gold. The price rallied four bucks in a minute, and then another three bucks within 8 minutes. But who? Was it stackers loading up on coins, prepping for inflatiocalypse? Or was it speculators loading up on leverage, betting on futures?

In Part II of this article, we answer this question by analyzing intraday graphs of the gold and silver basis.


© 2017 Monetary Metals

via http://ift.tt/2iLoRuw Monetary Metals

Spain Files Charges Against Catalan Government For Rebellion; Puigdemont Runs To Brussels

Spain’s Director of Public Prosecutions, Jose Manuel Maza, made a short statement this morning as he filed a suit against former Catalonian leader, Carles Puigdemont and his colleagues, accusing them of “rebellion, sedition and misuse of public funds”. In total, charges have been made against 20 people, 14 of them former members of the Catalan and six of them members of the Speaker’s Committee in the Catalan Parliament (which facilitated the declaration of independence). 

Below is the front page of the document which details the charges, courtesy of the twitter account of The Spain Report.

The Spain Report published a summary of the charges.

  1. Accusations to be rebellion, sedition and misuse of public funds. All very serious crimes under Spanish Criminal Code 1995.
  2. Charges to be against all members of former Catalan government and members of Catalan Parliament Speaker's Committee.
  3. So Puigdemont, Junqueras, Romeva, Turull, etc. (regional got) and Forcadell (Speaker, parliament).
  4. Accusations against Puigdemont, Junqueras, etc. going to National High Court. Having been sacked, they no longer enjoy special privilege.
  5. Accusations against Forcadell and Speaker's Committee going to Supreme Court. They still enjoy special privilege until new elections.
  6. No word on remand petition yet. Prosecutor will wait until first court appearances to decide.

If found guilty, the charges of rebellion, sedition and misuse of public funds carry prison terms of up to 30, 15 and 6 years, respectively, under Spanish law.

Prior to the Public Prosecutor’s move, events in Catalonia had got off to a subdued start on the first day of the new working week. Only one Catalonian government official, Josep Rull, turned up for work, posting a photo of himself online via his Twitter account.

Rull, who is responsible for territory and sustainability, tweeted that he was in his office… “exercising responsibilities entrusted by Catalan people”.

According to La Vanguardia, two members of the Catalan police force visited Rull and informed him that he could be arrested. Spain’s Interior Minister, Juan Ignacio Zoido, urged Rull not to lead Catalonian officials “to the cliff edge.”

He subsequently departed. The newspaper also reported that accused Catalan Parliament Speaker, Carme Forcadell, cancelled a meeting of the group which organizes the Catalan Parliament’s daily agenda. The meeting had been scheduled for 10a.m. tomorrow.

Meanwhile, AP reports that one of the Catalan separatist parties is already drawing up plans for the upcoming regional elections.

A spokesman for a Catalan separatist party ousted from the regional government for pushing ahead with an independence bid has confirmed plans for the party to run in an upcoming regional election. Lawmakers of the Catalan Republic Left, or ERC, party, and their ruling coalition partners, passed a unilateral declaration of independence from Spain on Friday with the support of other separatist legislators. Making use of extraordinary powers, the Spanish government has fired the Catalan government, dissolved the regional parliament and called an election for Dec. 21. ERC party spokesman Sergi Sabria told reporters after a meeting of the party leadership that “we will find the way to participate on Dec. 21. Dec. 21 can be one more opportunity to consolidate the republic.”

As the news of the prosecutions was breaking, The Spain Report noted on its Twitter account that El Periodico de Catalunya, a Barcelona daily newspaper, reports that Carles Puigdemont is in Brussels.

Yesterday, The Brussels Times reported that Puigdemont could seek asylum in Belgium.

Carles Puigdemont, the former Catalonian President, could seek asylum in Belgium, the State Secretary for Asylum and Immigration Theo Francken has told VTM Nieuws. “No request has been submitted yet, but things change quickly. We’ll see what happens in the next few hours or days”, the State Secretary told VRT. The Spanish government has threatened to charge Mr Puigdemont because the regional Parliament voted for a unilateral independence resolution on Friday. A few days ago, Carles Puigdemont implied that it was possible he would seek asylum in a European country via an embassy. Belgium would be his preference.  

via http://ift.tt/2z2vFtI Tyler Durden

Key Events In The Coming Very Busy Week

With a full slate of central bank meetings, data (including payrolls Friday) and earnings next week there’s a little bit for everyone. On Thursday, according to Politico, we will also know who the next Fed Chair is as well as get a first look at a version of the House tax bill in the US, perhaps on Wednesday.

In terms of the scheduled events, front and center we’ve got the Bank of Japan (Tuesday), Fed (Wednesday) and Bank of England (Thursday) policy meetings all due in a three day window. Only the BoE is expected to change policy though with a 25bp hike to 0.5% the consensus on the street.

In terms of the Fed, while there is no Yellen press conference scheduled we may get clues in the statement as to whether the Fed is on track to raise rates in December.

Over at the BoJ, Governor Kuroda will make a scheduled press conference post the meeting so keep an eye on that.

With regards to the economic data next week, Monday’s just reported September PCE report in the US was closely watched with a modest +0.1% mom core reading expected (it printed at 0.1%, in line with expectations), while attention will also fall on Germany’s flash CPI report for October. We’ll get the wider Euro area report on Tuesday where the consensus is for no change in the +1.1% yoy core reading. In the US we also get ADP, ISM, and trade balance. We also have FOMC rate decision and Fed speakers in the schedule. 

In the Eurozone, we wait for unemployment, GDP, CPI, PMI and ECB speakers. In the UK, main focus is on BoE rate decision but we also have PMIs

Scattered throughout the week will be the final October PMIs, while we end the week with a bit of a bang on Friday with the October employment report in the US and that ever important nonfarm payrolls print. Current market expectations is for a bounceback 310k reading following that -33k slide in September. A +0.2% mom average hourly earnings reading is also expected.

Earnings wise next week we’ve got 136 S&P 500 companies scheduled including Apple on Thursday while 58 Stoxx 600 companies are due.

The full breakdown charted below, courtesy of BofA

DB’s Jim Reid has a day by day summary of key events:

  • Monday: A big day for inflation readings with the September PCE and personal spending reports in the US and flash October CPI report in Germany being the highlights. October confidence indicators for the Euro area and September money and credit aggregates data in the UK will also be worth watching, while the October Dallas Fed manufacturing activity reading in the US will also be out this afternoon. Late tonight we get industrial production and jobless rate data in Japan. Politics wise, Germany Chancellor Angela Merkel is due to meet leaders of the Free Democrats and Greens in the latest round of exploratory talks on forming a government.
  • Tuesday: The most significant overnight event is the BoJ monetary policy meeting along with the release of the Bank’s quarterly outlook report. Governor Kuroda’s press conference is due to follow shortly after. Meanwhile notable data includes the October PMIs in China, the flash October CPI print for the Euro area and France, advance Q3 GDP report for the Euro area and consumer confidence for the UK for October. In the US the Q3 employment cost index, October Chicago PMI, October consumer confidence and August S&P/Case-Shiller house price index is amongst the data due. The ECB’s Visco and Padoan are also due to speak while UK Brexit Secretary David Davis is questioned by the House of Lords EU Committee about the state of Brexit talks. BP and BNP Paribas are amongst the companies reporting results.
  • Wednesday: Front and centre on Wednesday evening will be the FOMC meeting although it’s worth noting that there is no scheduled Yellen press conference after. Along with the meeting we’ll also get some important data releases in the US including the ADP employment change report for October, ISM manufacturing print for October and October vehicle sales. Prior to this, in Asia the Caixin manufacturing PMI in China and Nikkei manufacturing PMI in Japan are due, while in the UK October house price data and the manufacturing PMI for October will be out. Away from that, UK Trade Secretary Liam Fox testifies before a parliamentary panel on plans for post-Brexit trade while BoJ Deputy Governor Nakaso is due to speak. In the US, the initial version of the tax plans should be released for further debates. Facebook and Tesla are amongst the notable earnings reports.
  • Thursday: Another central bank meeting should hog the spotlight with the BoE meeting outcome due around lunchtime. BoE Governor Carney will follow while the Bank’s latest inflation report will also be released alongside. Datawise we’ll receive the final October PMI revisions in Europe along with the October unemployment print in Germany and initial jobless claims and Q3 nonfarm productivity and until labour costs in the US. The Fed’s Bostic is also due to speak along with the IMF’s Lagarde. Apple and Credit Suisse are amongst the notable corporate reporters.
  • Friday: A busy end to the week for data. The highlight will likely be this afternoon with the October employment report in the US including the latest monthly nonfarm payrolls print. China’s remaining Caixin PMIs for October, the UK’s remaining October PMIs and the ISM non-manufacturing, final durable and capital goods orders for September, factory orders for September and the final PMIs in the US round out the data. The Fed’s Kashkari will also speak in the afternoon and the ECB’s Coeure in the evening. President Trump is also due to depart on his 11-day trip to Asia.

Finally, looking at just the US, here are the key events together with consensus expectations…

… and a full breakdown from Goldman:

The key economic releases this week are the personal income and spending report on Monday, ISM manufacturing on Wednesday, and the employment report on Friday. The statement from the October/November FOMC meeting will be released on Wednesday, and there are a few speaking engagements by Fed officials later this week.

Monday, October 30

  • 8:30 AM Personal income, September (GS +0.4%, consensus +0.4%, last +0.2%); Personal spending, September (GS +1.1%, consensus +0.9%, last +0.1%); PCE price index, September (GS +0.39%, consensus +0.4%, last +0.2%); Core PCE price index, September (GS +0.14%, consensus +0.1%, last +0.1%); PCE price index (yoy), September (GS +1.65%, consensus +1.6%, last +1.4%); Core PCE price index (yoy), September (GS +1.34%, consensus +1.3%, last +1.3%): We estimate a 1.1% increase in September personal spending (nominal, mom sa), reflecting a post-hurricane rebound in retail spending and auto sales, as well as a boost from higher gas prices. Based on details in the GDP, PPI, and CPI reports, we estimate that the core PCE price index increased 0.14% month-over-month in September, or +1.34% from a year earlier. Additionally, we expect that the headline PCE price index rose 0.39% in September, or +1.65% from a year earlier. We estimate a 0.4% increase in personal income.
  • 10:30 AM Dallas Fed manufacturing survey, October (consensus 21.3, last 21.3)

Tuesday, October 31

  • 08:30 AM Employment cost index, Q3 (GS +0.7%, consensus +0.7%, last +0.5%): We estimate that growth in the employment cost index (ECI) accelerated to 0.7% in Q3, with the year-over-year pace rising a tenth to +2.5%. Our forecast reflects diminished labor market slack and a boost from expected mean-reversion in the pace of growth in incentive-paid industries, particularly sales and related occupations. Wage growth also firmed in the third quarter, and our wage tracker—which distills signals from several wage measures—rose to 2.8% year-on-year in Q3 from 2.6% in Q2.
  • 09:00 AM S&P/Case-Shiller 20-city home price index, August (GS +0.4%, consensus +0.4%, last +0.3%): We expect the S&P/Case-Shiller 20-city home price index to increase further by 0.4% in August, following a 0.3% increase in the prior month. The measure still appears to be influenced by seasonal adjustment challenges, and we place more weight on the year-over-year increase, which was 5.9% in July.
  • 09:45 AM Chicago PMI, October (GS 62.5, consensus 60.0, last 65.2): We expect the Chicago PMI to moderate 2.7pt to 62.5 following a 6.3pt gain in the prior month. The index is likely to remain at levels consistent with expansion in business activity.
  • 10:00 AM Conference Board consumer confidence, September (GS 119.5, consensus 120.0, last 122.9): We estimate that the Conference Board consumer confidence index pulled back 3.4pt in September following a 5.6pt increase over the previous two months. Our forecast reflects sequential deterioration in higher frequency consumer surveys as well as scope for hurricane related weakness.

Wednesday, November 1

  • 08:15 AM ADP employment report, October (GS +135k, consensus +200k, last +135k): We expect a 135k increase in ADP payroll employment in October, reflecting a large drag from the September nonfarm payroll decline that is an input into ADP’s model. The report is likely to be difficult to interpret as a result, particularly because it could also be affected by the net strength in other financial and economic indicators used in the model.
  • 09:45 AM Markit US Manufacturing PMI, October (consensus 53.1, last 54.5)
  • 10:00 AM Construction spending, September (GS flat, consensus -0.2%, last +0.5%): We expect construction spending to be flat in September following a 0.5% gain in the August report, likely reflecting the impact of recent hurricanes on construction activity.
  • 10:00 AM ISM manufacturing index, October (GS 60.0, consensus 59.6, last 60.8): Regional manufacturing surveys have strengthened on net in October, while other measures of business confidence were more mixed. Overall, our manufacturing survey tracker moved up 0.9pt to 60.5 in October. We expect the ISM manufacturing index to decline 0.8pt to 60.0, following a 4.5pt gain over the last two months, but it will likely remain at levels consistent with a firm pace of expansion in business activity.
  • 02:00 PM FOMC statement, Oct 31-Nov 1 meeting: We expect the FOMC to keep policy unchanged next week and see few substantive changes to the statement. We expect a slightly more upbeat tone on growth that acknowledges the disruptions from the hurricanes but characterizes them as temporary or in the past tense, as we think Fed officials will view the data released over the inter-meeting period as broadly encouraging. Despite the disappointing September CPI report, we do not expect a downgrade of the inflation assessment or outlook, reflecting broadly stable year-over-year inflation and the further decline in the unemployment rate. We also expect the committee will continue to describe the risks to the outlook as “roughly balanced,” but there is a possibility that the statement upgrades the assessment of growth risks to “balanced” and leaves the inflation language unchanged (“closely monitoring”).
  • 5:00 PM Total vehicle sales, October (GS 17.7mn, consensus 17.5mn, last 18.5mn): Domestic vehicle sales, October (GS 13.7mn, consensus 13.7mn, last 14.3mn)

Thursday, November 2

  • 08:30 AM Nonfarm productivity (qoq saar), Q3 preliminary (GS +3.2%, consensus +2.5%, last +1.5%); Unit labor costs, Q3 preliminary (GS +0.6%, consensus +0.4%, last +0.2%): We estimate non-farm productivity increased 3.2% in Q3 (qoq ar), well above the 0.75% average achieved during this expansion. We expect unit labor costs – compensation per hour divided by output per hour – to increase 0.6% (qoq saar).
  • 08:30 AM Initial jobless claims, week ended October 28 (GS 230k, consensus 235k, last 233k): Continuing jobless claims, week ended October 21 (consensus 1,897k, last 1,893k): We estimate initial jobless claims fell 3k to 230k in the week ended October 28. Our forecast reflects additional post-hurricane normalization in Florida filings, which have retraced most of their earlier increases. Continuing claims – the number of persons receiving benefits through standard programs – have resumed their downtrend, falling to a new year-to-date low in the week ended October 21.

    08:30 AM Fed Governor Powell (FOMC voter) speaks: Federal Reserve Governor Powell will deliver introductory remarks at the Alternative Reference Rates Committee’s roundtable event in New York. No Q&A is expected.

  • 12:20 PM New York Fed President Dudley (FOMC voter) speaks: New York Fed President William Dudley will give closing remarks at the Alternative Reference Rates Committee’s roundtable event in New York. No Q&A is expected.
  • 06:15 PM Atlanta Fed President Bostic (FOMC non-voter) speaks: Atlanta Federal Reserve President Raphael Bostic will take part in a panel on “The Vital Role of Government Statistics” at the Association for Public Policy Analysis and Management’s 39th Annual Fall Research Conference in Chicago. Audience Q&A is expected.

Friday, November 3

  • 08:30 AM Nonfarm payroll employment, October (GS +325k, consensus +310k, last -33k); Private payroll employment, October (GS +310k, consensus +300k, last -40k); Average hourly earnings (mom), October (GS +0.2%, consensus +0.2%, last +0.5%); Average hourly earnings (yoy), October (GS +2.7%, consensus +2.7%, last +2.9%); Unemployment rate, October (GS 4.2%, consensus 4.2%, last 4.2%): We estimate nonfarm payrolls rebounded 325k in October, following a 33k decline in September and compared to three- and six-month moving averages of 185k and 160k, respectively. Our forecast reflects a 150k boost from workers returning to their jobs after Hurricanes Harvey and Irma, which weighed heavily on September payrolls based on the state-level breakdown. Relatedly, we note that electricity usage in Florida and Texas had returned to normal levels by mid-September, several weeks before the October survey period. We also believe the underlying pace of job growth remains firm, as jobless claims fell to a 44-year low in the survey week and our service-sector employment tracker rose to a 2-year high in October. We estimate the unemployment rate was unchanged at 4.2%, as the two-tenths drop last month was not driven by unusual declines in hurricane-affected areas. Finally, we expect average hourly earnings to increase 0.2% month over month and 2.7% year over year, reflecting neutral calendar effects.
  • 08:30 AM Trade balance, September (GS -$43.5bn, consensus -$43.3bn, last -$42.4bn): We estimate the trade deficit widened by $1.1bn in September. The Advance Economic Indicators report last week showed a wider goods trade deficit, and we also expect a pickup in services imports following lackluster growth in recent months.
  • 09:45 AM Markit US Services PMI, October (consensus 55.3, last 55.9)
  • 10:00 AM ISM non-manufacturing index, October (GS 59.0, consensus 58.5, last 59.8): We expect the ISM non-manufacturing index to move down 0.8pt to 59.0 in the October report, following a 4.5pt gain in September. A post-hurricane rebound in construction, mining, and retail is likely to offset some moderation following a big September boost. Overall, our non-manufacturing survey tracker decreased by 0.3pt to 56.7 in October.
  • 10:00 AM Factory orders, September (GS +1.4%, consensus +1.2%, last +1.2%); Durable goods orders, September final (last +2.2%); Durable goods orders ex transportation, September final (last +0.7%); Core capital goods orders, September final (last +1.3%); Core capital goods shipments, September final (last +0.7%): We estimate factory orders increased 1.4% in September following a 1.2% gain in August. Core measures in the September durable goods report were strong, with solid growth in core capital goods orders and shipments.
  • 12:15 PM Minneapolis Fed President Kashkari (FOMC voter) speaks: Minneapolis Fed President Neel Kashkari will participate in a moderated Q&A session with Women in Housing and Finance in Washington. Audience Q&A is expected.

Source: BofA. DB, Goldman

via http://ift.tt/2z2vA9o Tyler Durden

US Savings Rate Crashes To 10 Year Lows As Spending Surges Most Since ‘Cash For Clunkers’

While incomes grew at an expected 0.4% MoM, US consumers spent at an exuberant 1.0% MoM clip – the biggest monthly rise since Aug 2009 (cash for clunkers). To cover this spending surge, the savings rate tumbled.


The last time – Aug 09 – that spending surged like this was when the government unleashed 'cash for clunkers', it plummeted the following month…

Spending on durable goods rose 3.5 percent after adjusting for inflation after a 1.4 percent decline in August.

Outlays on services rose 0.3 percent, while spending on non- durable goods also advanced 0.3 percent.

Under the hood, the PCE Deflator printed as expected +1.6% YoY.

Private workers wage growth continues to outstrip government workers' wage growth YoY and upticked in September…

And while outgoings surged with relatively flat incomes, the savings rate plunged to its lowest since Dec 2007 to enable the spending…which just happens to be when the last recession started.

As Bloomberg warns, the jump in September outlays was driven by purchases of durable goods including the replacement of motor vehicles lost in recent flooding from hurricanes. That means the latest surge probably overstates the strength of consumer spending.

via http://ift.tt/2gUKyYy Tyler Durden