We Are In The “98th Percentile”: Goldman Indicator Finds Equity Positioning Is “Extremely Stretched”
Tyler Durden
Mon, 12/07/2020 – 13:30
One day after JPMorgan warned that the biggest threats for markets as we enter 2021 are “crowded trades and euphoric consensus“, Goldman has jumped on the cautionary bandwagon, writing that with its Friday close at an all-time high of 3699 (and a 16.5% total return YTD ), the S&P500 has reached the bank’s year-end target of 3700. Additionally, and as we discussed in our weekend post about the stupidity that is the Fed model and why low interest rates do not justify blow out multiples, Goldman also points out that “absolute valuation is high compared with history with the forward P/E at 21.1x”…
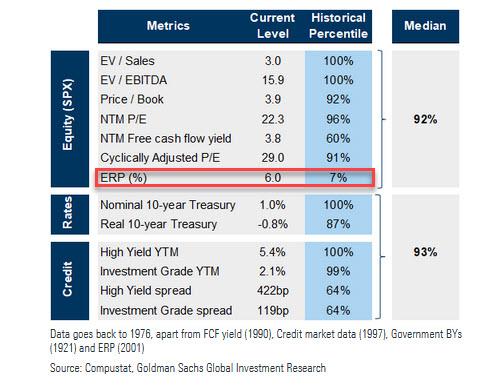
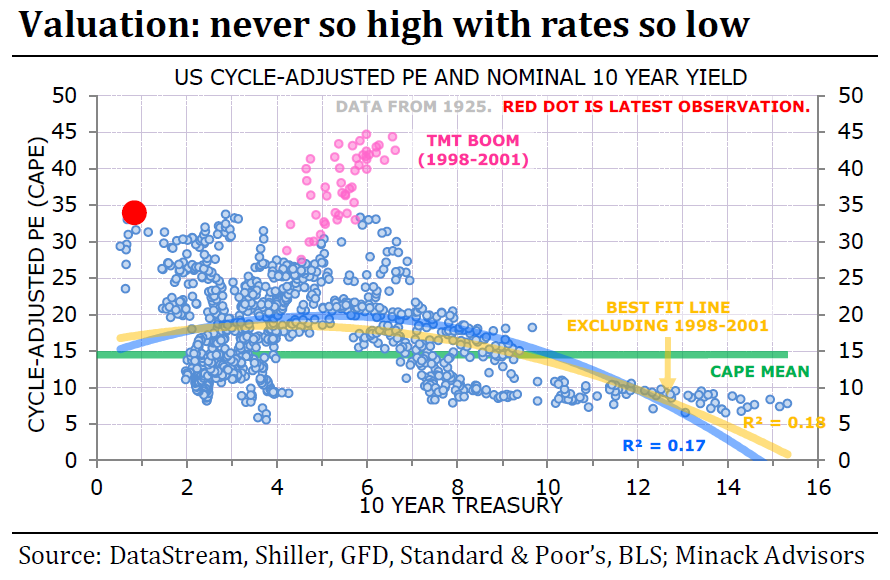
… even if hilariously, Goldman falls back precisely to the same strawman argument that “equities are more reasonably valued in the context of the low interest rate environment”, the same argument we debunked using data from Gerard Minack:
Perhaps Goldman realizes the folly of its recommendation, because moments after praising the “reasonableness” of stock valuations in a time of record low rates, the bank writes that “equity positioning is extremely stretched” and adds that as of Friday, its equity “Sentiment Indicator(SI) registered +2.0 standard deviations above average…

… which represents a 98th percentile reading since 2009.”

As Goldman strategist Arjun Menon explains, the index combines six weekly and three monthly measures of equity positioning across retail, institutional, and foreign investors, and “readings of +1.0 or higher have historically signaled stretched equity positioning.” As a reference, the last time Goldman’s SI exceeded +1.0 was in February this year – just before the covid crash – and the last time the index recorded +2.0 was in September 2019, around the time NOT QE was launched to prevent a bank funding crisis.
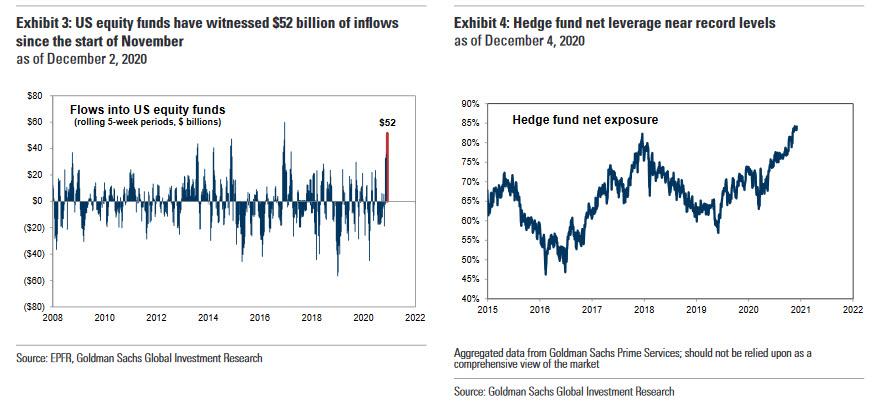
Digging into the components of the proprietary indicator, Goldman notes that the record inflows into US equity funds which we documented last week using BofA’s analysis of EPFR data, “have been the key driver of our Sentiment Indicator during the past month.” Specifically, since the start of November, US equity mutual funds and ETFs have witnessed $52 billion of inflows, the largest inflows relative to assets during any five-week period since March 2017. At the same time, and as also discussed two weeks ago, hedge fund net leverage has continued to climb and is just shy of the highest level on record. A further decline in US equity mutual fund cash positions to a 40-year low (just 1.7% of assets) and a jump in CFTC net futures length have also contributed to the recent rise in our SI.
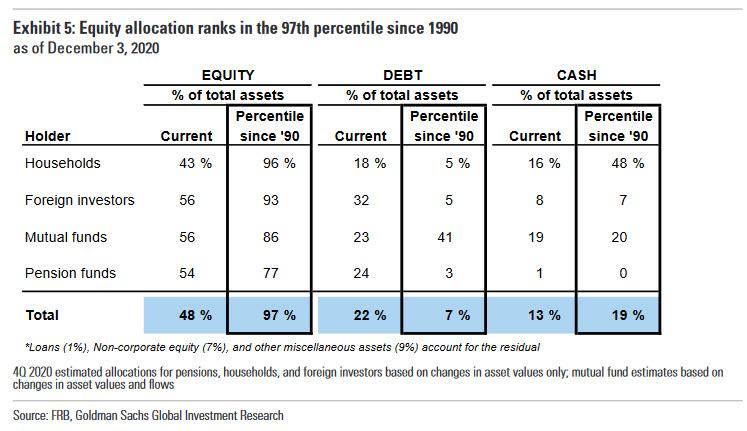
So for all those who claim that there is cash on the sidelines, please keep quiet and instead read this assessment from Goldman: “total equity allocation now ranks in the 97th percentile since 1990. We estimate that, in aggregate, equities account for 48% of household, pension fund, foreign investor, and mutual fund assets. These four investor categories own around 90% of the overall corporate equity market. In contrast, aggregate allocation to bonds (22%) and cash (13%) are at the 7th percentile and 19th percentile, respectively.
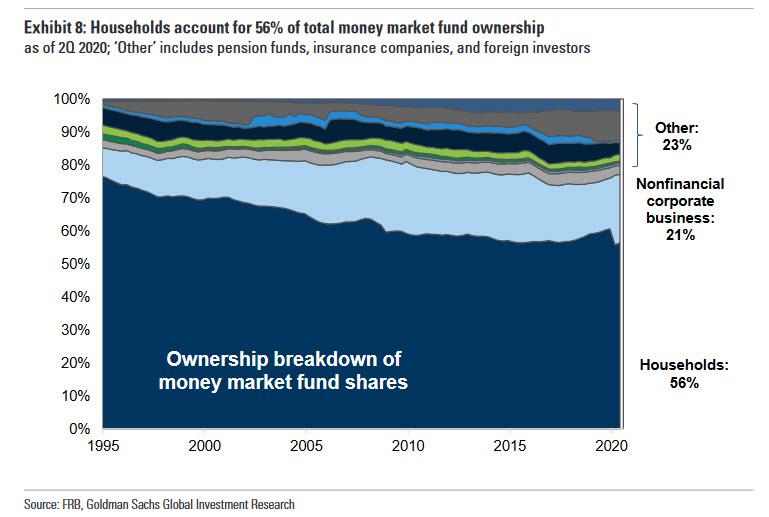
Notably, US households represent the single largest owner of the US equity market, at 35%, and currently have cash allocations close to the 30-year average despite cash yields being substantially below average.“
So what does this record investor euphoria mean for stock prices? It probably won’t come as a surprise that after both Morgan Stanley and JPMorgan cautioned about near term weakness, Goldman too has jumped on that particular bandwagon, and writes that “in the near-term, the risk of a modest equity market pullback has risen because the worsening virus situation in the US could spur a positioning unwind.” The bank adds that although vaccine approval in the US appears imminent, “increased restrictions or shutdowns in the US could slow the near-term recovery in economic growth.” This is also why Goldman’s economist team recently downgraded their US GDP growth forecasts for 4Q 2020 and 1Q 2021 and cited “further downside risks to their estimates.” On the other hand, the prospect of fiscal stimulus represents a potential upside risk to growth expectations and Goldman’s political strategists believe that the odds of a near-term deal have increased.
In short while potential near-term catalysts are roughly even between bullish and bearish, the biggest risk remains outsized euphoric positioning (just as JPM warned) and the threat of a violent unwind of weak bullish hands, which would lead to a quick dip… which would then quickly be bought as investors frontrun the next fiscal or monetary stimulus.
It’s also why after expecting some turbulence in the near term, Goldman writes that in the medium-term, it remains confident in its forecast of strong equity market returns, and repeats its call for a “roaring 20s” return in the coming years, expecting the S&P to hit 4,300 by mid-2021:
“Our baseline assumptions that a vaccine will be widely distributed by mid-2021 and that the US economy will experience a ‘V’-shaped recovery are the key drivers of our S&P 500 2021 year-end forecast of 4300 (+16%). Stretched positioning has typically represented a downside risk only to near-term forward returns.
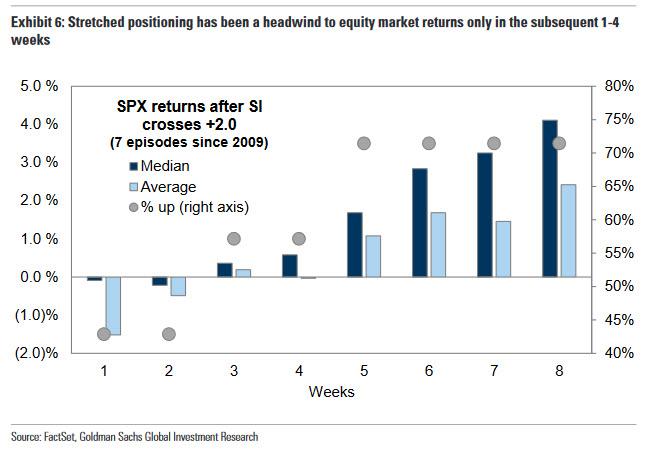
Finally, if there is a market correction as bull puke, how bad could it be? As the Goldman strategist explains, “although the historical sample is limited, during prior instances when our SI recorded +2.0 or higher, S&P 500 returns were weak in the subsequent 1-4 weeks but almost always positive after two months.“
So there you have it: expect 1-4 weeks of potential weakness, which however will be promptly reversed shortly after as the BTFD brigade – and various central banks and pension funds – not to mention the hordes of retail investors unleash their dip buying power.
via ZeroHedge News https://ift.tt/33TXUJX Tyler Durden


