“Vulnerability Windows” And Swinging Trap Doors – Look Out Below

Via John P. Hussman, Ph.D.

“The received wisdom is mistaken on how recessions are made. They are not simply caused by shocks. They are caused by a window of vulnerability in the economic cycle where the cyclical drivers of the economy have weakened to the point where it’s susceptible to a negative shock. Within that window of vulnerability, virtually any reasonable shock becomes a recessionary shock. That’s how you get a recession.”

– Lakshman Achuthan, Economic Cycle Research Institute

Why do economies collapse into recession in ways that seem so difficult to predict? Why do financial markets collapse into free-fall with timing that’s so loosely related to market valuations? Much of the reason is that complex systems usually aren’t linear. In a linear system, a given change in some variable X always has the same expected effect on variable Y. In the economy, and in the financial markets, the same event can have zero effect in some conditions, and profound effect in another, often depending on much broader conditions that make the system vulnerable or resilient to shocks.

As a rule, long-term results in the economy tend to be predictably related to underlying long-term drivers. So for example, long-term economic growth is usually tightly related to the sum of labor force growth and trend productivity growth. Likewise, long-term stock market returns are usually tightly related to the initial level of market valuations and the long-term structural growth rate of the economy.

In contrast, shorter-term outcomes can be dominated by psychology and what Keynes described as “animal spirits.” Over shorter segments of the economic cycle, GDP growth may have a very weak relationship with structural factors like labor force growth and trend productivity, and economic fluctuations can instead be driven by cyclical fluctuations in the unemployment rate. Likewise, over shorter segments of the market cycle, market returns can have little or no relationship to valuations, and returns can instead be driven by the psychological inclination of investors toward speculation or risk-aversion.

If those episodes of “animal spirits” persist long enough to become over-extended, naïve observers may come to believe that “fundamentals don’t matter.” Instead, they extrapolate recent trends, blind to the fact that risk becomes most profound exactly when it has remained unexpressed the longest.

Even when surreal distortions in the economy and the financial markets make crisis and speculative collapse inevitable, it’s not enough to know that those outcomes are baked-in-the-cake. Imbalances aren’t resolved sooner just because the imbalances are larger. The fact that I fully expect the S&P 500 to lose 60-65% of its value over the completion of this cycle doesn’t mean that intervening periods of speculation and uniform market internals can’t periodically defer that outcome. Instead, crises emerge seemingly out of nowhere, when a vulnerable window or a trap door swings open. That makes it essential to monitor those hinges. Decades ago, the late MIT economist Rudiger Dornbusch put it this way: “The crisis takes a much longer time coming than you think, and then it happens much faster than you would have thought.”

Fortunately, this doesn’t mean that we have to abandon the hope of anticipating recessions, market collapses, recoveries, or favorable market periods. What it does require, however, is the willingness to abandon the idea of “prediction” and to replace it with a more flexible approach that’s focused on identifying a) underlying drivers of economic growth and market returns, and b) the factors that create “windows” during which those underlying drivers are most likely to be expressed or ignored.

Imbalances aren’t resolved sooner just because the imbalances are larger. Instead, crises emerge seemingly out of nowhere, when a vulnerable window or a trap door swings open. That makes it essential to monitor those hinges.

Throwing stones at the window of vulnerability

Let’s begin by discussing the current economic situation. My friend Lakshman Achuthan at the Economic Cycle Research Institute (ECRI) recently offered a great discussion on RealVision (https://www.realvision.com/cycling-into-slowdown) describing how he thinks about recessions and recoveries. Though we were among the only observers to anticipate both the 2000-2002 and 2007-2009 downturns, we’ve each made premature recession calls during the recent expansion, largely because growth cycle downturns that have historically resolved into recessions were met with fresh speculative psychology. The lesson there, at least on my part, was to impose somewhat more conservative thresholds on our Recession Warning Composite, and also to leave more room for doubt in periods where our measures of market internals suggest that speculators still have the bit in their teeth.

Still, the basic framework we share – extracting a joint signal from multiple indicators, monitoring evidence from prevailing conditions rather than relying on linear models to predict future outcomes – is not only consistent with what we know about economic fluctuations, but is also one that has been highly effective identifying recessions in real-time, where few economists or even central banks have been successful.

Lakshman’s mentor was Geoffrey Moore, who co-founded ECRI, and as a senior member of the National Bureau of Economic Research, provided the official dates for most U.S. post-war recessions. Moore was succeeded by Robert Hall, who headed the NBER committee that subsequently dated U.S. recessions, and was one of the members of my dissertation committee at Stanford. I earned my keep at Stanford, in part, as Dr. Hall’s teaching assistant in his macroeconomics core course for incoming Ph.D. candidates. So when either of us talk about how a recession is identified, we’re talking about how the body that authoritatively determines recessions defines them.

I strongly encourage watching Lakshman’s whole RealVision interview, but a few quotes will suffice to emphasize the importance of thinking not in terms of “forecasting,” but instead in terms of underlying conditions, and windows of vulnerability:

“What we’re doing is monitoring ‘buckets’ of indicators. The cycle is not defined by GDP, but by the bucket of indicators, which includes GDP and measures of output, measures of employment, income, and sales, and they’re all very broad aggregate measures, which collectively define the economy outside your window. There’s actually two cycles you’re watching. One of them is business cycles – recessions and recoveries – defined by when the level of that bucket of indicators falls in a pronounced, pervasive, and persistent manner. Even two negative quarters of GDP is not a necessary or sufficient condition for a recession.

“More important may be growth rate cycles, because this is what markets key off of – accelerations and decelerations in growth. Since the last recession, we’ve actually had three full growth rate cycles: 2010-11, 2012-13 and then 2015-16, with accelerations in between. We peaked [in 2018] and we’re in a new deceleration. The moment you go into a deceleration, especially if your growth rate isn’t that high to begin with, recession is on the table. I look at the leading indicators and they are still going down.

“The received wisdom is mistaken on how recessions are made. They are not simply caused by shocks. They are caused by a window of vulnerability in the economic cycle where the cyclical drivers of the economy have weakened to the point where it’s susceptible to a negative shock. Within that window of vulnerability, virtually any reasonable shock becomes a recessionary shock. That’s how you get a recession.

“3% trend growth is just not in the cards. What’s your population growth? What’s your productivity growth? That constrains and defines your long-term potential for growth. When you add it up, population growth is running at about 0.5%, and then your productivity growth is at best 1%. That’s 1.5%. That’s not 3%. It’s just not going to happen. If you have low trend growth and cycles, and every growth rate cycle downturn brings recession onto the table, you’re setting yourself up – even though we’ve had a long expansion – for a period of more frequent recessions.”

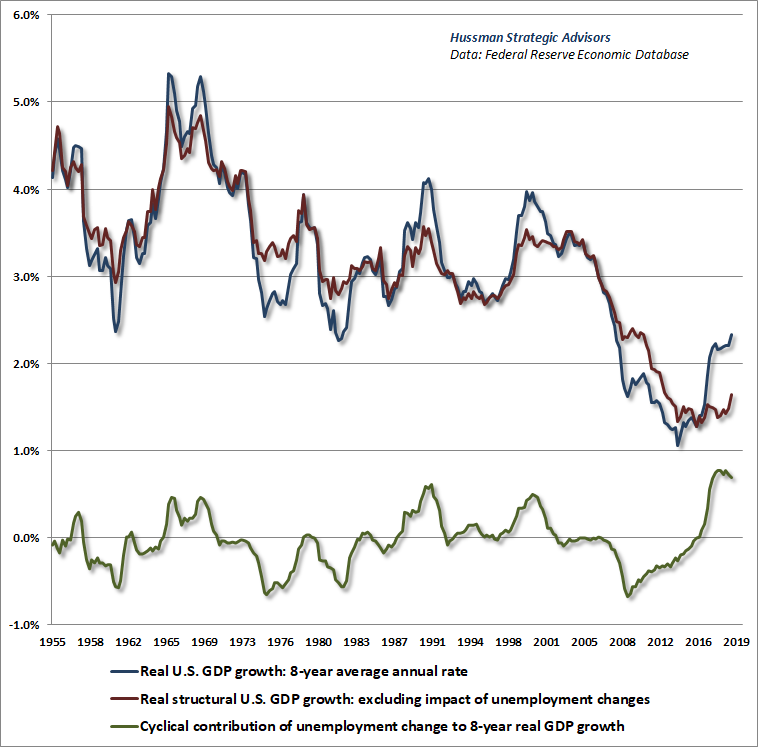
A couple of charts will help to underscore what Lakshman is saying. The first chart below offers a distinction between what I often call “structural” and “cyclical” components of economic growth. The blue line is actual 8-year average real U.S. GDP growth. The red line is “structural” real GDP growth, which is driven by labor force growth plus trend productivity. As Lakshman observed, the current level of structural real U.S. GDP growth is only about 1.5%. That’s the average level of growth that we would observe if the rate of unemployment was simply held constant. The green line shows the “cyclical” component of real GDP growth, which is driven by changes in the unemployment rate.

Notice that much of the growth that we’ve observed in recent years has been driven by a decline in the unemployment rate from 10% in 2009 to just 3.6% recently. It would be a mistake to extrapolate that component. Even if the U.S. avoids a recession in the coming years, we’re looking at likely real GDP growth of scarcely 1.5%. Any uptick in the unemployment rate will quickly be associated with outright recession.

Understand what low structural growth implies for the U.S. stock market. First, while Wall Street mechanically recites the aphorism that “lower interest rates justify higher valuation multiples,” that proposition actually holds only if the trajectory of future cash flows is held constant. So yes, if the trajectory of future cash flows is held constant, it’s fine to believe that lower interest rates justify higher valuation multiples. Even then, if you understand what those higher valuation multiples are actually doing, the proposition is identical to saying that that lower interest rates justify lower future stock market returns.

The problem is that if interest rates are low because growth is also low, lower interest rates don’t justify any increase in valuation multiples at all. Normal valuation multiples would already be enough to produce lower future equity returns, via the slower growth of future fundamentals. If investors instead bid valuation multiples up anyway, subsequent returns are penalized twice, and can be driven to negative levels for years to come. That’s what investors have done here.

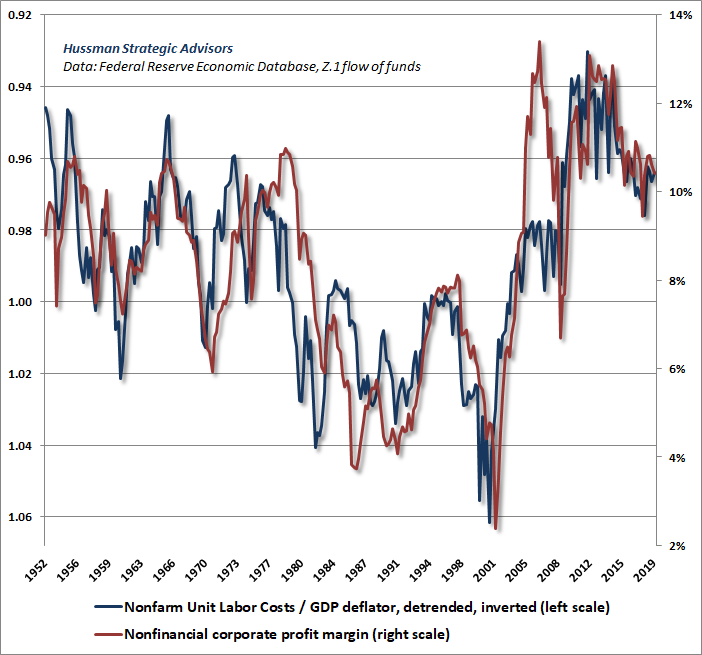
Think of it this way. If inflation stays around 2%, the result will be corporate revenue growth of only about 3.5%. Without persistent expansion in profit margins (which are already eroding as a tighter labor market puts upward pressure on unit labor costs), corporate earnings growth will also likely top out at just 3.5% annually in the coming years, with steep risk to the downside. Even the mildest retreat in valuation multiples will then likely produce a multi-year period of negative S&P 500 total returns. All of this is just basic arithmetic.

For investors who imagine that higher profit margins are some mystical consequence of vaguely defined forces like “technology,” “innovation,” “oligopoly,” “globalization” or whatever chewy words make them feel like we’re all just smarter now, buckle up. The surge in profit margins we’ve seen in recent years is a direct reflection of depressed unit labor costs, largely the result of years of high unemployment and job market distress that followed the global financial crisis. As labor slack has been taken up, labor costs have begun to rise at a faster rate than overall price inflation (the only durable and intellectually tenable interpretation of A.W. Phillips’ 1958 paper). Margins are already under pressure, S&P 500 margins always lag economy-wide shifts in nonfinancial margins, and we haven’t even hit a recession yet.

The problem is that if interest rates are low because growth is also low, lower interest rates don’t justify any increase in valuation multiples at all. Normal valuation multiples would already be enough to produce lower future equity returns, via the slower growth of future fundamentals. If investors instead bid valuation multiples up anyway, subsequent returns are penalized twice, and can be driven to negative levels for years to come. That’s what investors have done here.

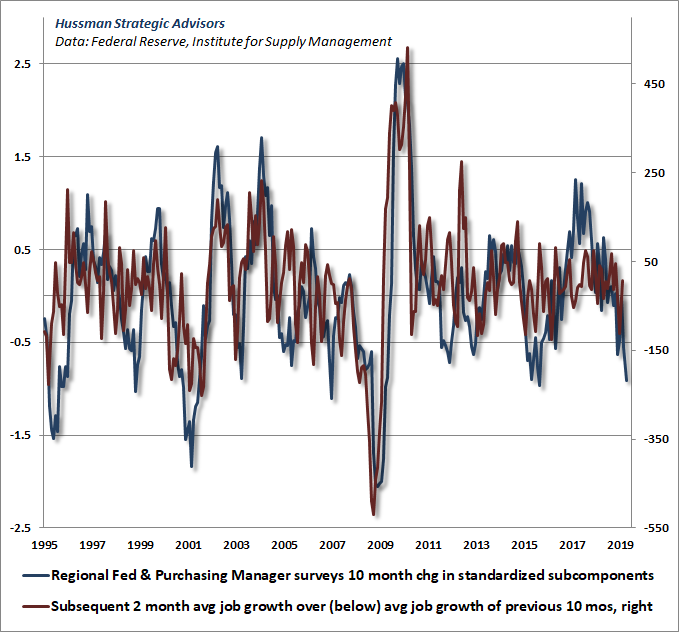
The next chart shows another of the immediate risks already on our radar. In recent months, the composite signal we derive from broad regional Fed and purchasing managers surveys has turned down sharply. We also know that employment is among the most lagging measures of economic activity. The combination of those two observations is presented in the chart below.

Specifically, the 10-month change in our broad economic composite has a reasonably strong relationship to the amount by which non-farm payrolls grow over the following 2-months, above or below the average job growth during the same 10-month period. To put some numbers on this, over the past 10 months, U.S. nonfarm payrolls have grown an average of 216,000 per month. Given the rapid deterioration in our economic composite, it would not be surprising to see job growth in the next couple of months average about 180,000 jobs less than that, implying that we may be about to observe a collapse in monthly job growth to an average of only about 36,000 jobs per month in the next couple of reports.

I can’t speak for Lakshman with respect to where his own measures are in defining a potential “window of vulnerability”, but I can say that our own Recession Warning Composite is not far from that determination. Even being fairly conservative about a recession call, we would become vocal about oncoming recession provided simply: a) a further decline in the ISM Purchasing Manager’s Index to a level of 50 or below, and; b) an increase in the rate of U.S. unemployment to 4% or a slowing in year-over-year payroll growth to less than 1.4%.

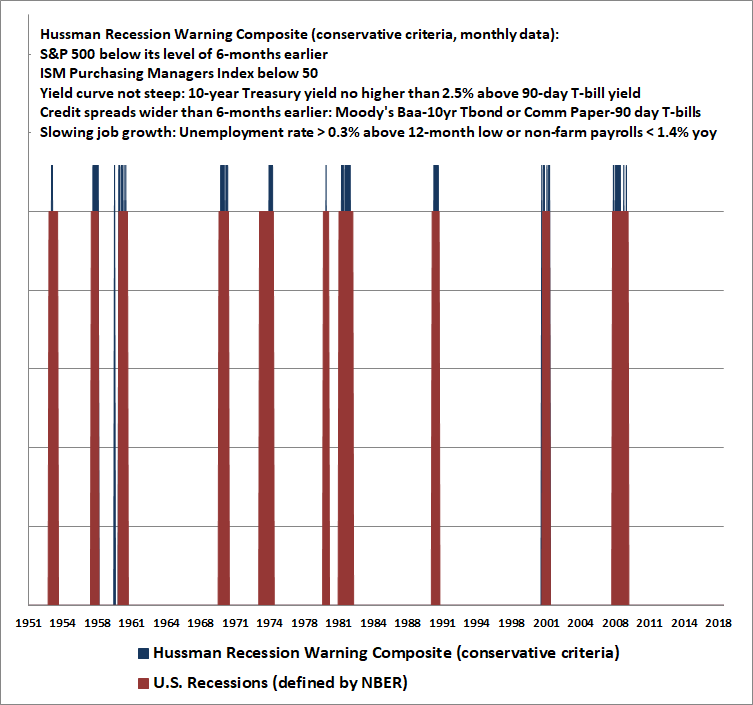
As always, evidence is most compelling when it is most broad. Some of the features that typically accompany the onset of a recession include a drop in Consumer Confidence of roughly 20 points below its preceding 12-month average; a 3-month decline in aggregate hours worked. Raising the criteria on the ISM PMI to 54 and eliminating the requirement of rising credit-spreads has historically produced more timely warnings, but also allowed false signals during the recent expansion.

Given the rapid deterioration in our economic composite, it would not be surprising to see job growth in the next couple of months average about 180,000 jobs less than that, implying that we may be about to observe a collapse in monthly job growth to an average of only about 36,000 jobs per month in the next couple of reports.

What’s clear is that the U.S. economy is quite close to a window of recessionary vulnerability, and rocks, such as arbitrary tariff announcements, are being carelessly thrown against that window. Given that the kind of employment slowdown already implied by our broad economic composite would be enough to trigger the employment component of our Recession Warning Composite, my sense is that the likelihood of an oncoming recession is accelerating rapidly. Yet given that market conditions already hold us to a defensive position, we have the luxury of not rushing an explicit recession warning just yet.

The trap-door reopens

In the equity market, we also see a “conditional” effect of valuations. Specifically, when investors are inclined toward speculation, even the most obscene overvaluation may have no effect on market returns. But once psychology shifts from speculation to risk-aversion, market conditions become permissive of extraordinary market collapses. When investors are inclined to speculate, they tend to be indiscriminate about it, so we find that the most reliable measure of speculative or risk-averse psychology is the uniformity or divergence of market action across thousands of individual securities, industries, sectors, and security-types, including debt securities of varying creditworthiness.

I developed this approach in 1998, with minor adaptations since, and discussed the importance of our measures of internals in real time when we adopted a hard-negative outlook in 2000 and 2007. While I don’t disclose specific methods, the central principle is that risk-aversion reveals itself through divergence, dispersion, ragged leadership, and lack of participation in financial market behavior.

As I’ve regularly observed, our difficulty in the recent market cycle had nothing to do with valuations or internals, but instead on my premature bearish response to historically useful “overvalued, overbought, overbullish” syndromes. In late-2017, I abandoned my belief that extreme speculation still had reliable “limits,” and we have since required explicit deterioration in market internals in order to adopt or amplify a bearish market outlook.

The chart below presents the cumulative total return of the S&P 500 in periods where our measures of market internals were favorable, and accruing Treasury bill interest otherwise. The chart is historical, does not represent any investment portfolio, does not reflect valuations or other features of our investment approach, and is not an assurance of future outcomes.

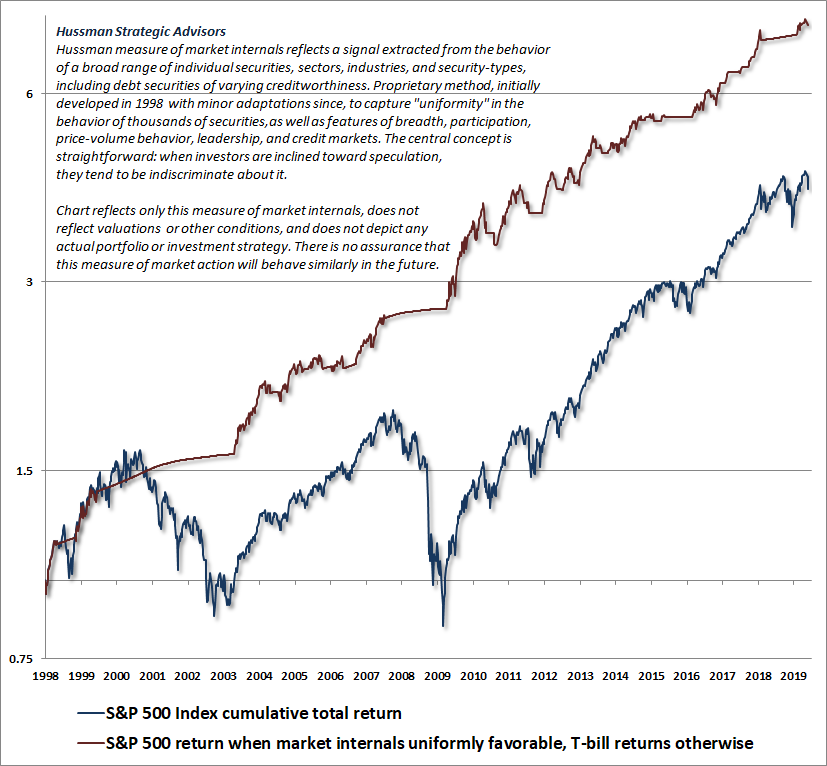
Two weeks ago, after a brief positive whipsaw, those measures of market internals again shifted negative. We don’t know how long the most recent shift will persist. On average, shifts last about 30 weeks, with 25% of shifts extending 40 weeks or longer, and 25% of shifts extending 8 weeks or shorter. The feature of importance here is that the condition of market internals (and by extension, the inclination of investors toward speculation or risk-aversion) has been extremely useful in this cycle, as in prior ones. Indeed, the entire total return of the S&P 500 from the 2007 peak to the recent market peak has occurred in periods where internals were favorable, while nearly the entire 2000-2002 and 2007-2009 collapses occurred when they were not.

Now, from a long-term, full-cycle perspective, valuations are also extremely informative about likely market returns. Extreme valuations are regularly followed by depressed subsequent returns, while depressed valuations are regularly followed by satisfying market returns. Still, keep in mind that if overvaluation was enough to drive the market lower, it would be impossible for valuations to reach the kind of extremes they did in 1929, 2000 and at the recent market peak. So at the end of every market bubble, there is usually a period of time where stocks have done much better than one would have expected on the basis of valuations alone. These transitory “excess returns” are routinely beat out of the market over the completion of the cycle.

Emphatically, major market collapses do not simply emerge because the market is overvalued. They emerge because extreme valuations are joined by a shift in investor psychology from speculation to risk-aversion. It is not necessary to predict those shifts – only to align one’s outlook with them.

The chart below updates our Margin-Adjusted P/E, which is more reliable across history than a score of competing alternatives, including price/forward operating earnings, the Fed Model, or the Shiller CAPE.

In late-October 2008, when our best valuation measures fell below their historical norms, I could comfortably write “The best way to begin this comment is to reiterate that U.S. stocks are now undervalued.” Presently, the S&P 500 would have to lose about 60-65% simply to reach historically run-of-the-mill valuations. Those valuations are not worst-case possibilities, but outcomes that have been observed over the completion of every market cycle in history, except the 2002 low (which was later breached in the 2007-2009 collapse).

The next chart puts the Margin-Adjusted P/E on an inverted log-scale, along with actual subsequent 12-year S&P 500 average annual total returns. Note that current valuations are fully consistent with the expectation of 12-year losses in the S&P 500.

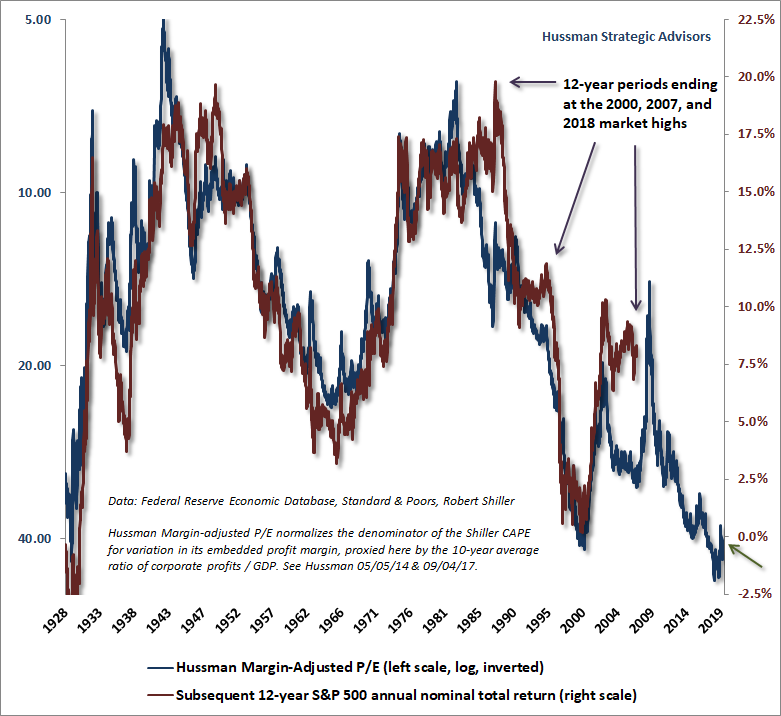
The important thing to recognize is that valuations are extremely informative about long-term returns and full-cycle market risks, but they are not particularly useful as timing tools in themselves. Emphatically, major market collapses do not simply emerge because the market is overvalued. They emerge because extreme valuations are joined by a shift in investor psychology from speculation to risk-aversion.

It is not necessary to predict those shifts – only to align one’s outlook with them. I remain entirely open to adopting a neutral or constructive outlook even at current valuation extremes, but here and now, a roughly 60-65% trap door has opened below this hypervalued market, and until the evidence shifts, our outlook is now hard-negative.

An imminent shift to easy money

Given the accelerating prospects for economic recession, consistent with the recent drop in leading measures, Treasury yields, and industrial commodity prices, it’s natural to expect that the Federal Reserve will cut interest rates in response. That’s a prospect that I wouldn’t entirely rule out even at the upcoming June meeting. The question is whether that would do any good. The answer is no – at least under the set of conditions we presently observe – and the reason goes back to the “nonlinear” and “conditional” response of the economy and the markets to various events.

See, the way Fed easing “works” to support stock prices is straightforward. Provided that investors are inclined toward speculation and risk-seeking, Fed easing tends to be very favorable for the market, because safe, low-interest liquidity is a hot-potato to risk-seeking speculators. Each successive holder wants to get rid of it, yet somebody has to hold it at each point in time. The resulting effort to exchange it for something else has the effect of driving up stocks, bonds, and anything else that offers a “pickup” to low short-term rates.

In contrast, when investors are inclined toward risk-aversion, safe low-interest liquidity is a preferred asset rather than an inferior one. So creating more of the stuff does nothing to encourage more speculation. When one recalls that the Federal Reserve eased persistently and aggressively throughout the 2000-2002 and 2007-2009 collapses, it should be clear that a recessionary collapse in stocks would not be interrupted by a sudden shift toward rate cuts, aside for very short-lived knee-jerk reactions.

While we believe that the Federal Reserve will shift toward an easing monetary policy in the near future, the likely effect of Fed policy on the stock market will be best gauged by monitoring market internals directly. If internals remain ragged and divergent, then even persistent and aggressive easing should not be expected to support stocks. In contrast, during periods when market internals shift to a uniformly favorable condition, Fed easing will tend to amplify the speculative tendencies of investors, and it will be appropriate to adopt a constructive outlook in response.

To illustrate the conditional response of the equity market to monetary policy, the chart below shows four lines. The green line shows the cumulative total return of the S&P 500 during periods when the Fed was easing (based on policy rates or reserve creation) and our measures of market internals were favorable. Clearly, Fed easing tends to have a robust and positive impact on the market when investors are inclined toward speculation. Yet look at the orange line. Those are periods where the Fed was easing yet investors were inclined toward risk-aversion, as inferred from ragged or deteriorating market internals. On average, Fed easing had no effect. Indeed, most of the market losses during the 2000-2002 and 2007-2009 period occurred in exactly those conditions.

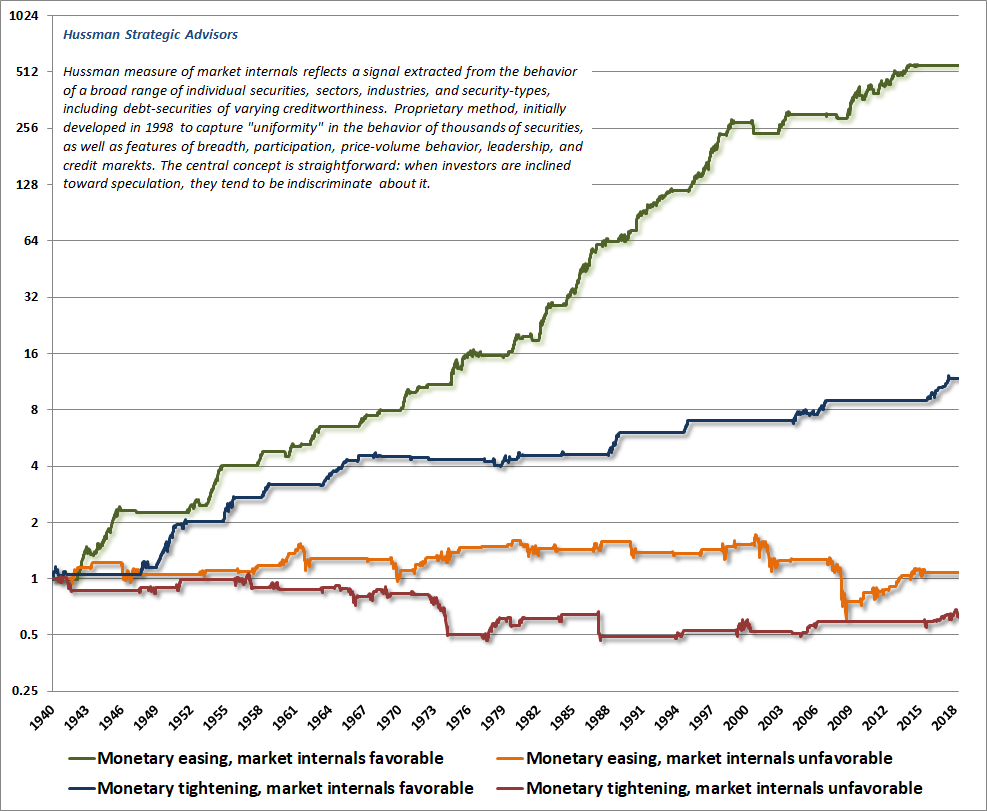
Note also that the market tends to do quite well during periods of Federal Reserve tightening, provided that investors are inclined to speculate, as those tightening phases tend to overlap late-stage economic expansions when the news is good and investors are happy. Not surprisingly, the worst average outcomes occur during periods when the Fed is tightening yet investors are also inclined toward risk aversion. This tends to be associated with inflationary periods like 1972-1974, when the Fed did not have the luxury of easing despite a collapsing stock market.

While it’s possible that Fed easing could help to shift investor psychology back toward speculation, that prospect is best gauged by monitoring market internals directly, rather than keying one’s actions off of Federal Reserve behavior.

Remember, for example, that during the global financial crisis, it wasn’t Fed easing that put the bottom in. The crisis ended, and ended precisely, in the second week of March 2009, when the Financial Accounting Standards Board, under Congressional pressure, abandoned FAS157 “mark-to-market” accounting rules. Banks were immediately allowed to use “significant judgment” in valuing their toxic assets, which removed the specter of widespread bank insolvencies with the stroke of a pen. Once investor psychology shifted toward speculation, Fed easing suddenly became highly effective in amplifying that speculation, where it had been totally impotent before.

While we believe that the Federal Reserve will shift toward an easing monetary policy in the near future, the likely effect of Fed policy on the stock market will be best gauged by monitoring market internals directly. If internals remain ragged and divergent, then even persistent and aggressive easing should not be expected to support stocks. That’s precisely what occurred during the 2000-2002 and 2007-2009 collapses. In contrast, during periods when market internals shift to a uniformly favorable condition, Fed easing will tend to amplify the speculative tendencies of investors, and it will be appropriate to adopt a constructive outlook in response.

The bottom line is that economic recessions and market collapses tend to occur not just because imbalances have gone “too far,” but because some window or trap door has opened. In economic data, the windows of vulnerability emerge as a combination of weakness in leading indicators, often including additional features like a flat or inverted yield curve, widening credit spreads, and equity market weakness. In the financial markets, the trap doors typically present themselves in the form of weak or divergent market internals. In both cases, it’s advisable to mind the hinges of those windows and doors. If those windows and doors close, based on improvements in leading indicators and a shift to uniformly favorable internals, our immediate outlook will become decidedly more constructive.

As I observed in January 2008, in a piece titled “Minding the Hinges of Pandoras Box”, I wrote, “I am emphatic that investors should evaluate their risk exposures and tolerances now, in order to allow for substantial further market weakness. Market conditions presently feature a Pandora’s Box of rich valuations, vulnerable profit margins, rising default risk, rapidly deteriorating market internals, failing support levels, and accumulating evidence of oncoming recession.” Until we observe an improvement in leading economic measures and a shift toward uniformly favorable market internals, my advice today is exactly the same.

via ZeroHedge News http://bit.ly/2wL4voR Tyler Durden

Meadows: FBI Knew ‘Within 60 Days’ That Russia Probe ‘Built On A Foundation Of Sand’

Mark Meadows confirmed what many have suspected about the Trump-Russia for a long time; the FBI knew early on that the foundation of its counterintelligence investigation against the Trump campaign was built on ‘a foundation of sand,’ reports the Daily Caller‘s Chuck Ross. 

North Carolina Rep. Mark Meadows (R) told Hannity Friday night that the FBI knew “within 60 days of them opening the investigation, prior to [Robert] Mueller coming on, the FBI and the [Department of Justice] knew that Christopher Steele was not credible, the dossier was not true, George Papadopoulos was innocent.” 

Meadows did not elaborate on why he believes the FBI knew their investigation was built on a mountain of lies, however according to The Hill‘s John Solomon last month, memos which were retroactively classified by the DOJ reveal that a high-ranking government official who met with Christopher Steele in October 2016 determined that information in the Trump-Russia dossier was inaccurate, and likely leaked to the media. 

Meadows also suggested that the FBI had exculpatory information on Trump campaign adviser George Papadopoulos, who was fed the rumor that Russia had negative information on Hillary Clinton, and later bilked for said information by a Clinton-linked Australian diplomat. Papadopoulos would later be subject to a spying operation in which the FBI sent in two operatives to trick the Trump adviser in a failed business / honeypot operation. 

The bureau opened its investigation of the Trump campaign on July 31, 2016, after receiving a tip about Papadopoulos from the Australian government. Within those two months, the FBI team leading the investigation received information from Steele’s dossier. The FBI also dispatched a longtime FBI informant, Stefan Halper, to meet with Papadopoulos.

The pair met in London in mid-September 2016 after Halper offered Papadopoulos $3,000 to write a policy paper. Halper, a former Cambridge professor, was accompanied by a woman he claimed was his assistant, Azra Turk. She is reportedly a government investigator.

Meadows in the past has suggested the FBI had exculpatory information on Papadopoulos that showed the Trump aide was not working with Russia. –Daily Caller

The FBI relied on the Steele dossier to obtain surveillance warrants on former Trump campaign adviser Carter Page, ostensibly allowing the Obama administration to surveil those Page was in contact with. 

via ZeroHedge News http://bit.ly/2wLIkPm Tyler Durden

Why The Inflation Downtrend Will Last Months (In One Chart)

Via ECRI,

ECRI’s Lakshman Achuthan joined CNBC to discuss ECRI’s U.S. Future Inflation Gauge, the inflation outlook, the Fed and the bond market.

Both the Fed and the bond market have been way behind the curve in anticipating the inflation cycle downturn, and the plunge in the market’s inflation expectations tells you that’s the key reason yields have plummeted.

ECRI’s U.S. Future Inflation Gauge, or FIG, was far more prescient. It leads inflation cycle turning points – and in fact, also leads inflation expectations. 

Because the FIG turned down in early 2018, it was clear to us by last summer that a fresh inflation cycle downturn was at hand.

Certainly, that inflation cycle downturn wasn’t obvious to the Fed, which hiked in September and December.

And the bond market was also caught flat-footed, with market inflation expectations – the spread between 10-year treasury yields and 10-year TIPS yields – remaining high through late fall. These exaggerated inflation expectations made bond market “royalty” pound the table about a bond bear market, pushing treasury yields near 3¼% last fall.

The subsequent plunge in treasury yields, culminating in the Powell pivot in January – as well as the last six weeks’ freefall – was driven largely by plummeting inflation expectations.

That downturn was clearly anticipated by ECRI’s FIG, which has stayed in a cyclical downturn for 15 months, dropping as of this morning to its lowest reading in over three years. 

The bottom line is that the U.S. inflation cycle – a concept that most economists, including those at the Fed, don’t seem to understand – will stay in a downturn.

It’s really this lack of understanding of the inflation cycle that was behind the Fed’s abrupt about-face early this year.

Yet, ECRI clients were alerted to these developments in summer 2018, and were on the right side of this drop in rates.

Indeed, on the heels of the December 2018 rate hike, Achuthan said on CNBC’s Closing Bell, “We have our inflation cycle downturn call. The Fed is going to get there whether they like it or not. They are going to become more dovish.”

The rest is now history.   

* * * 

Click here to review our recent real-time track record. For information on our professional services please contact us. Follow @businesscycle on Twitter and on LinkedIn.

via ZeroHedge News http://bit.ly/2MDGBGE Tyler Durden

Meet The Few Silicon Valley Billionaires That Shunned Tech And Made Their Money In Real Estate

John Arrillaga and Richard Peery have made a name for themselves as the “Bill Hewlett and Dave Packard of Silicon Valley real estate,” according to Bloomberg. Despite the fact that they are little known outside of the Bay Area, the duo has been helping build Silicon Valley, as the region’s premier developers, for decades.

For instance, Google just dropped almost $139 million on “Building 900”, a property near Mountain View that was dealt by Arrillaga and Peery.

Arrillaga and Peery have now become billionaires, about a half century after they began buying cherry and apricot orchards in what used to be Santa Clara farm country. Today, they’re some of the only people in the area who have gotten rich, but not from tech.

They’re worth a combined $6 billion now and two of their contemporaries, John A. Sobrato and Carl Berg, have also reportedly become billionaires.

While tech has been making others rich, it has also put real estate in demand, sending corporate office prices through the roof and bolstering the partners’ riches. 

Drew Arvay, a managing director at Cushman & Wakefield in San Jose said: “They are just as innovative and creative as Steve Jobs and other giants of the technology world. They continue to lead the market with some of the most influential tenants and developments.”

The men are in their 80’s now, and started by developing tilt-up buildings that could be constructed quickly and now form the backdrop to much of Silicon Valley. As they got richer, they embarked on bigger projects, developing corporate campuses like Apple’s One Infinite Loop, built by the Sobrato Organization in the early 1990s.

Sobrato said:

 “No doubt I was in the right place at the right time. Building costs were under $10 a square foot and monthly shell rents were 10 cents or less per month. Today we have the same land selling for over $100 a square foot, building costs of $300 or more per square foot.”

And now Silicon Valley is one of the hottest real estate markets in the country. It’s home to Apple, Google parent Alphabet Inc. and Facebook Inc – and many other names that are hungry for real estate. 

“The only thing that can keep these companies from growing is not having places to put employees,” Arvay said.

Office rents in Silicon Valley are up 35% over the past decade, while vacancy rates have plunged from 18% to less than 10%. The value of office buildings has tripled since 2010. 

At the same time, residential real estate has also surged, a significant tailwind for landlords like Sobrato who own multifamily buildings. The price hikes, however, have also contributed to “growing inequality, homelessness and tension within local communities.” Rents were up 40% in the five years leading up to 2017 and the median monthly cost for Santa Clara County came in at $3,800 in May.

But now, the idea of a downturn looms. After a decade of price hikes, Uber’s IPO has telegraphed tepid interest in further expansion and capital investment in Silicon Valley. Additionally, some companies are taking on the task of developing their campuses themselves, while at the same time fresh builders like Related Cos. have entered the market.

Peery, Arrillaga, Sobrato and Berg are notable due to their longevity.

Julie Leiker, market director for Silicon Valley at Cushman & Wakefield said: “Throughout numerous cycles—including the oil embargo in the ’70s, the S&L crisis of the late ’80s and early ’90s, then the dot-com bust in 2001 and the Great Recession in the late aughts—the Valley’s real estate market has mirrored the region’s resiliency.

The developers have also been able to time the market successfully:

Arrillaga and Peery sold a 5.3 million-square-foot portfolio, reportedly about half their holdings at the time, for more than $1 billion in 2006, ahead of the financial crisis. Their double act is still going strong. In addition to the Mountain View deal with Google—which also involved two other properties—they are building an office complex in San Jose where the search company has agreed to lease 729,000 square feet.

Both Sobrato and his son John Michael Sobrato, who led Sobrato Organization from 1997 to 2013, have stepped away from day-to-day operations. But the family still owns the entire company, which is increasingly investing in residential units. It now has more than 6,500 apartments on the West Coast, in addition to 7.5 million square feet of Silicon Valley office space, according to its website. The family’s wealth has almost doubled in the past five years to about $8 billion, according to the Bloomberg index.

Sobrato has focused on philanthropy. He, along with his wife and son, became the first two-generation family to sign Warren Buffett’s Giving Pledge. On top of that, the family has given $550 million to charitable causes since 1996. 

Sobrato said: “Our current efforts are focused on how our projects can be both profitable and address some of the critical issues facing our region. Our large-scale developments are nearly all mixed-use with both residential and office space. Combining the two reduces traffic, increases sustainability and helps offset the housing affordability issues created by job growth.”

Phil Mahoney, executive vice chairman of brokerage Newmark Knight Frank said: “While Silicon Valley brokers are bracing for a downturn, the next one could be milder than in the past since technology is now embedded in the global economy. They’re doing fine. They’re all billionaires.”

via ZeroHedge News http://bit.ly/2QTLp9k Tyler Durden

“The Skid Is Everywhere” And We Just Got Confirmation That The Worst Is Yet To Come

Authored by Michael Snyder via The Economic Collapse blog,

All over America, large portions of our major cities are being transformed into stomach-churning cesspools of squalor.  Thousands of tens cities are popping up from coast to coast as the homeless population explodes, even the New York Times admits that we are facing “the worst drug crisis in American history”, there were more than 28,000 official complaints about human feces in the streets of San Francisco last year alone, and millions of rats are currently overrunning the city of Los Angeles.  And yet the authorities continue to insist that the economy is in good shape and that everything is going to be just fine.

Perhaps everything may seem “just fine” if you live in a heavily sanitized wealthy suburban neighborhood and you only get your news from heavily sanitized corporate media sources, but in the real world things are getting really bad.

The other day, LZ Granderson authored an editorial in which he described what life is like in Los Angeles right at this moment…

LA spent nearly $620 million in tax dollars last year to address the issue, and yet the number of homeless people increased by 16%,reaching nearly 60,000 people.

As a Los Angeles resident, I am among those who wonder what the mayor’s office is doing. When I lived downtown it was virtually impossible to walk a full block in any direction without seeing a homeless person. In Silver Lake where I live now, there are tent cities. On my drive to work I see people living underneath the highway overpasses. It’s no longer Skid Row here. The skid is everywhere.

Of course that phrase, “the skid is everywhere”, could also apply to San Francisco, Portland, Seattle, Denver, Minneapolis, Chicago, Detroit, St. Louis, Memphis, Cleveland, Baltimore, Philadelphia and countless other U.S. cities.

But without a doubt, L.A. is particularly disgusting at this point.  In fact, last weekend a columnist for the Los Angeles Times admitted that “Los Angeles has become a giant trash receptacle”

A swath of Los Angeles has devolved into a wasteland with rats scurrying among piles of decaying garbage and squalid tent cities, according to a series of stomach-churning photos that the Los Angeles Times says depict the “collapse of a city that’s lost control.”

“The city of Los Angeles has become a giant trash receptacle,” columnist Steve Lopez complained on Sunday.

We are seeing this happen at a time when we are being told that the U.S. economy is still relatively stable.

And I will concede that point.  Right now, the U.S. economy is a whole lot more stable than it will be in the months ahead.

So if things are this bad already in our major cities, what are those cities going to look like once we get deep into the next economic downturn?

On Friday, the Labor Department reported that 75,000 jobs were added to the U.S. economy in May.  That number is consistent with the extremely disappointing figure that ADP reported a few days earlier, and it is well below the number of jobs that we need just to keep up with population growth each month.

Prior to this latest report, there were already more working age Americans without a job than at any point during the last recession, and now things just got even worse.

But the government conveniently categorizes the vast majority of working age Americans without a job as “not in the labor force”, and so officially the unemployment rate is “very low” right now.

What a joke.

The truth is that the middle class has been steadily shrinking for an extended period of time, and all of the numbers that have been rolling in seem to indicate that an economic slowdown has begun.

For instance, when economic activity is expanding demand for key industrial resources such as copper, zinc and lumber increases and prices tend to go up.

But when economic activity is contracting, demand for those key industrial resources diminishes and prices tend to go down.

And right now we are seeing prices for copper, zinc and lumber decline precipitiously

Copper prices have fallen 6% in just the past month while zinc is down 8.5%. Copper and zinc are big components for many industrial and technology companies. People pay so much attention to copper as a barometer that traders jokingly call it Dr. Copper, as if it has a PhD in economics.

Lumber prices are falling as well, plunging about 10% in the past month. That could be viewed as a sign that the housing market — particularly new home construction — is weakening.

If you were looking for some exceedingly clear indications of where the U.S. economy is heading in the near future, you just got them.

But most Americans will continue to live in denial until the very end.  And even though 59 percent of the population is living paycheck to paycheck, people continue to rack up debt as if there was no tomorrow.

In fact, we just learned that the average size of a new vehicle loan in the U.S. just hit a brand new record high

People buying a new vehicle are borrowing more and paying more each month for their auto loan.

Experian, which tracks millions of auto loans each month, said the average amount borrowed to buy a new vehicle hit a record $32,187 in the first quarter. The average used-vehicle loan also hit a record, $20,137.

People ask me all the time about how they can prepare for the next economic downturn, and one of the key pieces of advice that I always give is to not take on more debt.

Right now everyone should be building up their financial cushions, because what is coming is not a joke.

Unfortunately, most Americans are still completely in denial about what is happening, and they will find themselves ill-prepared to handle the very harsh economic environment that is ahead.

via ZeroHedge News http://bit.ly/2WsxpcK Tyler Durden

Profits Plunge As Home-Flipping Hits 9-Year-High

Luxury homes aren’t the only section of the American housing market that’s showing troubling signs of weakness. Increasingly, entrepreneurs who once saw the opportunity to make quick gains by investing in gentrifying markets before offloading their homes at a premium – a practice called ‘home flipping’ – are also heading for the exits.

Homes that were resold within 12 months after being purchased made up 7.2% of all transactions in the first quarter, the biggest share since the start of 2010.

ATTOM

But while activity surged to new cycle highs, the average return on investment, not including renovations and other expenses, dropped to 39%, an almost eight-year low.

All told, profits slumped to their lowest level in eight years.

Flip

Anybody who remembers the heady years ahead of the housing market crash will recall the role that unchecked speculation allowed unqualified investors, hairdressers, strippers and others, to secure adjustable rate ‘liar loans’ that helped them enter the speculation frenzy.

Speculators are on the housing market’s front lines, where softening price growth, waning demand and longer times to sell can turn quickly into shrinking profits, or even losses. Purchases of previously owned homes fell 4.4% in April, the 14th straight year-over-year decline, according to the National Association of Realtors.

“Investors may be getting out while the getting is good,” Todd Teta, chief product officer at Attom Data Solutions, said in the report. “If investors are seeing profit margins drop, they may be acting now and selling before price increases drop even more.”

The average gross flipping profit of $60,000 in Q1 2019 translated into an average 38.7% return on investment compared to the original acquisition price, down from a 42.5% average gross flipping ROI in Q4 2018 and down from an average gross flipping ROI of 48.6% in Q1 2018 to the lowest level since Q3 2011, a nearly eight-year low.

via ZeroHedge News http://bit.ly/2wLCHkc Tyler Durden

US-China Trade War: The New Long March

via Scott Minerd, Global CIO of Guggenheim 

During the course of the last two years, we have consistently indicated that the course for the U.S. economy, along with risk assets and rates, was contingent on the impact of any unexpected exogenous events, most likely from overseas. Of all the exogenous events that could possibly derail our long-term economic and market outlook, a full-blown trade war with China is closest to being realized. Just a few weeks ago, Washington and Beijing appeared to be close to an agreement. The subsequent breakdown in talks and tit-for-tat tariff escalations have put the world’s two largest economies on a collision course to a full-scale trade war. The United States has announced an increase in tariffs on $200 billion of consumer and other goods from 10 percent to 25 percent, with threats of further tariffs to come. China followed suit with its own schedule of increased tariffs on $60 billion of American-made products.

.@ScottMinerd, Chairman of Investments and Global CIO, explains on @BloombergTV the implications of a #tradewar with #China and why #tariffs have historically been bad for markets. https://t.co/cNwCilQvAl pic.twitter.com/DJSHp5ZZhe

— Guggenheim Partners (@GuggenheimPtnrs) June 5, 2019

Given the limited historical precedent, it is difficult to predict if this face-off will continue long term or be resolved quickly. By all reports, neither the Chinese nor the Trump administration seem prepared to blink, but rather than rely on the press for insight, we decided to do some of our own digging. We recently talked to several China-based portfolio managers and a supply chain manager to learn more about the U.S.-China standoff. The main takeaway from our notes below: The Chinese are buckling up for a long ride.

  • Beijing is preparing for a protracted standoff. The leadership has concluded that the intention of U.S. negotiators is not just to resolve trade imbalances but also prevent China from moving up the value chain, a key long-term objective for the Chinese.

  • Tariffs on the remaining $300 billion of Chinese products would hurt China, but the United States would also feel the pain. Profit margins for consumer goods manufacturers average less than 5 percent. U.S. importers would either have to pay the tariffs, charge their customers more, or find suppliers elsewhere.

  • The short-term impact on China could be smaller than previously expected. Factories that sold only to the United States have developed new markets over the past year. Even if those factories stop exporting to the U.S., they will not go bankrupt immediately. It helps that the service sector is experiencing a labor shortage and could absorb some slack. For example, in China a delivery man sometimes makes more than an average office worker.

  • Huawei will not be a part of any negotiations. Beijing thinks that Huawei is more of a political issue and would be targeted whether or not they make concessions on trade.

  • The best policy response for the Chinese is to open up the domestic economy and have the state retreat from competitive sectors. Our sources see the tax cuts as an essential step in reducing the government’s role in allocating resources, and that the pressure from the United States could ultimately force Beijing to seek a solution that makes the economy more productive.

  • There has been a significant shift in the way that Beijing manages nationalist sentiment inside China. Until May the government had been trying to contain hawkish views on the U.S.-China relationship, but now they are just letting it grow. (See Now China’s Got Its Own Anti-U.S. Trade War Song.) Not only does this demonstrate that Beijing does not expect any short-term solution, because the negative sentiment will make it difficult for President Xi to make concessions, it also allows China to harden its diplomatic position given popular domestic sentiment.

  • As for whether the Chinese are front-loading shipments to the United States to avoid pending tariffs, port data and local analysts indicate this has not yet happened. Shipments to the United States and shipping prices have dropped since the new tariffs were announced. The pending tariffs could cause some front loading, but it would be hard to beat the latest round of tariffs because they were imposed a few days after the announcement. Only products shipped before the new tariffs’ effective date are exempt.

The consequences of a protracted trade war are manifold. The economic impact includes a drag on economic growth, import price inflation which will allow U.S. domestic and other foreign policy makers to raise prices, and the knock-on effects to other trading partners as the shuffle begins to find new sources and markets for different products. Researchers at the New York Fed have determined that the new round of tariffs on Chinese products will cost the typical American household an additional $831 per year. Trade barriers between the world’s economic superpowers will slow global growth and put political pressure on all affected governments, stoking increasing nationalism and protectionism overseas while increasing inflation and reducing living standards at home.

The investment implications of a protracted trade war are still playing out. We have seen how sensitive markets have been to the trade news, with a strong risk-off bias resulting from adverse developments in the fourth quarter. While volatility will continue, there is no indication that the Chinese will attempt to liquidate their large holdings of U.S. Treasury securities. To do so would only drive down the value of the dollar, which would run counter to Beijing’s desire for a weaker yuan. There is also no imminent change to monetary policy from the Federal Reserve as a result of trade saber-rattling, but if the financial markets begin to spiral out of control because of tariffs, then we could see a repeat of 1998, when the Fed eased as a result of the Asian financial crisis. With neither side apparently willing to step back from the brink, investors should be discounting a higher probability for a drawn-out fight.

At this point I have to pause and consider current facts and wonder why risk assets continue to hold up under the looming risk of a full-scale trade war. I am struck by the recent statement by Xi Jinping during his domestic tour to Jiangxi, a remote location where Deng Xiaoping began the Long March during the Chinese civil war with the Nationalist Party government.

“We are here at the starting point of the Long March to remember the time when the Red Army began its journey,” Xi said in his speech. “We are now embarking on a new Long March, and we must start all over again.” The Long March lasted for over one year while the armies of Mao Zedong regrouped and ultimately won the war.

The conclusions are obvious. Unless the current trajectory is quickly changed, the Chinese are digging in for a long fight. The cost to the United States will be high; the cost to the Chinese will be higher. The only question is who will endure and be the most innovative in this battle of wills. As I have written before in No One Wins a Trade War,” the short-term costs are likely to outweigh the long-term benefits regardless of who “wins.”

In the meantime, sovereign bond yields around the world are sending an ominous message, which investors in risk assets ignore at great peril. Their demise is near unless men succumb to the “better angels of our nature.” Those words were Abraham Lincoln’s appeal in March of 1861, warning of the looming Civil War. Lincoln’s warnings fell on deaf ears, and today I fear that my recent warnings are receiving the same fate. In the words of Winston Churchill: “Now this is not the end. It is not even the beginning of the end. But it is, perhaps, the end of the beginning.” Let us take Churchill’s words to heart.

The time has come. The war is at hand.

via ZeroHedge News http://bit.ly/2QW5Fax Tyler Durden

2020 Democrats’ Progressive Plans Will Cost Taxpayers Trillions

As 2020 Democratic presidential contenders unveil their ambitious progressive platforms, one thing is very clear; if enacted, taxpayers will be on the hook for trillions of dollars, according to The Hill

Taking the cake would be Sen. Bernie Sanders’s (I-VT) “Medicare for All” bill, coming in at a cost of $32 trillion during its first 10 years, or an estimated 10.7 – 12.7% of GDP, according to the Mercatus Center at George Mason University. 

Candidate Jay Inslee’s “Global Climate Mobilization” plan touted by environmentalists as the “gold standard” would cost the United States $3 trillion over 10 years. The plan would see the United States rejoining the Paris Climate Accord, encouraging “climate” refugees from El Salvador, Haiti, Honduras and Nicaragua to resettle in the United States, doubling the US investment in the Global Climate Fund for green technology, and  cutting fossil fuel subsidies while “implementing widespread prohibitions against financing for fossil fuel projects overseas.”

Joe Biden wants to repeal GOP tax cuts and eliminate oil subsidies for his $1.7 trillion plan.

Meanwhile, Sen. Elizabeth Warren (D-MA) wants to eliminate tuition at public colleges and erase student debt at an estimated  cost of $1.25 trillion over 10 years. She would pay for it by slapping a 2% tax on Americans worth more than $50 million and a 3% tax on those worth over $1 billion. 

The Democrats have proposed a raft of smaller plans as well, such as Sen. Kamala Harris’s (Calif.) plan to raise teacher pay or Sen. Cory Booker’s (N.J.) proposal to make rent more affordable through housing credits, both of which reach into the hundreds of billions.

In many cases, the Democrats are explaining how they’d pay for the plans, either by rolling back the GOP’s tax cuts, levying new taxes on the wealthiest Americans or eliminating corporate subsidies.

They also argue that the changes they seek will in some cases pay for themselves, either by lowering the cost of health care and drug prices, creating new green jobs or unlocking private sector investments –The Hill

Some Democrats, including a few 2020 contenders, have knocked the grandiose plans – warning that “massive government expansions” will spook swing voters, providing ammunition to Republicans who have raised concerns that the country is sliding into socialism. 

“When you poll these issues, they’re initially popular, but when people learn about the price tag they quickly become unpopular,” said GOP strategist, Matt Gorman. “It all fits into the broader narrative that Democrats have gone all-in on government intervention and beyond that, socialism.”

The proposals also indicate that both parties have placed concerns over deficit spending on the back burner. 

President Trump had expressed interest to work with Democrats to pass a $2 trillion infrastructure bill, though he has since backtracked. And fiscally conservative groups were irate with the GOP Congress for passing a $1.7 trillion spending package in 2017 that was signed into law by the president.

The federal deficit jumped 38 percent in the first seven months of the current fiscal year, ballooning to $531 billion, well above the previous year’s $385 billion mark.

As liberals push to redirect government spending for their own proposals, they say they’ll make the case that Republicans are standing in the way of progress through their own wasteful spending and tax cuts for the wealthy. –The Hill

If we hadn’t gone to war in Iraq, if we stop shoveling hundreds of billions of dollars to the Pentagon war machine, if the Bush and Trump tax cuts had never passed and if we treated taxes as our dues in society, not a burden, we could fund all [these Democratic proposals] and more,” said progressive strategist Jonathan Tasini. 

Polls show that healthcare is a top voter concern – however Sanders’ Medicare for All proposal has become a subject of controversy among Democrats who are concerned about its price tag, and what it would do to the US economy. As The Hill notes, support drops dramatically for universal health care coverage and a single payer system when voters are told they’d have to pay more in taxes.

“It’s very common with these health care plans that they’re very popular at the bumper sticker level and then become less popular as more details come out” according to Kaiser Family Foundation senior VP for health reform, Larry Levitt. 

Sanders aside, most of the other 2020 contenders, including those who have co-sponsored Medicare for All, have pitched several ideas to either expand Medicare, or take incremental steps towards a single payer system that would allow people to keep their current insurance if desired

Former Vice President Joe Biden opposes Medicare for All, but supports lowering payments to hospitals and doctors, while eliminating consumer copays, deductibles and premiums. 

Several other 2020 contenders have also raised concerns about the cost and scope of Medicare for All. 

It’s political suicide,” former Rep. John Delaney (Md.) wrote in an op-ed for The Washington Post. 

On the environment, Democrats are making the case that global warming is an existential crisis and that no cost should be spared to address it.

But they also say that their green jobs plans will stimulate the economy and rebuild crumbling U.S. infrastructure.

Biden released a plan this week calling for $1.7 trillion in federal spending over 10 years, with trillions more coming from private sector investments. Biden proposes raising that money by repealing the GOP tax cuts and eliminating subsidies to big oil companies. –The Hill

Rep. Alexandria Ocasio-Cortez has pushed for a $10 trillion plan to effectively combat climate change, something that’s low on the list of voter priorities. 

People in the heartland just don’t see climate change as the emergency that Washington does,” said Myron Ebell, who was tapped to lead Trump’s environmental transition team. “They’re much more sensitive to energy costs and often have to drive longer distances to work or rely on pickup trucks or big rigs for work. They’re not looking to disrupt the flow of their lives.”

That said – even if Democrats take back the White House in 2020, they will be hard pressed to push through their ambitious plans while the Senate is under GOP control. 

According to Tasini, “Assuming Democrats hold the House and win the White House, every proposal to make the country better, more fair, and environmentally sustainable will be dead on arrival in the Senate as long as Mitch McConnell is majority leader.”

via ZeroHedge News http://bit.ly/2IrQ8LQ Tyler Durden

“Stop Boris” Madness In Six Pictures

Authored by Mike Shedlock via MishTalk,

Delusional Remainers believe Tories will rally around Gove, Hunt, or Javid. Forget about it.

Inquiring minds are investigating results of a recent YouGov Survey on voter attitudes towards various Tory Party candidates.

A series of questions all leads to the same place. Let’s take a look.

Leadership Confidence

Scoring Preference

The L’s and R’s represent my view of whether or not the candidates would really leave or really remain.

A customs union is worse than remaining.

Head to Head Results

Johnson is light years ahead of Gove and Hunt. Neither Gove nor Hunt matches well with Raab.

Likable Personality

Curiously, even Remainers like Johnson, and more so than Michael Gove.

Who Can Win?

Winning is where the rubber meets the road. Tory party members do not believe either Gove or Hunt would win a national election.

Reader “Chips” Comments

It’s not just Tories who need the Brexit issue resolved to avoid political catastrophe. We’ve reached the point where it is now in Labour’s/Corbyn’s interest to kill the issue and hopefully (for him) have it diminish in importance. This further increases the odds of No Deal.

The calculus has changed. Corbyn previously assumed that Brexit chaos/delays would harm the conservatives to the benefit of Labour, resulting in him being able to call for a general election and take power. However, the recent EU elections suggest otherwise. Labour would lose seats to the Brexit Party and LibDems if a general election were held soon. This is political suicide for Corbyn. The only way for Labour (and the Tories) to improve their standing is for Brexit to be resolved ASAP and for their indecisiveness and disunity to fade from voters’ memories before the 2022 elections. If Corbyn wants to become PM his only hope is to get the discussion back to issues more favorable to Labour such as National Healthcare Service (NHS) funding.

Chips’ Proposed Scenario

  1. BoJo (or another Brexiteer) takes over.

  2. BoJo attempts to re-negotiate with the EU.

  3. EU says no or only offers minor changes.

  4. BoJo returns to the UK and says that the EU is unwilling to compromise and says that the UK has no other option but No Deal. He seeks political cover by blaming the EU.

  5. Labour kicks and screams about “Tory malpractice” but offers only taken resistance to No Deal, happy that the issue is no longer front and center.

  6. Brexit party immediately dies, with voters returning primarily to the Tories but also Labour. This is nevertheless a major victory for the Brexit Party and Farage (their goal is not to create a long-lasting party).

  7. LibDems continue to whine about Remain and promote a Second Referendum. However, with Brexit resolved, many voters return to their homes primarily in Labour but also Tory. This continues with time.

  8. The status quo is restored with the Tories and Labour jockeying for the top spot with the LibDems in a distant third.

  9. At this point, the above is literally a win for everyone except for the LibDems, who nobody cares about anyway.

Point 6

Point six is an astute observation.

Corbyn does not want an election now because Farage could actually win the damn thing. Labour and the Tories would both be decimated.

Once the Tories actually deliver Brexit, there is no reason for a single issue party (whose goal is Brexit) to exist.

Other than me, Chips is the only one I have seen make this proposal.

That said, if the Tories don’t deliver Brexit, Nigel Farage could actually win a 5-way race. (Tories, Labour, Brexit Party, Liberal Democrats, Greens, Change UK). That’s 6 actually, assuming Change UK does not fold soon.

Neither the Tories nor Labour want an election now. So, the logical conclusion is Brexit will be delivered, kicking and screaming one way or another.

BoJo Irony

The irony in this setup is that the best chance Remainers may have is if BoJo does a turnaround vs his stance of leaving with no deal in October, and the EU agrees to another extension or some lengthy trap.

I am more convinced that Dominick Raab, Andrea Leadsom, or Esther McVey would not backpedal than I am of Johnson.

Raab stands alone of being willing to do whatever it takes from stopping no deal.

Those backing Remain would do best to support BoJo and hope he makes a big mistake.

via ZeroHedge News http://bit.ly/2Xxdbex Tyler Durden

Tesla Model X Reportedly On Autopilot Slams Into Construction Truck, Killing Driver, In Ukraine

Another day, yet another fatality in a Tesla where Autopilot may have played a role. 

A fatal accident involving a Tesla Model X reportedly on Autopilot occurred on the Kyiv-Zhytomyr highway in Ukraine on Friday June, 7, 2019, according to Autogeek

The Model X reportedly drove under a tanker truck (where have we heard that before?) that was helping perform roadwork, eventually causing the vehicle to fly off the road. The damage to the Model X appears to be devastating and the driver was reported dead on the spot, according to media cited by Autogeek. 

The nature of the damage indicates that the car was travelling at a high rate of speed at the time.

Law enforcement agencies are still looking into the cause of the accident. The Autogeek article “presumes” the Model X was in Autopilot mode at the time, but it also sounds like an investigation is pending. 

Tack this instance onto the list of questionable deaths and accidents that have potentially occurred as a result of Tesla beta testing its Autopilot software on its drivers. We will continue to follow this story as we continue to wait for the NHTSA to take desperately needed action to protect drivers and prevent future fatalities. 


via ZeroHedge News http://bit.ly/2IravbN Tyler Durden