Now that every Treasury auction is a potential landmine, with the backstop from the Fed gradually fading into the distance, traders are forced to start evaluating demand for US paper. And, to help them along, we can safely say that today’s 3Y auction was a far cry from the stellar demand for paper in mid-February.
Here are the details: today’s sale of $26 billion in 3Y paper printed with a high yield of 2.28%, a 0.2 bps tail to the 2.278% When Issued and the highest rate since May 2007. This was the first tale for a 3Y auction since November.
The Bid to Cover likewise disappointed, declining from 3.13 in January to 3.00, the lowest since November, if modestly above the 6M moving average.
The internals were also mediocre at best, with Indirects taking down only 49.8%, far below January’s 54.9%, and the 3M average 55.3%. Directs took down 9.7%, also below the January 11.5% if in line with the 6 month average, leaving 40.5% to Dealers, well above the 33.6% in January and 35.4% 6 month average.
Overall, a mediocre auction, and one which bond bulls will pray does not repeat during tomorrow’s sale of 10Y paper, although it is safe to say that Monday’s 14bps “volmageddon” rally may have been a major culprit for the decline in demand.
With a sense of urgency. No more dilly-dallying around.
The Fed’s balance sheet for the week ending January 31, released this afternoon, completes the fourth month of QE-unwind. And it’s starting to be a doozie.
This “balance sheet normalization” impacts two types of assets: Treasury securities and mortgage backed securities (MBS) that the Fed acquired during the years of QE and maintained afterwards.
The Fed’s plan, as announced in September, is to shrink the balances of Treasuries and MBS by up to $10 billion per month in October, November, and December 2017, then to accelerate the pace every three months. In January, February, and March 2018, the unwind would be capped at $20 billion a month; in Q2, at $30 billion a month; in Q3, at $40 billion a month; and starting in Q4, at $50 billion a month.
According to this plan, balances of Treasuries and MBS will shrink by $420 billion in 2018, by an additional $600 billion in 2019, and by an additional $600 billion every year going forward until the Fed deems the level of its holdings “normal.” Whatever this level may turn out to be, it will be much higher than the level suggested by the growth trajectory before the Financial Crisis.
For January, the plan called for shedding up to $20 billion: $12 billion in Treasuries and $8 billion in MBS.
So how did it go?
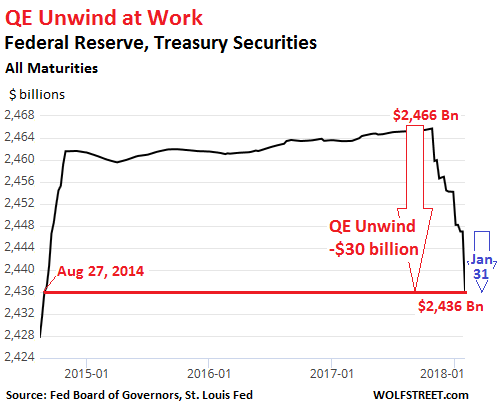
On its December 27 balance sheet, the Fed had $2,454 billion of Treasuries. By January 31, it had $2,436 billion: a drop of $18 billion in one month!
This exceeds the planned drop of $12 billion for January. But hey, over the holidays, most folks at the New York Fed, which does the balance sheet operations, were probably off and not much happened. And so this may have been a catch-up action, with a sense of urgency.
In total, since the beginning of the QE Unwind, the balance of Treasuries has plunged by $30 billion, to hit the lowest since August 27, 2014. This part of the QE Unwind is happening:
The jagged down movement in the chart is a result of the way the Fed unwinds its QE. It does not sell the securities. It allows them to “roll off” its balance sheet. It works this way:
Treasuries mature in mid-month and at the end of the month. For example, on January 31, about $27 billion of the Fed’s Treasuries matured. The Treasury Department redeemed those securities (normal bondholders would be paid face value). But the Fed has a special arrangement with the Treasury Department that cuts out the middlemen.
To maintain the level of Treasuries, the Fed would “roll over” these securities directly with the Treasury Department – replacing maturing securities with new securities.
But under the QE unwind, the Fed allows part of those securities to “roll off” rather than allowing them to “roll over.” In other words, the Fed does not replace some of the maturing securities and instead gets paid for them.
Of the $27 billion in Treasuries that matured yesterday, the Fed “rolled over” $16 billion (replaced them) and allowed $11 billion to “roll off” (got paid for them). The blue arrow in the chart above shows this big one-day move.
MBS: a jagged line and a lag of two to three months.
The Fed acquired residential MBS guaranteed by Fannie Mae, Freddie Mac, and Ginnie Mae as part of QE. Now, it’s supposed to shed them at a pace of $4 billion a month in Q4 last year and $8 billion a month in Q1 this year. So how did it go?
Residential MBS differ from regular bonds. The issuer (Fannie Mae et al.) passes through principal payments to MBS holders as underlying mortgages get paid down or get paid off. Thus, the principal shrinks in uneven increments until the remainder is redeemed at maturity.
To keep the MBS balance steady, the New York Fed’s Open Market Operations (OMO) buys MBS in the “to-be-announced market” (TBA market). The actual MBS is not designated at the time of the trade but will be announced 48 hours before the established settlement date, which can be two to three months later.
The Fed accounts for its MBS on a settlement-date basis. So there is a mismatch between the date the Fed receives principal payments and the date reinvestment trades settle. Hence the jagged line in the chart below.
Since MBS take two to three months to settle, the first declines weren’t expected to show up on the Fed’s balance sheet until sometime December. But since MBS balances have large weekly variations due to the timing issues, those early declines were hard to see.
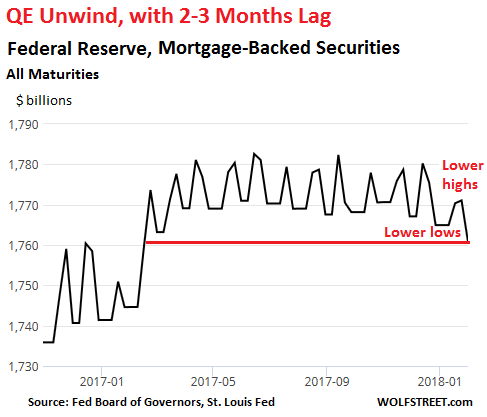
This is why we look for “lower highs” and “lower lows” with a lag of two to three months, which is what we see in January, a reflection of trades that took place around November:
At the end of October, before the MBS Unwind became visible, the Fed held $1,770.2 billion in MBS, at the low point of the period. On today’s balance sheet, also the low point in the chart, the Fed shows $1,760.7 billion. From low to low, the balance dropped $9.5 billion. This reflects trades from two to three months ago. So even the MBS Unwind is now clearly visible.
In early December, I published my article with the above explanations about why we hadn’t yet seen the MBS Unwind. About a month later, the NY Fed published its own article, confirming my explanations, including the reasons behind the jagged line and that MBS take two to three months to settle.
So why all this noise in the overall balance sheet?
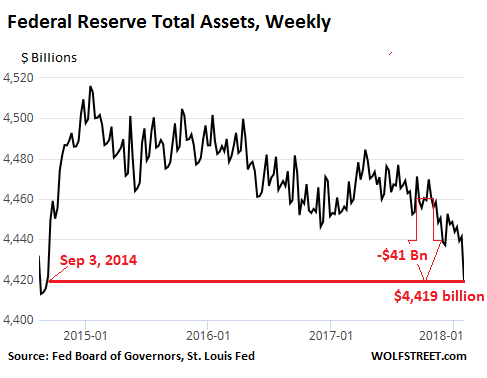
Total assets have dropped by $41 billion since the QE Unwind began, the lowest since September 3, 2014:
But why all this noise in the chart? The Fed has other roles that cause assets and liabilities to fluctuate. Among them: it is the official banker of the US government. The US Treasury keeps its cash balances on deposit at the Fed (rather than JP Morgan). When the balance fluctuates, is causes the Fed’s assets and liabilities to fluctuate, as they would with any bank.
Similarly, the Fed holds “Foreign Official Deposits” by other central banks and governments. And the Fed has other functions that impact the overall balance sheet (explained here). But movements caused by these functions have nothing to do with QE or with the QE Unwind.
For the QE Unwind, only Treasuries and MBS matter. And the Fed is shedding them — after everyone had said for years that it could never shed them. The Treasury market may be finally paying attention: The 10-year yield closed today at 2.78%, the highest since April 2014.
A sophisticated group of hackers tied to North Korea is suspected of being behind the last month’s $500 million hack of Japanese cryptocurrency exchange CoinCheck, Bloomberg reported Tuesday – according to a South Korean lawmaker who attended a meeting with the head of the country’s intelligence service.
Of course, the CoinCheck hack, which elicited a furious response from Japanese regulators who are reportedly contemplating serious sanctions against the exchange and its senior employees for its inexplicably lax security, isn’t the first where North Korea tied groups are suspected of involvement: They are widely believed to have been responsible for the collapse of South Korean exchange YouBit back in December.
The CoinCheck hack -widely believed to be the largest crypto heist in history, eclipsing the nominal value taken from Mt. Gox – is being investigated by the South’s National Intelligence Service, which already has its hands full preparing for the Winter Games in PyeongChang, set to begin Friday.
CoinCheck executives answer questions from Japanese regulators.
According to South Korean intelligence, there are unspecified similarities between the Youbit and CoinCheck hacks – though the South Korean spy agency admits it has no direct evidence.
The North is well-known for its hacking prowess. NK-linked hackers are suspected of perpetrating some of the most high-profile hacks of the last five years, including the WannaCry and Petya hacks last spring, and the embarrassing 2014 hack of Sony Pictures. In an interesting innovation, North Korean hackers are suspected of infiltrating systems and installing malware to discreetly mine cryptocurrencies like Monero. Some of these illegal Monero miners have been found in the systems of Russia’s largest energy pipeline company.
The National Intelligence Service is investigating last month’s incident – one of the largest cryptocurrency heists in history – based on similarities with past cases associated with its northern neighbor’s cyber-attack apparatus, said the lawmaker, who didn’t want to be identified because of the sensitivity of the information. The South Korean agency is now examining the incident with cooperation from international authorities, the lawmaker added.
Cybersecurity experts say North Korea has master-minded a growing number of crypto-heists in past years, as Kim Jong Un’s hermit regime seeks capital to bankroll its nuclear weapons program and circumvent tough international sanctions. South Korean investigators are already said to be looking into Pyongyang’s involvement in the hack of Seoul-based exchange Youbit, which collapsed in December. In a recent twist, cyber-sleuths say the regime’s attacks have expanded to include hijacking computers to mine digital currencies — particularly hard-to-trace Monero.
South Korea’s spy agency hasn’t been able to unearth evidence of North Korean involvement in the Coincheck case, but was exploring that avenue based on Pyongyang’s track record and patterns observed in previous attacks, the lawmaker said. Representatives for the NIS and defense ministry weren’t immediately available for comment.
Contrary to crypto enthusiasts’ claims that cryptocurrencies are more secure than conventional money, their vulnerability to cybertheft has been widely cited as one of the catalysts for bitcoin’s precipitous 60%+ drop from its highs late last year. Furthermore, China’s intensifying crackdown – it’s now seeking to block Chinese traders from accessing offshore crypto exchanges – and India’s revelation that it would do everything in its power to stifle the digital currency market have also rattled investors.
Even US regulators are stepping up their scrutiny: The SEC and CFTC – the two primary federal regulators tasked with overseeing cryptocurrencies – are set to testify before the Senate Banking Committee this morning.
Meanwhile, the rout in crypto land continues Tuesday, with bitcoin trading below $7,000 on GDAX.
Yesterday’s historic VIX move already destroyed an entire asset class: the inverse VIX ETN are no more, meaning retail no longer has a handy, convenient way to short vol, which incidentally is for the better. Unfortunately, what it means is that retail will now simply short VIX ETNs like VXX, exposing themselves to unlimited downside risk but that’s what natural selection is all about.
“Yesterday’s move has certainly generated a lot of damage for all implicit short volatility strategies, including trend followers,” said Nicolas Roth, head of alternative assets at Reyl & Cie, envisioning pretty much everyone these days, including both professional and retail investors. “Most systems are designed somehow to capture trends and this sell-off appeared out of nowhere for a quantitative system.”
Still, one thing that was missing in the chaos following yesterday’s vol explosion was specific asset manager names that got crushed: after all, someone must have gotten the proverbial margin call tap on the shoulder.
And while a list of casualties is still missing, a few names have emerged courtesy of Bloomberg. One is the UK’s Man Group, which tumbled as much as 7.9%, the most in almost a year, as one of the firm’s main funds dropped on rising volatility, with stock volume more than double the ADV of the past three months.
Man AHL Diversified Futures plunged about 4.6% on Monday as market trends suddenly reversed, leaving the fund flat for the year, according to a person with knowledge of the matter. The strategy “had a very bad day yesterday, that’s not a surprise,” said David McCann, an analyst at Numis Securities Ltd. “That’s in the context of some very good performance year-to-date.”
One firm that according to preliminary reports was the closest to a near-death experience, was Option Solutions LLC. The hedge fund that trades equity options lost as much as 65% after it was forced to sell holdings overnight, according to a Bloomberg report. The good, so to speak, news is that the fund remains in business and will waive its incentive fee for new investors until the fund returns to its high watermark. Considering the size of the handicap, that will probably never happen, although it is not clear if anyone will notice: the firm had managed about €65 million before the losses.
“The market became completely illiquid as volatility increased far in excess of the market movement,” Paolo Compagno, a partner at the London-based firm, said in an email to investors seen by Bloomberg News. “We were forced to liquidate throughout the night and morning.”
To be sure, some funds were delighted by the surge in volatility, which was a long time coming for the $325 million True Partner, and acts as a hedge against greater levels of turbulence in global financial markets.
Last year the flagship fund was down 5.6% and up 0.4 percent in 2016. The fund had gained about 17 percent in 2015, benefiting from the flash crash that year.
Still, the real casualties are expected to emerge only with a substantial delay: “Traders who were short volatility just had to puke,” according to Tobias Hekster, co-CIO at True Partner Advisor. “And our expectation is we’re not done yet.”
Israel began warning thousands of African migrants on Sunday that they must leave by the end of March, officials said, under a plan that could see them jailed if they refuse.
On 3 January, Prime Minister Benjamin Netanyahu announced implementation of a plan to deport about 38,000 migrants who had entered the country illegally, mainly Eritreans and Sudanese.
The controversial plan gives them until the end of next month to leave voluntarily or face jail and eventual expulsion.
Immigration authority spokeswoman Sabine Haddad told AFP that officials began issuing migrants letters on Sunday advising them that they had 60 days in which to leave the country voluntarily.
For now, the notices are being given only to men without families, officials said.
Israeli newspaper Haaretz said “anyone recognised as a victim of slavery or human trafficking, and those who had requested asylum by the end of 2017 but haven’t gotten a response” would also be exempt for now.
It added that this left the number subject to near-term deportation at “between 15,000 and 20,000 people.”
The authority is offering those who agree to leave a grant of $3,500, a flight ticket and help with obtaining travel documents.
Should they not leave by the deadline, the grant would be reduced and “enforcement measures” would be taken against them and anyone employing them, the authority says.
Israel refers to the tens of thousands of African migrants who entered the country illegally from neighbouring Egypt as “infiltrators”.
Israeli officials tacitly recognise that it is too dangerous to return Sudanese and Eritreans to their troubled homelands, but local media say the notices do not specify where departing migrants would be sent.
Aid workers and media have named Uganda and Rwanda, although both countries deny being a destination for migrants being expelled involuntarily.
Public opposition to the plan has been slow to build, but some Israeli airline pilots have reportedly said they will not fly forced deportees.
Academics have published a petition and Israeli Holocaust survivors wrote an open letter to Netanyahu last month pleading with him to reconsider.
Netanyahu on Sunday accused US Jewish billionaire George Soros of being behind the campaign against the forced deportations, Haaretz also reported.
“George Soros is also funding the protests. Obama deported two million infiltrators and they didn’t say anything,” he said at the weekly Cabinet meeting.
The UN refugee agency has called on Israel to scrap the plan, calling it incoherent and unsafe.
A 2016 UN commission of inquiry into Eritrea’s regime found “widespread and systematic” crimes against humanity, and said an estimated 5,000 people flee the country each month.
The International Criminal Court has indicted Sudanese President Omar al-Bashir on charges of war crimes, crimes against humanity and genocide linked to his regime’s counter-insurgency tactics in the Darfur conflict.
Student activists at the College of Wooster have issued a list of demands, including more funding for the liberal arts college’s Center for Diversity and Inclusion, the immediate expulsion of a student currently being investigated for making racist statements online, the hiring of new administrators of color, and a fix to a funding imbalance between student groups that promote diversity and athletic clubs.
“Men’s Ultimate Frisbee received $15,747.78” this school year, the students wrote. “Brothers of Diversity received $984.”
Activists described the imbalance as “problematic,” arguing that it reflects the college’s failure to advance the cause of racial harmony.
“The discrepancy between funding of groups is problematic when we review community-wide initiatives such as, the promotion of diversity and inclusion,” they wrote. “The College’s implicit financial favoring of non-essential diversity groups exemplifies the institutions failure to support minority groups.”
Activists also want all new students and faculty members—even tenured ones—to undergo mandatory cultural sensitivity training. The curriculum would be determined by the Center for Diversity and Inclusion, with input from students.
They also asked the college to provide a means for students to report professors who make “bigoted statements,” to hire administrators of color to serve as advocates for students of color who have survived sexual assault, and to provide designated safe spaces for each minority group on campus.
The list of demands also calls for the “immediate expulsion” of Drake Schwenke. Schwenke, a member of the group “Wooster Right-Wingers,” and has been accused of posting anti-Semitic images on social media. The campus paper, The Wooster Voice, reports that the college is investigating Schwenke, but the activists are apparently impatient to see him expelled more swiftly. It’s a matter of safety, they say:
Since the meeting, many students have called on the College to act more swiftly in disciplining Schwenke. Several students tweeted at President Bolton’s official Twitter account demanding Schwenke’s expulsion.
“Before I came to school my parents were promised by admin that I would be safe here,” said Desi LaPoole ’20 in a tweet mentioning Bolton’s account. “Now they’re asking me if I want to transfer to a safer school after I told them the racist Drake Schwenke is still on campus.”
In a tweet referencing a similar incident where a student said she had was expelled after posting racist videos, Khorkie Tyus ’18, vice president of the Black Students Association, said, “So @WoosterEdu the ball is in your court now, University of Alabama acted within a 24hr time span and we’re almost at a week! This simply shows that other campuses have a higher regard for their students safety and concerns, but your lack of action can be read as complacency.”
The activists also accused several staff members of perpetuating “anti-blackness, stereotyping minority groups,” and “hate speech.” These staff members were named; their crimes were not specified. According to Campus Reform, the student newspaper published a version of the demands that redacted the names of these faculty members, since the allegations are unproven.
Wooster President Sarah Bolton is apparently eager to pacify the activists. She has announced plans to make “more comprehensive educational efforts in the areas of cultural competency and sexual misconduct; more effective and easily accessible reporting and response mechanisms for all types of bias-related harm; and new resources for student groups engaged in work related to diversity, equity, and inclusion.”
Hiring an army of additional diversity bureaucrats while spending more time, money, and effort policing microaggressions and erecting safe spaces may or may not improve race relations on campus. But that path would pose serious concerns for free expression on campus. And I can’t think of anything more likely to undermine the quest for greater tolerance than cutting the Ultimate Frisbee budget.
Confused by the technical details surrounding the volatility-tail that is wagging your 401(k)’s dog of a portfolio in an irrational manner? Well, you’re about to lose your mind.
While the mainstream media will ‘sell’ the idea that stocks rise on ‘earnings’ or ‘the economy’, most by now realize that the marginal move in stocks is always about the marginal buyer or provider of liquidity.
Yesterday’s short-vol-trade-collapse should have slapped that awareness into more than a few market participants who got a glimpse behind the curtain at what really drives stocks.
Today we see VIX continuing to rise again, ETFs halted and redemptions suspended, and judging by the options market, it is far from over…
Vol-of-vol, as measured by the VVIX (the implied vol of 1m VIX options) climbed to 177.3 on Monday, 05-Feb, its highest level of all-time.
The spike surpassed the previous high of 169.8 realized on 24-Aug-2015.
And the VIX term structure is notably inverted/backwardation…
Interestingly, the current level of the VIX 1m future reached 33.2 at the close on 05-Feb, notably higher than the 25.1 level realized on 24-Aug-15. For reference, the VIX 1m future exceeded today’s 33.2 level during the 2008, 2010, and 2011 selloff events.
By now most market participants have been able to see through the smoke and mirrors of Friday’s ‘explosive’ wage growth data (driven by a drop in hours worked and declined on a weekly basis) but the narrative remains one of soaring wage growth and inflation anxiety on mainstream media today.
Perhaps that is why Goldman Sachs penned a rather fascinating report over the weekend that played down wage growth stories dramatically and – most surprisingly – pointed the squid-finger at the ever-increasing concentration of American business as the reason why… in other words, enabling oligopolistic (or monopolistic) economies across various sectors has crushed the American Dream for many – and will continue.
Goldman’s Jan Hatzius notes that the wage data released last week provided positive early indicators of a potential reacceleration of wages, which disappointed in 2017, but a strong of recent data misses in the various wage series – including the Atlanta Fed wage tracker and median weekly wages series from the household survey – have pushed down our broader wage growth tracker to just 2.1% as of Q4, as shown below.
More broadly, the moderate pace of wage growth over the last couple of years has fallen short of the expectations of many observers.
While the labor share – the part of national income paid to workers—has recently continued its decades-long decline, US corporate profit margins have risen further to historic highs, especially for the most profitable firms. Over the last two decades, most industries have also become more concentrated with a few large firms earning a larger share of revenue, potentially shifting the bargaining power from consumers and workers to firms and employers.
As the chart above shows, average wage growth has fallen from 3.5% in 1985-2007 to 2.1% in 2008-2017. While much of the weakness in wage growth over the last decade relative to pre-crisis norms can be attributed to cyclical labor market slack and soft price inflation, longer-run declines in trend productivity growth and in the trend labor share are currently still weighing on wage growth.
Exhibit 2 shows that the part of nonfarm business income paid to workers has fallen by 6 percentage points (pp) since 1999 to just 56%, while corporate profit margins have continued to rise.
Goldman suggests that rising concentration of employment could shift the balance of bargaining power from workers to employers. Wage-setting power allows employers to lower wages below workers’ marginal revenue product without losing too many employees. While a handful of superstar employers with better technologies could choose to hire more workers and pay higher wages than less productive firms, the limited availability of attractive alternative employers may prevent workers from earning their full marginal revenue product.
Exhibit 4 shows that the share of total industry sales attributed to the largest 50 firms has increased in 10 of the 13 two-digit industries covered by the Economic Census.
About 75% of the NAICS three-digit industries have experienced an increase in concentration levels over the last two decades. We have documented in previous research the relationship between concentration and profit margins, as illustrated in the right panel of Exhibit 4.
And as Goldman concludes,
Combining the average decline in the number of establishments in 2001-2016 and our coefficient estimates, we estimate that the rise in labor market concentration accounts for a 1% hit to the level of wages since 2001, or a 0.05-0.1pp drag to annual wage growth. A crude sum of our product and labor market concentration estimates suggests a combined drag from the rise in concentration to annual trend wage growth of around 0.25pp.
Which roughly translated means America’s increasingly monopolistic corporatocracy has weighed heavily on Average Joe’s wages…
And Goldman is not entirely optimistic this improves anytime soon…While the cyclical outlook for wage growth looks increasingly favorable given the ongoing fall in labor market slack, a continued decline in the trend labor share would hold down trend wage growth…we remain cyclically optimistic about wage growth and continue to expect a renewed acceleration as the labor market tightens further. Over a longer horizon, our analysis shows that the potential of continued rise in concentration implies some downside risk to our 3-3.25% trend wage growth estimate.
What’s the best way to address the national problem of opioid abuse and overdose deaths? “My take,” President Donald Trump declared in Ohio yesterday, “is you have to get really, really tough, really mean with the drug pushers and the drug dealers. We can do all the blue ribbon committees we want—[applause]—we have to get a lot tougher than we are.”
The president’s dismissal of blue ribbon commissions is somewhat perplexing, since he ordered that one be created just last March—the President’s Commission on Combating Drug Addiction and the Opioid Crisis. In any case, the president is evidently eager to rev up the war on drugs.
What might the president mean by getting really tough on drug pushers? One clue might be his phone call to Philippines President Rodrigo Duterte last April. “I just wanted to congratulate you because I am hearing of the unbelievable job on the drug problem,” Trump said. “Many countries have the problem, we have a problem, but what a great job you are doing and I just wanted to call and tell you that.”
Duterte is indeed doing an “unbelievable job,” according to Human Rights Watch. The group estimates that that Duterte’s drug war has killed more than 12,000 drug suspects so far.
As big a blustering blowhard as our president is, I trust that he is not actually contemplating Duterte-style extrajudicial killings when he says “we have to get a lot tougher than we are.” Nevertheless, it is clear that the president has learned nothing from the failures of the war on drugs. Over the past four decades, the government has spent more than trillion dollars, locked up millions of Americans, and undermined our civil liberties, especially our Fourth Amendment protections against search and seizure, to stop the drug trade. Despite all the resources wasted and lives lost, the prices of illicit drugs have generally declined.
Prohibitionists claim that the drug war has reduced drug-related crime, decreased drug-related disease and overdose, and disrupted and dismantled organized criminal enterprises. But in a paper last year for the Cato Institute, George Mason University economists Christopher Coyne and Abigail Hall show that “prohibition is not only ineffective, but counterproductive, at achieving the goals of policymakers both domestically and abroad. Given the insights from economics and the available data, we find that the domestic War on Drugs has contributed to an increase in drug overdoses and fostered and sustained the creation of powerful drug cartels.”
My Reason colleague Jacob Sullum concurs: “The government has contributed to [opioid] deaths in several ways. It created a black market in which drug users do not know what they are getting, encouraged traffickers to move toward increasingly compact and potent products (such as fentanyl), and reduced access to less dangerous alternatives (such as prescription painkillers).”
What will work? Needle exchanges will reduce the spread of diseases. Making the overdose-reversing drug naloxone more readily available will reduce overdoses. And the president’s own drug addiction commission recommended the removal of federal barriers that limit access to any forms of FDA-approved medication-assisted treatment for drug dependent folks.
Beyond that: In a stark contrast to Duterte’s bloody anti-drug campaign, one country has shown that the way to win the drug war is to end it. Portugal has decriminalized all drug use and focuses instead on treatment. The annual rate drug of overdose deaths in Portugal is now 1 per 170,000 citizens. The figure is 33 times higher in the U.S., at 1 per 5,100 Americans. President Trump ought to make a congratulatory call to Portugal instead, and ask about the “great job” that country is doing in handling its drug dependence problems.
Only one thing matters in bubble markets: sentiment
Yesterday saw Jerome Powell sworn into office as the new Chairman of the Federal Reserve, replacing Janet Yellen. Looking at the sea of red across Monday’s financial markets, Mr. Powell is very likely *not* having the sort of first day on the job he was hoping for…
Also having a rough start to the week is anyone with a long stock position or a cryptocurrency portfolio.
The Dow Jones closed down over 1,200 points today, building off of Friday’s plunge of 666 points. The relentless ascension of stock prices has suddenly jolted into reverse, delivering the biggest 2-day drop stocks have seen in years.
But that’s nothing compared to the bloodletting we’re seeing in the cryptocurrency space. The price of Bitcoin just broke below $7,000 moments ago, now nearly two-thirds lower from its $19,500 high reached in mid-December. Other coins, like Ripple, are seeing losses of closer to 80% over the same time period. That’s a tremendous amount of carnage in such a short window of time.
And while stocks and cryptos are very different asset classes, the underlying force driving their price corrections is the same — a change in sentiment.
Both markets had entered bubble territory (stocks much longer ago than the cryptos), and once they did, their continued price action became dependent on sentiment much more so than any underlying fundaments.
The Anatomy Of A Price Bubble
History is quite clear on how bubble markets behave.
On the way up, a virtuous cycle is created where quick, outsized gains become the rationale that attracts more capital into the market, driving prices up further and even faster. A mania ensues where everyone who missed out on the earlier gains jumps in to buy regardless of the price, desperate not to be left behind (this is called fear of missing out, or “FOMO”).
This mania produces a last, magnificent spike in price — called a “blow-off” top — which is then immediately followed by an equally sharp reversal. The reversal occurs because there are simply no remaining new desperate investors left to sell to. The marginal buyer has suddenly switched from the “greater fool” to the increasingly cautious investor.
Those sitting on early gains and looking to cash out near the top start selling. They don’t mind dropping the price a bit to get out. So the price continues downwards, spooking more and more folks to start selling what they have. Suddenly, the virtuous cycle that drove prices to their zenith has now metastasized into a vicious cycle of selling, driving prices lower and lower as panicking investors give up on their dreams of easy riches and increasingly scramble to limit their mounting losses.
In the end, the market price retraces nearly all of the gains made, leaving a small cadre of now-rich early investors who managed to get out near the top, and a large despondent pool of ‘everyone else’.
We’ve seen this same compressed bell-curve shape in every major asset bubble in financial history:
And we’re seeing it play out in real-time now in both stocks and cryptos.
The Bursting Crypto Bubble
It’s amazing how fast asset price bubbles can pop.
Just a month ago, the Internet was replete with articles proclaiming the new age of cryptocurrencies. Every day, fresh stories were circulated of individuals and companies making overnight fortunes on their crypto bets, shaking their heads at all the rubes who simply “didn’t get” why It’s different this time.
Here at PeakProsperity.com the demand for educational content on cryptocurrencies from our audience rose to a loud crescendo.
We did our best to provide answers as factually as we could through articles and webinars, though we tried very hard not to be seen as encouraging folks to pile in wantonly. A big reason for this is we’re more experienced than most in identifying what asset bubbles look like.
To us, the run-up in the cryptocurrencies seen over 2017 had all the classic hallmarks of an asset price bubble — irrespective of the blockchain’s potential to unlock tremendous long-term economic value. Prices had simply risen way too far way too fast. Which is why we issued a cautionary warning in early December that concluded:
So, if you’ve been feeling like the loser who missed the Bitcoin party bus, you’ve likely done yourself a favor by not buying in over the past few weeks. It is highly, highly likely for the reasons mentioned above that a painful downwards price correction is imminent. One that will end in tears for all the recent FOMO-driven panic buyers.
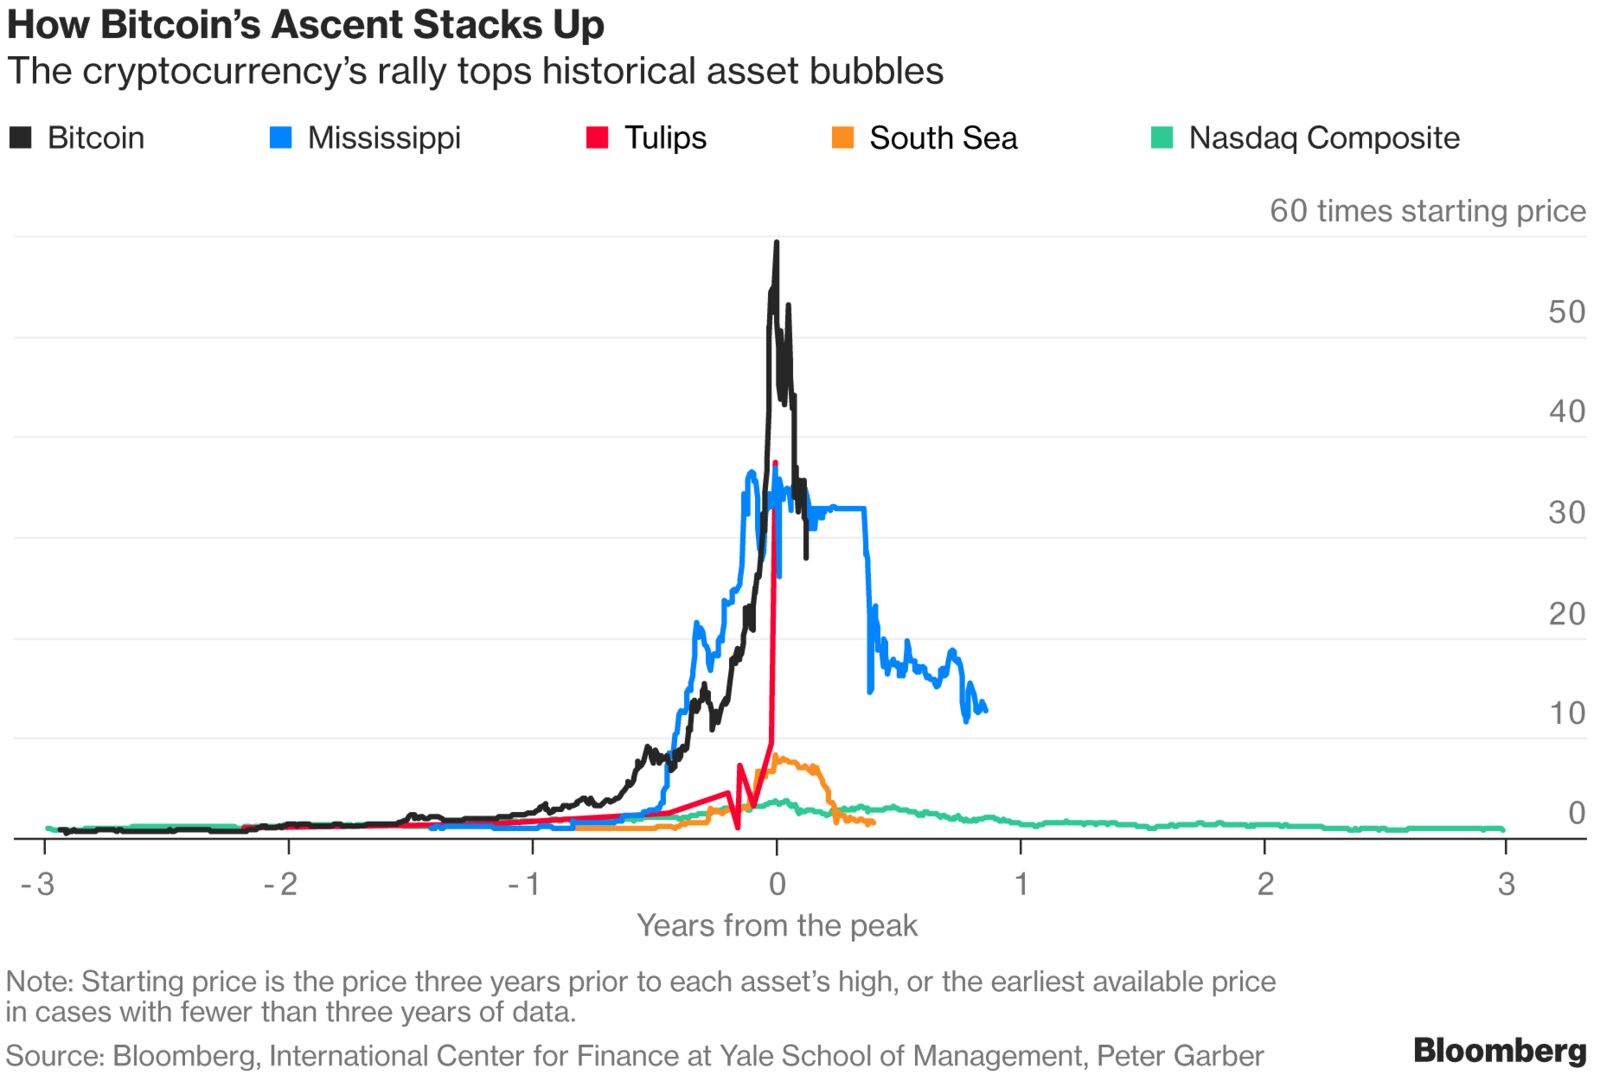
And now that time has shown this warning to have been prescient in both its accuracy and timeliness, we can clearly see that Bitcoin is following the classic price trajectory of the asset price bubble curve. The chart below compares Bitcoin’s current price to that of several of history’s most notorious bubbles:
This chart (which is from Feb 2, so it doesn’t capture Bitcoin’s further decline below $7k) shows that Bitcoin is now about 2/3 of its way through the bubble life-cycle, and about half-way through its fall from its apex.
Projecting from the paths of previous bubbles, we shouldn’t be surprised if Bitcoin’s price ends up somewhere in the vicinity of $2,500-$3,000 by the time the dust settles.
Did The Stock Market Bubble Just “Pop”?
Despite the extreme drop in the stock market over the past two days, any sort of material bubble retracement has yet to begin — which should give you an appreciation of how overstretched its current valuation is.
Look at this chart of the S&P 500 index. Today’s height dwarfs those of the previous two bubbles the index has experienced this century.
The period from 2017 on sure looks like the acceleration seen during a blow-off top. If indeed so, does the 6% drop we’ve just seen over the past two trading days signify the turning point has now arrived?
Crazily, the carnage we’ve seen in the stock market over the past two days is just barely visible in this chart. If indeed the top is in and we begin retracing the classic bubble curve, the absolute value of the losses that will ensue will be gargantuan.
If the S&P only retraces down to the HIGHS of its previous two bubbles (around 1,500), it would need to fall over 43% from where it just closed today. And history suggests a full retracement would put the index closer to 750-1,000 — at least two-thirds lower than its current valuation.
How Spooked Is The Herd?
As a reminder, bubbles are psychological phenomena. They are created when perception clouds judgment to the point where it concludes “Fundamentals don’t matter”.
And they don’t. At least, not while the mania phase is playing out.
But once the last manic buyer (the “greatest” fool) has joined the party, there’s no one left to dupe. And as the meteoric price increase stops and then reverses, the herd becomes increasingly skittish until a full-blown stampede occurs.
We’ve been watching that stampede happen in the crypto space over the past 4 weeks. We may have just seen it start in the stock markets.
How much farther may prices fall from here? And how quickly?
History gives us a good guide for estimating, as we’ve done above. But the actual trajectory will be determined by how spooked the herd is.
For a market that has known no fear for nearly eight years now, a little panic can quickly escalate to an out-of-control selling frenzy.
Want proof? We saw it late today in the complete collapse in XIV, the inverse-VIX (i.e. short volatility) ETN that has been one of Wall Street’s most crowded trades of late. It lost over 90% of its value at the market close:
The repercussions of this are going to send seismic shockwaves through the markets as a tsunami of margin calls erupts. A cascading wave of sell-orders that pushes the market further into the red at an accelerating pace from here is a real possibility that can not be dismissed at this point.
Those concerned about what may happen next should read our premium report Is This It? issued over the past weekend.
In it, we examine the congregating perfect storm of crash triggers — rising interest rates, a fast-weakening dollar, a sudden return of volatility to the markets after a decade of absence, rising oil prices — and calculate whether the S&P’s sudden 6% rout is the start of a 2008-style market melt-down (or worse).
Make no mistake: these are sick, distorted, deformed and liquidity-addicted bubble markets. They’ve gotten entirely too dependent on continued largess from the central banks.
That is now ending.
After so many years of such extreme market manipulation finally gives way, the coming losses will be staggeringly enormous.
The chief concern of any prudent investor right now should be: How do I avoid being collateral damage in the coming reckoning?


 Student activists at the College of Wooster have issued a list of demands, including more funding for the liberal arts college’s Center for Diversity and Inclusion, the immediate expulsion of a student currently being investigated for making racist statements online, the hiring of new administrators of color, and a fix to a funding imbalance between student groups that promote diversity and athletic clubs.


 What’s the best way to address the national problem of opioid abuse and overdose deaths? “My take,” President Donald Trump