Confidence abounds. Last week, Investor’s Intelligence reported a surge in advisory sentiment to the highest bullish percentage since October 19, 2007. John Hussman notes that NAAIM reported that the 3-week average equity exposure among its members increased to the highest level on record. Given the unfortunate resolution of similarly extreme overvalued, overbought, overbullish, rising-yield periods in history, it's almost mind-boggling that investors actually expect the present speculative run to end well. The accelerating pitch and shallowing corrections of the recent advance are worth noting.
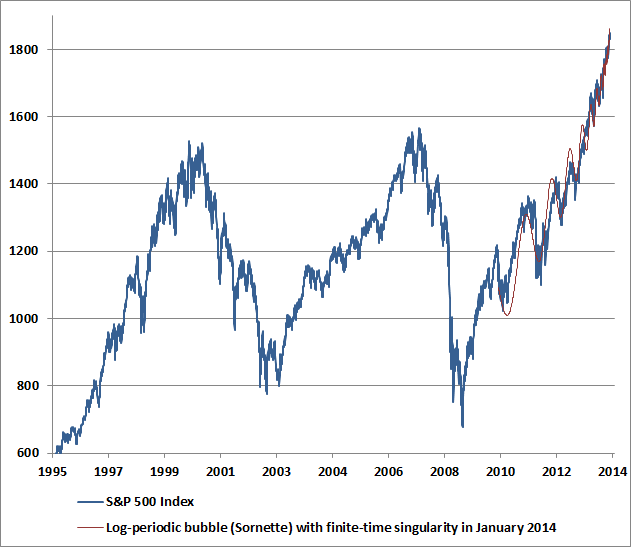
Based on the fidelity of the recent advance to this price structure, we estimate the “finite-time singularity” of the present log-periodic bubble to occur (or to have occurred) somewhere between December 31, 2013 and January 13, 2014. That does not mean that prices must immediately crash – only that the dynamics will then lend themselves to a great deal of potential instability, if prior log-periodic bubbles in equity and commodity markets across history are any indication. It bears repeating that our own defensiveness is driven by a broad ensemble of evidence, not simply price dynamics, not simply valuations, not simply sentiment, but the “full catastrophe” – which includes the fact that strong economic, speculative and monetary enthusiasm has historically been quite a contrary indicator for stocks.
The chart below shows the current position of the S&P 500. The light red line shows the log-periodic price trajectory that most closely approximates the present overvalued, overbought, overbullish, Fed-induced speculative run since 2010. While the initial gains from the 2009 low until about mid-2010 represented what we view as a move from reasonable valuation to full valuation (our stress-testing “miss” was not on valuation grounds), I expect little, if any of the market’s gains since 2010 to be retained by investors over the completion of this market cycle. Despite very short-run uncertainties about market direction, I should note that we now estimate negative prospective total returns for the S&P 500 on every horizon of less than 7 years.
And this is what Hussman said in 2007…
“Wall Street remains exuberant about economic prospects. Last week brought a 6-year high in consumer confidence, evidently supporting the idea that the consumer remains strong and the economic expansion remains intact. Unfortunately, if you examine the data, you'll quickly discover that consumer confidence is a lagging indicator, well explained by past movements in GDP, employment, and capacity utilization. Worse, for the stock market, it's a contrary indicator.
This is a fact that I've noted at both extremes, not only in early 2000 when new highs in consumer confidence supported a defensive position, but conversely in the early 1990's, when new lows in consumer confidence supported a leveraged position in stocks. High levels of economic optimism are regularly observed at the peaks of both U.S. and foreign economic expansions.
This includes the general consensus of individuals, businesses, politicians, central bank officials and notoriously – economists. That shouldn't be surprising. It's the very nature of a peak that it can't be produced except by unusual optimism.”
Hussman Weekly Market Comment, 08/06/07 Strong Economic Optimism (… is a Contrary Indicator)
Sound familiar?
![]()
     |
via Zero Hedge http://feedproxy.google.com/~r/zerohedge/feed/~3/upE3ojmwL1U/story01.htm Tyler Durden