Apparently the combination of a massive flood of excess supply in the form of new luxury developments and a Trump tax plan that penalizes people living in expensive cities by capping SALT, mortgage interest and property tax deductions was simply too much for the Manhattan real estate market to ignore in 4Q 2017. After reaching an all-time high of nearly $1.2 million in 2Q 2017 (chart per Douglas Elliman)…

…the Wall Street Journal this morning notes that median Manhattan apartment prices have dropped to $1.08 million in 4Q 2017, down 9.8% compared to the peak set earlier this year.
Not surprisingly, Pamela Liebman, the president of New York real estate broker The Corcoran Group, attributed the pause by Manhattan buyers to the tax bill and said that folks are increasingly convinced that prices peaked in 2017 and may continue to be under pressure.
“We lost a lot of deals in the fourth quarter, while people waited to see the outcome of the tax bill,” she said. “Now that the uncertainty is gone they will be able to make a decision.”
She said buyers were active but “focused on value and reasonable pricing.”
“The good news is there are a lot of buyers who are ready to purchase next year,” Ms. Liebman said. “Sellers who don’t overshoot the mark should do well.”
Of course, the New York real estate market wasn’t universally rosy during the first half of the year as another broker, Donna Olshan, who produces a weekly report on contract signings above $4 million, said there were worrying signs in the luxury market, including an increase in the average time a listing spent on the market of nearly four months, from about 10 months in 2016 to 14 months this year. As the following chart from Douglas Elliman highlights, luxury prices in Manhattan peaked 2 quarters before overall prices and have been plummeting ever since.

Meanwhile, new development prices have also been on the decline as the market contends with a steady stream of new buildings coming online.

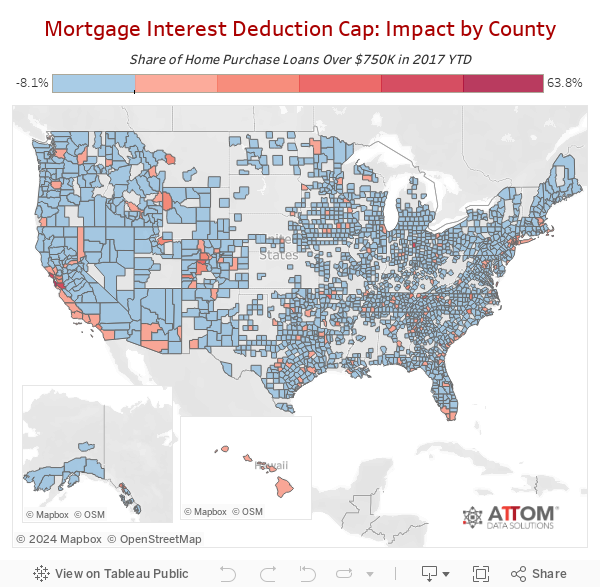
Of course, the fact that Manhattan real estate prices are coming under pressure should come as little surprise as we noted the following interactive maps from ATTOM Data Solutions last week which perfectly illustrated just how concentrated mortgages over $750,000 are in a handful of expensive cities like New York and San Francisco.
Among 2,022 counties included in this analysis and at least 50 home purchase loans so far in 2017, those with the highest share of loan originations above $750,000 were New York County (Manhattan), New York (63.8 percent); San Francisco County, California (58.0 percent); Nantucket County, Massachusetts (57.3 percent); San Mateo County, California (55.2 percent); and Marin County, California (50.o percent). Among those same 2,022 counties, those with the highest number of purchase home loan originations above $750,000 so far in 2017 were Los Angeles County, California (9,197); Santa Clara County, California (5,543); Orange County, California (4,450); Maricopa County, Arizona (3,723); and King County, Washington (3,715).
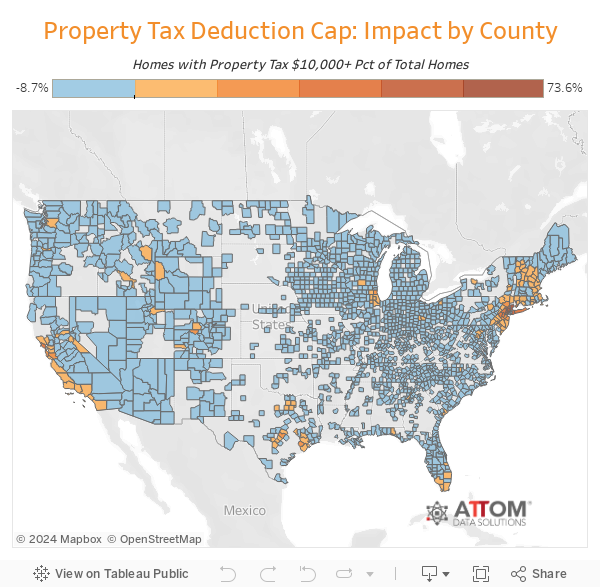
Meanwhile, the second proposed change in the GOP tax plan involved a cap on the deductibility of property taxes at $10,000. And, much like the impact of mortgage interest above, the map of who’s most impacted looks eerily similar to the 2016 electoral college map.
The county-level heat map below shows the share of single family homes and condos in each county where the most recent property tax bill available was more than $10,000.
Among the 1,731 counties analyzed, those with the highest share of homes with property taxes above $10,000 were Westchester County, New York (73.4 percent); Luna County, New Mexico (68.7 percent); Rockland County, New York (60.0 percent); Mathews County, Virginia (54.4 percent); and New York County (Manhattan), New York (52.5 percent). Among those same counties those with the highest volume of homes with property taxes above $10,000 were Nassau County (Long Island), New York (176,946); Los Angeles County, California (165,078); Suffolk County (Long Island), New York (155,592); Bergen County, New Jersey (126,096); and Harris County (Houston), Texas (125,792).
Conclusion: Low-tax, cheap cost of living states (i.e. “Red States”) are suddenly starting to look a lot more attractive to liberal “millionaire, billionaire, private jet owners” in New York who aren’t so keen on “spreading their wealth around” as their rhetoric would have you believe.
via http://ift.tt/2Dmh2jS Tyler Durden