The following is a free look at the type of research posts regularly produced for members of The Lyons Share, in addition to the other Premium content.
Yesterday saw a profusion of both new highs AND new lows on the NYSE — a condition that has often preceded poor stock market performance in the past.

After a smooth, one-way ride higher to begin 2018, stocks finally hit a speed bump this week. And along with the moderate losses came some interesting developments related to the stock market and its associated statistics. One such development was the sudden profusion of both new 52-week highs and 52-week lows on the NYSE — a condition we’ve termed a “Junkie Market” in the past, i.e., lots of highs and lows.
Specifically, both NYSE new highs and new lows came in at over 200 yesterday for just the 7th time ever. On a percentage basis, they each accounted for at least 7% of all issues traded on the NYSE. To put that into perspective, that was just the 5th time in the history of our data back to 1970 that saw both series reach that level.
And as the following chart indicates, there have now been just 15 days since 1970 that saw both new highs and new lows hit even as high as 5%.
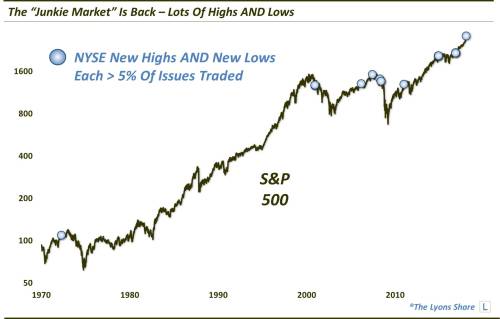
The presence of highs levels of new highs and new lows represents a key component of some notorious market warning signals like the Hindenburg Omen. As the ominous sounding names would imply, the historical stock market performance following such signals has been poor. We have found the same to be true with respect to our “Junkie Markets” — usually. A peek at the proximity of occurrences on the chart above would indicate why.
Many historical occurrences have taken place near key tops, either on a cyclical or intermediate-term basis. Why is that? We don’t have a concrete answer. Our guess is that perhaps there are a number of stocks below the surface that are breaking down – yet enough that are still performing well to mask that weakness and prevent market participants from getting too bearish. But that is just a guess. We will also note that a good deal of the increase in NYSE new lows yesterday was likely due to weakness in the bond market and the issues on the exchange that are sensitive to rates. However, that has not been a disqualifier in the past so we aren’t going to dismiss yesterday’s readings because of it.
We don’t really know (or care) why these conditions have often occurred near tops — just that that they do. And thus, the subsequent performance, in aggregate, has been poor. The following table shows the dates and forward performance of the S&P 500 following incidents when both NYSE new highs and new lows accounted for over 5% of all issues traded.
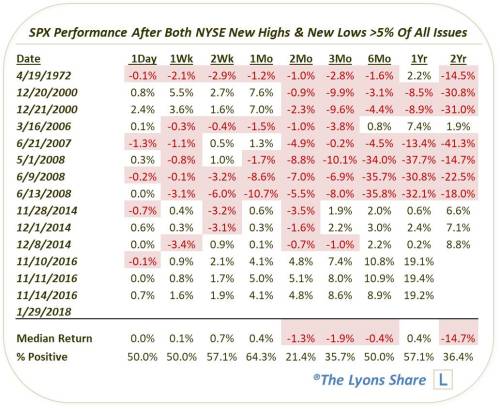
As you can see, intermediate to long-term performance has been poor. We will say that the longer-term numbers are heavily influenced by the 2000 and 2008 instances. On those occasions, the market had already topped and was well into its cyclical decline. That doesn’t really accurately portray our present circumstances, i.e., just off of a 52-week high.
Therefore, we took a look at those instances occurring just when the S&P 500 was within 1% of a 52-week high, as was the case yesterday. To increase our sample size, we did expand the sample to include all dates when new highs and new lows accounted for more than 4% of all issues. Here are the results, in aggregate, of those previous 22 occurrences since 1970.
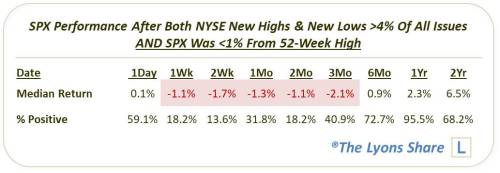
There is good news and bad news here. The good news is that, as you can see, the long-term results were not disastrous as on the above table. That’s due to the 2000 and 2008 events being weeded out in order to get a sample that is more like our current episode. The bad news is that the short to intermediate-term returns were actually weaker, and consistently weaker.
That suggests that this data point may not be the long-term death knell that it has been on several occasions in the past. However, it also suggests a high degree of risk in the near to intermediate-term. That fits with many of the studies and observances we’ve noted recently. That is, in the near-term, the market has gotten well ahead of itself and may be due for a breather. However, the internals and price structure on a longer-term basis are still solid enough that, if historical tendencies hold true, stocks should be able to withstand the shorter-term weakness and eventually put together at least one more decent push to the upside in the longer-term.
* * *
We hope you enjoyed this article. If you are interested in the Premium version of our charts and research, check out our “all-access” service, The Lyons Share. You can follow our investment process and posture every day — including insights into what we’re looking to buy and sell and when. Thanks for reading!
via RSS http://ift.tt/2BIBNVU Tyler Durden