Authored by Peter Cook via RealInvestmentAdvice.com,
“Peter Cook is the author of the‘Is That True?’ series of articles, which help explain the many statements and theories circulating in the mainstream financial media often presented as “truths.” The motives and psychology of market participants, which drives the difference between truth and partial-truth, are explored.”
Summing up the current conventional wisdom:
-
Global GDP growth has bottomed and is accelerating systematically higher,
-
Which will cause the inflation rate to accelerate higher.
-
Bond markets hate higher inflation, so interest rates have bottomed and will move even higher.
-
The stock market, dependent on low rates for high valuations, will fall if rates move higher,
-
Which is why the stock market peaked on January 26, 2018, and then declined dramatically,
-
Ushering in an era of systematically higher volatility
In this article, we will investigate the data behind the first three assertions related to GDP growth, inflation, and the bond market and offer explanations that differ from the conventional wisdom. Next Friday, we will continue this theme with a discussion of the following three assertions.
1. Global GDP Growth Is Accelerating
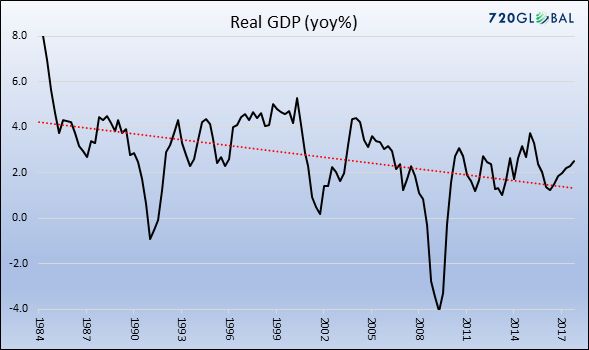
Unless GDP can be exported from another planet to Earth, the main drivers of global GDP growth are in four large economic zones. Here are the past 30 years of GDP growth in the U.S……
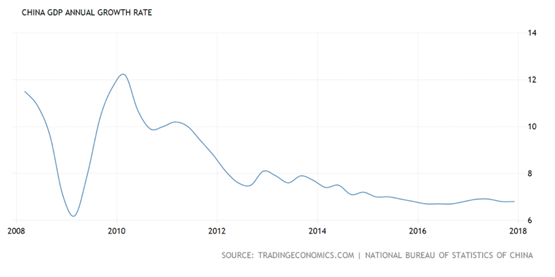
The past ten years in China……
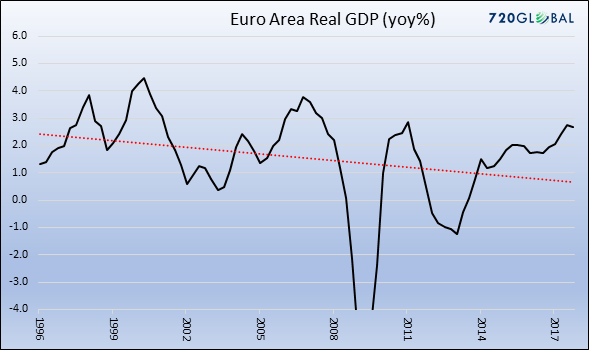
The past 20 years in Europe…..
and Japan.
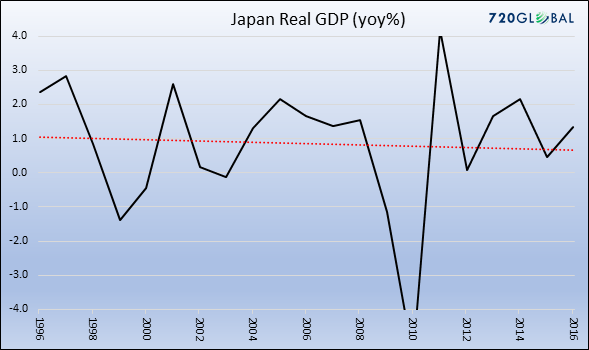
In summary, each of the main economic zones are growing at lower rates than they did 10-20 years ago. While they are each trending slightly higher after bouncing off recent troughs in early 2016, all are well within a range established since the Global Financial Crisis (GFC).
To believe that global GDP growth will move systematically higher in coming years, you need to believe that something fundamental has changed to produce higher economic growth. You would also need to believe that cures have been found to reverse the two secular constraints that are primarily responsible for the slow-growth, low inflation environment in each of these regions, which are:
- High and increasing indebtedness
- Rapidly-aging populations
The first bullet point was documented in a 2012 study Rinehart and Rogoff, in which they observed an association between government with high debt-to-GDP ratios (90%+) and subsequent period of slower GDP growth. Most people can grasp the idea that excessive debt constrains their ability to spend in the future. It is no different for a government in the long run.
The second bullet point is intuitive because of declining spending patterns as people age. The concept is most clearly demonstrated by the economic performance of Japan over the past 20 years, but many other countries (China, US, and many European countries) are on this same path. But a deep dive into each of these issues is beyond the scope of this article
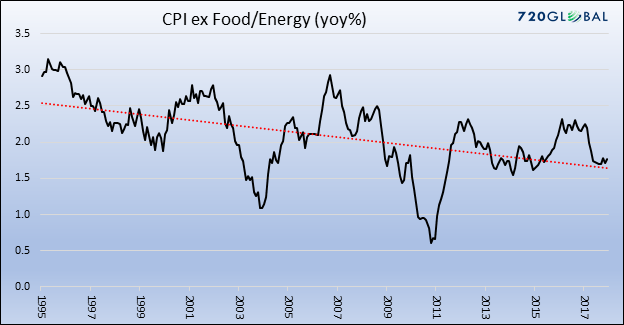
2. Rising Inflation
Below is the chart of US annual inflation rate since the mid-1990s’ during which time it has fluctuated between 1.0% and 2.4%, and is currently at 1.5%. Nothing significant seems to have changed here.
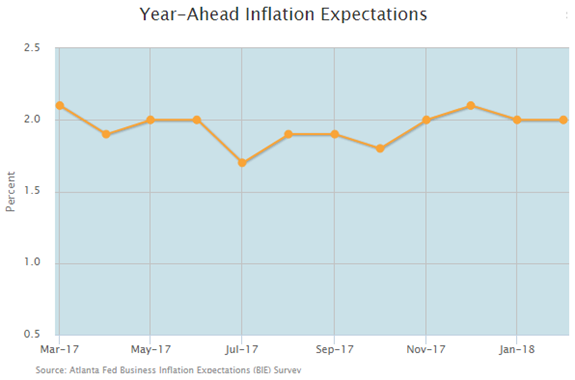
Business leaders don’t sense an imminent change in inflation in the next 12 months either. Their expectations have ranged between 1.7% and 2.1% over the past year.
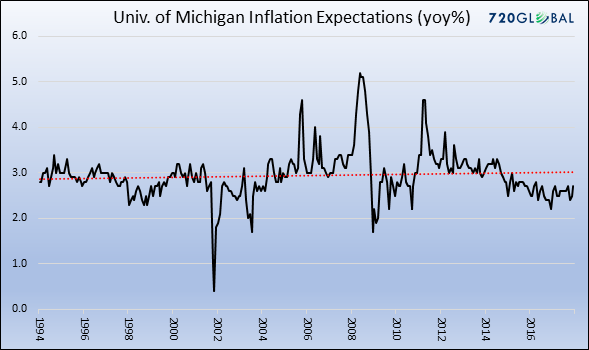
Consumers don’t seem too worried about a rise in inflation either. The current expectation is a little below 3%, which is near the average of the past 20 years, in addition to being consistent with the past several years.
Sticking with the theme of the consumer, real income in the US has risen in recent years, and is near the top of the range of -3% to +4% which has existed over the past 20 years. Could this be inflationary?

It depends. Consumers aren’t doing anything out of the ordinary compared to the recent or distant past, as the annual growth in retail sales is stuck in the middle of the range of the past few years.
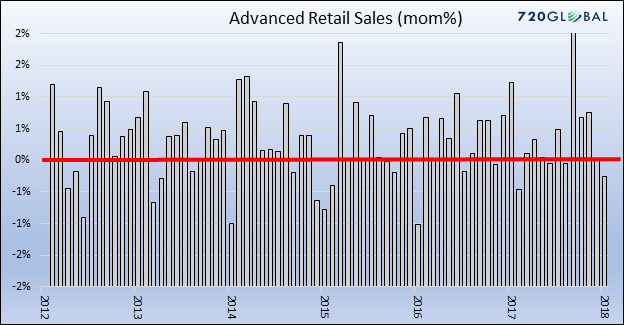
If anything, it is possible that the spike higher in retail sales during Q4 2017 was caused by rebuilding activity after the Florida hurricane and Texas hurricane/flooding events in early September as well as holiday-related spending. If so, that blip is beginning to reverse, as shown by the most recent retail sales data.
-
Bond Market Reaction
Summing up the data presented so far, neither global GDP growth nor US inflation are systematically higher, and to believe they will rise sharply out of the range of the past 10-20 years, you would have to believe that GDP growth and inflation will overcome the two main constraints on economic growth, which are a high and rising debt burden, and an aging population.
So why would interest rates be moving higher over the past couple of months, and why would there be so much noise about that fact in the financial media? We can think of two alternative explanations.
The first explanation is behavioral, meaning that it is rooted in how and why humans act and interact in markets, a subject of focus for the authors of the Epsilon Theory articles. The chart below shows the history of the 10-year Treasury bond yield over the past 140 years.
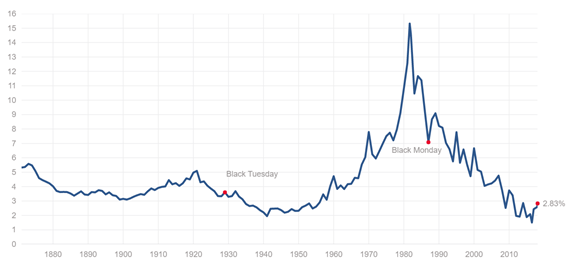
Source: multpl.com
Imagine the professional competition to predict the peak in interest rates in the early 1980s. To win that competition, you would have somehow had to keep quiet (and keep your job) while rates rose from 7% to 15%, and then had to become a very lonely bull among a legion of bears at the precise peak in rates or shortly thereafter. Today, very few remember the even fewer number of bulls that precisely called the peak in interest rates.
In beautiful symmetry, today the professional competition to predict the bottom in interest rates is fierce. To accomplish that feat, you could not have previously called a bottom in rates, because you only get one shot to be correct. A prediction of an inflection point in interest rates won’t arise out of an Ouija board; solid logic and data will be used to justify the prediction. But ultimately, those reasonable justifications could be hiding a different motivation, which is the fame that would accrue from calling the inflection point after multi-decade bull market in bonds. Because the inflection points are so rare, most careers come and go without the opportunity to predict a sea change, so it is understandable why some would be tempted.
But it is also extremely important to understand that a prediction, or new theory, may change the mainstream narrative but it does not change underlying reality, a consistent theme in this series of articles. In this case, forecasts of higher GDP growth and inflation don’t make actual GDP and inflation rise, a lesson that should have been learned over the past decade. Instead, economic events will happily come and go regardless of who or how many financial market observers call for an inflection point in GDP growth, inflation, and interest rates.
Viewed from this perspective, it is easy to envision a scenario in which rise in rates during the first half of 2018 and is followed by yet another lurch lower in the second half of 2018 when the expected rises in GDP growth and inflation do not materialize. Recent fund flow data supports the potential for a change in view (and price/yield), because a record short position has been amassed in bonds, as shown below.

A second explanation for the recent spurt higher in rates is rooted in fundamental analysis. It is certainly true that budget deficits are rising. The argument is that increased supply of government bonds will force interest rates higher. That was the same argument used in the early 1980s when the Reagan tax cuts took effect, yet interest rates continued to fall. Similar predictions on the inevitability of rising rates were made in the wake of the Bush tax cuts of 2003, yet interest rates continued to fall. Obviously, larger forces than a supply/demand imbalance were dominant during those periods.
But there is one crucial difference in the economic environment today that didn’t exist in the early 1980s or 2003, as shown below.
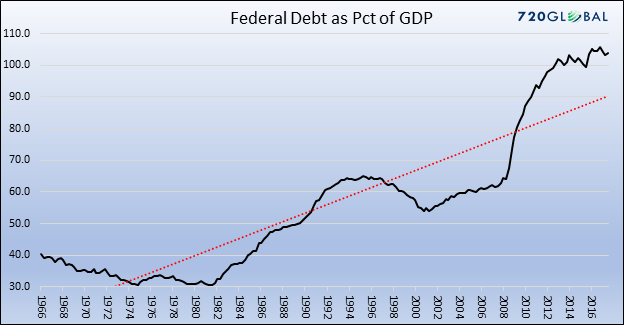
In coming months and years, the US government is going to test its ability to issue additional debt in ways it didn’t in the 1980s or 2003, because its debt-to-GDP ratio is greater than 100%, which is 3x what it was in 1980 and roughly 2x what it was in 2003. Layering even more uncertainty on the supply/demand imbalance is the fact that the Fed is unwinding its massive QE program. That is, an unparalleled monetary experiment is occurring at the same time as an unprecedented borrowing experiment with a high debt-to-GDP ratio.
So the recent rise in interest rates may not be a market prediction of higher GDP growth and inflation. Instead, the rise in rates could be a recognition of the unprecedented twin experiments. If so, we could actually be witnessing the nascent signs of credit risk in the US Treasury market.
Financial textbooks have ruled out the possibility of credit risk embedded into US Treasury yields. After all, the US Treasury rate is the well-known “risk-free rate” on which all of modern financial theory is grounded. However, we repeat that the existence of a theory doesn’t change the way the world works in reality. Sometimes prevailing theories must change, especially when radical changes are afoot, including the existence of the enormous ($50-100 trillion) unfunded liabilities of Medicare and Social Security. Take another look at the chart of the US debt-to-GDP ratio, and see if the term “credit risk” doesn’t come to mind, even if it will never come to mind while reading a financial textbook.
Further, in another Rinehart and Rogoff study, “This Time Is Different: Eight Centuries of Financial Folly,” sharply rising housing prices and large capital inflows (to finance large trade deficits) tend to occur prior to financial crises. Those two conditions were present before 2008, and they are present again in 2018. As the title suggests, the authors also cite the tendency of leading thinkers who fail to learn the lessons of history, and who dismiss serious risks as irrelevant to their era.
Finally, many financial analysts have been perplexed by the anomalies that European sovereign bonds issued by countries such as Portugal, and even European junk bonds, are trading at yields lower than US Treasury bonds. This is particularly odd given that the US issues bonds denominated in US dollars, the reserve currency, which should require a lower yield. While it is impossible to state that credit risk is the sole reason for these observed anomalies, these are the types of anomalies you would expect to see if credit risk was beginning to creep into US Treasury prices.
Conclusions
It is possible that the mainstream narrative is correct and that the recent rise in rates is foreshadowing a future of higher GDP growth and inflation. If so, then markets are discounting a future not yet seen, which is how market sometimes operate. But sometimes they don’t. The current levels of GDP growth and inflation are well within their recent ranges, and those recent ranges are lower than they were 10-20 years ago. More importantly, the underlying problems of high debt levels and aging demographics will continue to constrain the potential for GDP growth and inflation to systematically rise, which are the main reasons that interest rates have persistently declined over the past several decades. Predicting a regime change to much higher GDP growth, and hence higher inflation, could simply be a case of looking for, and then seeing, something that isn’t there.
Instead, there are two alternative explanations for the recent rise in US Treasury rates.
One is the inevitable temptation of high-profile investors to burnish their professional reputations by “calling the bottom” in rates, which has the power to change the narrative (and prices) in financial markets but it doesn’t have the power to change underlying economic reality. That is, if high-profile investors put their money where their mouths are, it will affect prices in financial markets, which will affect the perception of other investors, who may tag along with similar strategies. But there is a short shelf life for that type of process because economic reality will eventually unfold, revealing whether the forecasts of high-profile investors are correct. As unlikely as it seems now, it is quite possible that they won’t be correct, and that slow GDP growth and low inflation are here to stay awhile longer. Or, given the length of the tepid economic expansion and high indebtedness, it is even possible that recession arrives prior to the visions of a systematic rise in GDP growth and inflation. That is one of the implications of the Rinehart and Rogoff study.
Another explanation for rising rates is the emergence of credit risk in US Treasury bonds, the result of the simultaneous and unprecedented experiments of monetary policy (unwind of QE) and fiscal policy (a borrowing binge with a high debt-to-GDP ratio). The concept of credit risk in US Treasury prices is outlawed in financial theory. But other aspects of today’s financial landscape, such as negative interest rates or European junk bonds trading at lower yields than US Treasury bonds, also weren’t supposed to occur and cannot be explained by orthodox financial theories. Theories can change how we observe facts, but they can’t change the facts.
via Zero Hedge http://ift.tt/2olIIAA Tyler Durden