In a disturbing echo of the runup to the housing crisis, a recent study has revealed that the practice of flipping homes in the US is back in vogue – with the number of houses flipped rising to its highest level in 11 years.
If that doesn’t spook residential real-estate speculators, we’re not sure what would. Hundreds of thousands of American homebuyers have apparently forgotten how, 11 years ago, a Mexican immigrant working as a strawberry picker in Bakersfield, California, making $14,000 per year, was lent every single penny he needed to purchase a $720,000 home. And as crazy as that might sound, stories such as that were alarmingly common during the period before the 2008 housing crash (though, of course, few, if any, alarm bells actually went off).

Last year, we noted that investors had started flipping homes as if it were 2006 all over again, with the number of homes flipped accounting for 6.1% of all US home sales. Back in 2006, the figure rose to a record 7.3%.
What’s worse, we pointed out that the cities with the highest rates of home-flipping were essentially the same cities that were the hardest hit by the crisis.

Now, data provided by ATTOM Data Solutions – which maintains the largest database of US home sales – showed the home flipping reached a new peak, with 207,088 single family homes and condos flipped in 2017, up 1% from the 204,167 homes flipped during 2016. Again, that’s the highest rate since 2006. That’s 5.9% of all single family home sales.
Meanwhile, a total of 138,410 entities (which includes both individuals, who typically buy and sell under the cover of an LLC, and institutions) flipped homes in 2017, up 4% from the 133,407 entities that flipped in 2016 to the highest level since 2007. That’s a 10-year high.
However, an executive at ATTOM Data Solutions assured readers that home-flipping today is “built on a more fundamentally sound foundation than the flipping frenzy that we witnessed a little more than a decade ago.
Home flip lending volume up 27 percent to 10-year high
The total dollar volume of financed home flip purchases was $16.1 billion for homes flipped in 2017, up 27% from $12.7 billion in 2016 to the highest level since 2007 — a 10-year high.
Meanwhile, the total dollar volume of financed home flip purchases was $16.1 billion for homes flipped in 2017, up 27% from $12.7 billion in 2016 to the highest level since 2007 — a 10-year high.
Average home flipping returns pull back from all-time high
Sales of flipped homes in 2017 yielded an average gross profit of $68,143 (the difference between median purchase price and median flipped sale price) – a 5% increase from an average gross flipping profit of $64,900 in 2016 to a new all-time high for as far back as data is available (2000).
That profit represented a nearly 50% ROI, which is actually down from an all-time gross ROI of 51.9% ROI in 2016.
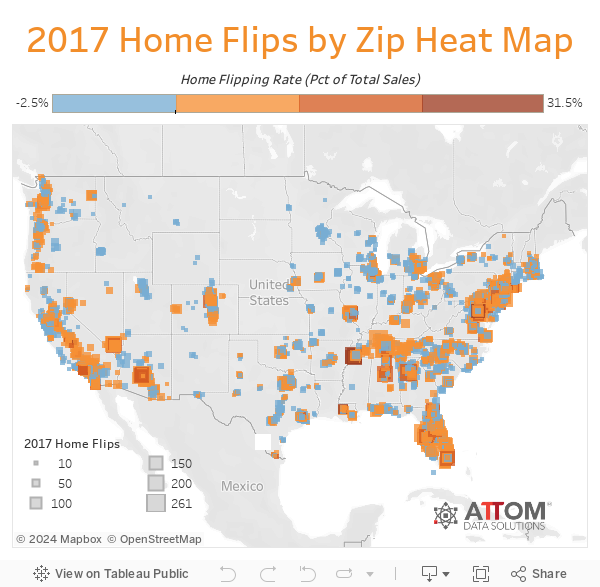
Among 52 metro areas analyzed in the report with at least 1 million people, those with the highest home flipping rate in 2017 were Memphis, Tennessee (12.8%); Las Vegas, Nevada (9.1%); Tampa-St. Petersburg, Florida (9%); Birmingham, Alabama (8.6%); and Phoenix, Arizona (8.5%). While the cities with the biggest increase in home flipping rates were Buffalo, New York-Northern New Jersey, Dallas-Fort Worth, Louisville Kentucky.
Homes on average took 182 days to flip in the US last year, tied with 2016.
With US home prices having finally surpassed their pre-crisis peak, and, in 80% of US cities, valuations are growing faster than wages…

And as credit card, student loan and auto debt swell to record highs, we imagine millennials – who are perhaps the most indebted generation in recent history – will swiftly pick up the slack and keep pushing these prices higher…
via RSS http://ift.tt/2IqDoE9 Tyler Durden